From the “this ought to shut up the “Skydragon slayers” department. Despite sophomoric claims that I’m a “denier”, I’ve never disputed that CO2 has a role in warming via retardation of IR transfer from the surface to the top of the atmosphere. What is really the issue related to AGW claims are the posited/modeled but not observed feedbacks and the logarithmic (not linear) saturation curve response of CO2. Along those lines, eyeballing the graph presented from the north slope of Alaska, it appears there might be a bit of a slowdown or “pause” in the rate of forcing from about 2007 onward. Hopefully, LBL will release the data for independent analysis.

First direct observation of carbon dioxide’s increasing greenhouse effect at the Earth’s surface
Berkeley Lab researchers link rising CO2 levels from fossil fuels to an upward trend in radiative forcing at two locations
Scientists have observed an increase in carbon dioxide’s greenhouse effect at the Earth’s surface for the first time. The researchers, led by scientists from the US Department of Energy’s Lawrence Berkeley National Laboratory (Berkeley Lab), measured atmospheric carbon dioxide’s increasing capacity to absorb thermal radiation emitted from the Earth’s surface over an eleven-year period at two locations in North America. They attributed this upward trend to rising CO2 levels from fossil fuel emissions.
The influence of atmospheric CO2 on the balance between incoming energy from the Sun and outgoing heat from the Earth (also called the planet’s energy balance) is well established. But this effect has not been experimentally confirmed outside the laboratory until now. The research is reported Wednesday, Feb. 25, in the advance online publication of the journal Nature.
The results agree with theoretical predictions of the greenhouse effect due to human activity. The research also provides further confirmation that the calculations used in today’s climate models are on track when it comes to representing the impact of CO2.
The scientists measured atmospheric carbon dioxide’s contribution to radiative forcing at two sites, one in Oklahoma and one on the North Slope of Alaska, from 2000 to the end of 2010. Radiative forcing is a measure of how much the planet’s energy balance is perturbed by atmospheric changes. Positive radiative forcing occurs when the Earth absorbs more energy from solar radiation than it emits as thermal radiation back to space. It can be measured at the Earth’s surface or high in the atmosphere. In this research, the scientists focused on the surface.

They found that CO2 was responsible for a significant uptick in radiative forcing at both locations, about two-tenths of a Watt per square meter per decade. They linked this trend to the 22 parts-per-million increase in atmospheric CO2 between 2000 and 2010. Much of this CO2 is from the burning of fossil fuels, according to a modeling system that tracks CO2 sources around the world.
“We see, for the first time in the field, the amplification of the greenhouse effect because there’s more CO2 in the atmosphere to absorb what the Earth emits in response to incoming solar radiation,” says Daniel Feldman, a scientist in Berkeley Lab’s Earth Sciences Division and lead author of the Nature paper.
“Numerous studies show rising atmospheric CO2 concentrations, but our study provides the critical link between those concentrations and the addition of energy to the system, or the greenhouse effect,” Feldman adds.
He conducted the research with fellow Berkeley Lab scientists Bill Collins and Margaret Torn, as well as Jonathan Gero of the University of Wisconsin-Madison, Timothy Shippert of Pacific Northwest National Laboratory, and Eli Mlawer of Atmospheric and Environmental Research.
The scientists used incredibly precise spectroscopic instruments operated by the Atmospheric Radiation Measurement (ARM) Climate Research Facility, a DOE Office of Science User Facility. These instruments, located at ARM research sites in Oklahoma and Alaska, measure thermal infrared energy that travels down through the atmosphere to the surface. They can detect the unique spectral signature of infrared energy from CO2.
Other instruments at the two locations detect the unique signatures of phenomena that can also emit infrared energy, such as clouds and water vapor. The combination of these measurements enabled the scientists to isolate the signals attributed solely to CO2.
“We measured radiation in the form of infrared energy. Then we controlled for other factors that would impact our measurements, such as a weather system moving through the area,” says Feldman.
The result is two time-series from two very different locations. Each series spans from 2000 to the end of 2010, and includes 3300 measurements from Alaska and 8300 measurements from Oklahoma obtained on a near-daily basis.
Both series showed the same trend: atmospheric CO2 emitted an increasing amount of infrared energy, to the tune of 0.2 Watts per square meter per decade. This increase is about ten percent of the trend from all sources of infrared energy such as clouds and water vapor.
Based on an analysis of data from the National Oceanic and Atmospheric Administration’s CarbonTracker system, the scientists linked this upswing in CO2 -attributed radiative forcing to fossil fuel emissions and fires.
The measurements also enabled the scientists to detect, for the first time, the influence of photosynthesis on the balance of energy at the surface. They found that CO2 -attributed radiative forcing dipped in the spring as flourishing photosynthetic activity pulled more of the greenhouse gas from the air.
###
The scientists used the National Energy Research Scientific Computing Center (NERSC), a DOE Office of Science User Facility located at Berkeley Lab, to conduct some of the research.
The research was supported by the Department of Energy’s Office of Science.
The CO2/Forcing graph runs from the 2000 La Nina to the 2010 El Nino.( Surprise)
It is of interest to compare this with the RSS temperature data in order to see what it tells us about climate sensitivity to CO2.
http://www.woodfortrees.org/graph/rss/from:1980.1/plot/rss/from:1980.1/to:2003.6/trend/plot/rss/from:2003.6/trend
First it is obvious from the RSS data any calculation from 2000 – 2010 will come up with a high sensitivity lambda probably close to the modelers 5.35
Second – this time frame crosses the temperature peak in the 1000 year millennial solar ,cycle seen at 2003 in the RSS data.
Later than that ,if you believe that CO2 is the main driver it must obviously be acting as a coolant.
This conclusion would be strengthened by the CEREs data which also shows the change in trend from warming to cooling at about 2003- see the earlier comment and data provided by Kristian 2/25/1:28pm
http://wattsupwiththat.com/2015/02/25/almost-30-years-after-hansens-1988-alarm-on-global-warming-a-claim-of-confirmation-on-co2-forcing/#comment-1869015
The fact is that ,like the IPCC, we don’t know what the CO2 sensitivity is, yet it is the key factor in making CO2 emission control policy and the basis for the WG2 and 3 sections of AR5. By AR5 – WG1 the IPCC itself is saying: (Section 9.7.3.3)
“The assessed literature suggests that the range of climate sensitivities and transient responses covered by CMIP3/5 cannot be narrowed significantly by constraining the models with observations of the mean climate and variability, consistent with the difficulty of constraining the cloud feedbacks from observations ”
In plain English, this means that the IPCC modelers have no idea what the climate sensitivity is. Therefore, there is no credible basis for the WG 2 and 3 reports and the SPM and the Government policy makers have no empirical scientific basis for the entire UNFCCC process and their economically destructive climate and energy policies.
Climate sensitivity to CO2 ( and especially anthropogenic CO2) is certainly small enough that it can safely be ignored when making climate forecasts .
We must move to another forecasting paradigm based on the natural solar cycle periodicities seen in the temperature and driver data. For forecasts of the timing and extent of the coming cooling based on these natural cycles see.
http://climatesense-norpag.blogspot.com/2014/07/climate-forecasting-methods-and-cooling.html
It is almost like talking to a brick wall when trying to show how clearly the data refutes AGW theory and yet this nonsense keeps going on and on. Data does not matter to them only the scam ,they are trying to keep alive.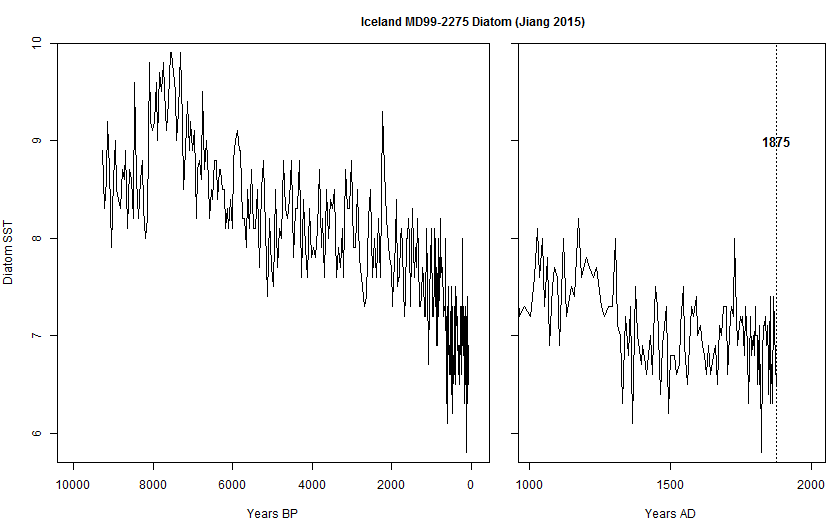
More data which shows since the Holocene Optimum from around 8000BC , through the present day Modern Warm Period( which ended in 1998) the temperature trend throughout this time in the Holocene, has been in a slow gradual down trend(despite an overall increase in CO2, my first chart ), punctuated with periods of warmth. Each successive warm period being a little less warm then the one proceeding it.
My reasoning for the data showing this gradual cooling trend during the Holocene ,is Milankovitch Cycles were highly favorable for warming 10000 years ago or 8000 BC, and have since been in a cooling cycle. Superimposed on this gradual cooling cycle has been solar variability which has worked sometimes in concert and sometimes in opposition to the overall gradual cooling trend , Milankovitch Cycles have been promoting.
Then again this is only data which AGW enthusiast ignore, if it does not fit into their scheme of things.
http://www.murdoconline.net/wordpress/wp-content/uploads/2011/01/gisp2-ice-core-temperatures.jpg
Salvatore
Comparing Arctic paleo-magnetic and Greenland Gisp2 ice cores data, a good match is obtained
http://www.vukcevic.talktalk.net/HRec.gif
However there is a major problem, time lines do not agree by a large margin
– Ice core data annual count is too short (missing about 20% of years, evenly spread between 5000 and 500 years BP)
or
– Paleo-magnetic samples have been dated to be older by similar number of years evenly spaced.
Although either is likely, I suspect the paleo-magnetic data.
If you, too, could use a good laugh after reading some of the comments above, here is the grand daddy of all climate l1ars (he isn’t that stupid):
James “Planetary Emergency” Hansen Doubling Down
on His Failed 1988 Prophecies (youtube)
{at :45} “We have already reached a tipping point. We are going to lose all the sea ice in the Arctic in the summer season.” James Hansen, 2008.
Arctic Sea Ice
http://www.ijis.iarc.uaf.edu/seaice/extent/Sea_Ice_Extent_v2.png
The North Slope of Alaska (Point Barrow) instruments may have stopped reporting data in 2010?http://www.arm.gov/sites/nsa
And the Southern Great Plains facility is located near cattle farms and oil/gas fields:
I wonder whether the declining radiative curve in the study’s later years is in any way related to changes in local emissions (CO2 and CH4) due to the varying fortunes of the cattle industry and the oil & gas industry?
Looks like both “forcing” and CO2 are highly correlated to summer/winter. Since they are measuring 0.1 changes in “forcing”, I wonder how much error is introduced from temperature changes? Does their instrument drift depending on whether it is 15F in Oklahoma or 105F?
How come the data ends at 2011? Why is the forcing dropping as CO2 increases?
“How come the data ends at 2011?”
I’m going to guess that if they took it all the way through 2014, the plateau becomes embarrassing and obvious…..
GLOBAL WARMING IS REEAAALLLL….
…….llly small.
In a reply to Steven Mosher above, I wondered whether they had direct in situ measurements demonstrating precisely 22 ppm increases in CO2 during their study period. The SGP site did, indeed, have a CO2 measuring capability. See http://www.arm.gov/instruments/pgs for further information. The ARM site states that:
In addition, the SGP site had a CO2 flux measurement system (http://www.arm.gov/instruments/co2flx) and airborne flask sampling near the facility.
Nevertheless, the impressively exact values described in the paper are derived from model calculations against the measurements, rather than direct observations at each of the two sites. In addition, I was befuddled by their Extended Data Figure 3 (b) which appears to show that the fossil fuel component of their Carbon Tracker’s CO2 concentrations rose from 0 ppm in year 2000 to approximately 40 ppm by 2011. I must be reading their graph incorrectly. http://www.nature.com/nature/journal/vaop/ncurrent/fig_tab/nature14240_SF3.html
Dear Dr. Feldman,
I was very interested in the media reports of your recent paper “Observational Determination of Surface Radiative Forcing by CO2 from 2000 to 2010”. Unfortunately, the media reporting seems unsupported by even an abstract in Google Scholar or similar engines. I am a subscriber to “Nature News Alerts” and the most recent had no mention either.
It is my understanding that there are no earth spectral bands in which CO2 resonates that water does not also resonate. It is my understanding that there is a unique CO2 band in the near IR incoming solar spectrum which seems lunch money in total intensity.
My specific question is that since you “measure thermal infrared energy”, and “Other instruments at the two locations detect the unique signatures of phenomena that can also emit infrared energy, such as clouds and water vapor “ exactly which bands do you use to distinguish photons emitted by the molecules H20 and CO2?
Regards,
Gordon
I have a question:
When using a radio telescope, is not the back radiation characteristics of the atmosphere rather like light polution when using an optical telescope?
If that is so, is there any data as to how changes in the Earth’s atmosphere has impacted upon radio telescopes these past 50 or so years?
Do radio telescopes have to be tuned/calibrated to ‘block out’ the effects of Earth’s atmosphere? If so, this tuning/calibration data could give a useful insight into changes.
Anyone got any thoughts
I believe radio telescopes are characterized to eliminate or reduce the effects of local radio sources as well as white noise generated by the electronics themselves. Whether there is also a means of characterizing any RF effects of Earth’s atmosphere is likely, but I am not sure how that would be done. Local sources would be more likely to have a greater negative effect on the sensitivity of a radio telescope than noise generated by the atmosphere. On the other hand any auroral activity could create RF noise across a wide spectrum.
That massive annual sawtooth on the CO2 graph seems really significant to me. I don’t think that it can all be explained by spring plant growth. We know that CO2 is absorbed and emitted by H2O, so does the sawtooth track with the amount of water in the atmosphere?
TonyN:
The sawtooth graph does reflect seasonal uptake (and release) of CO2 by plants, largely driven by temperate zones rather than tropical. The secular trend (slope) of the sawtooth also appropriately reflects gradual increases in global CO2 from (largely) human activities. I have no idea what you mean when you say “We know that CO2 is absorbed and emitted by H2O….”
I actually have no problems with the basic physics being explored by these authors. My questions arise from their assertion of remarkable precision via actual observations. And if their results are truly a near-perfect image of CO2 forcing, why does the slope of the forcing signal go down in the last years even as the CO2 ppmv value continues its steady increase?
Does the physics change (???) or is there some unexplained source of data contamination at work?
@ur momisugly opluso; thanks for your reply,
I am interested in the issue, because I just don’t buy the world-wide annnual CO2 flux ‘sawtooth’ being attributed just to leaf-growth in the northern hemisphere temperate zone. To me, the rates appear too high, and the timings look ‘off’. I speculate that there may be another mechanism at work
I should have said that we know that CO2 is absorbed and released by water … Henry’s law tells us that there will be around 50x more CO2 in the water than there will be in the atmosphere, so it does not take much of a change in atmospheric pressure, or sea surface temperature, to cause a lot of outgassing and indeed reabsorbtion. Now, IF Henry’s law also applies to airborne moisture, i.e. that CO2 is absorbed and released by water vapour via small changes in atmospheric or temperature changes ….. then we could have another mechanism to account for the extraordinary annual flux of atmospheric CO2. A possible indicator could be the amount of CO2 absorbed within the average cloud, and how that would change with changes in temperature and pressure ( i.e. convection).
To speculate even further, could CO2 diffusion via cloud convection be a major mechanism to explain the apparent ‘well-mixed’ claim for atmospheric CO2?
Looking at that sawtooth pattern I notice something interesting about the timing of the peaks and troughs.
The peaks are around March when the southern oceans are at their warmest whereas the troughs are around September when the northern oceans are at their warmest.
Since there is far more ocean in the southern hemisphere that is exactly what one would expect to see if the sawtooth pattern is produced by sunlight driving CO2 out of sun warmed ocean surfaces first in one hemisphere and then in the other hemisphere.
As for the background upward trend it would then be logical that multidecadal changes in global cloudiness would be the cause.
The conventional assumption that the fall in CO2 at the end of the northern hemisphere summer is a result of summer take up of CO2 by the northern biosphere may not be correct.
The biosphere suggestion does not allow for multidecadal changes in CO2 but the cloudiness suggestion does when one realises that the climate zones shift to and fro latitudinally over multidecadal timescales in response to changes in solar activity across multiple solar cycles.
Poleward shifting when the sun is active reduces global cloudness whereas equatorward shifting when the sun is quiet increases global cloudiness.
Northern hemisphere biosphere activity peaks around July since by that date the leaf growth starts to slow in favour of seed production. If the biosphere were causing the sawtooth I would not expect the peaks to be in March and the troughs in September. Rather it would be January and July respectively. By September, northern hemisphere biosphere activity is already well past its peak.
I think a serious error has occurred with the assumption that the biosphere causes the sawtooth pattern.
Sunlight on water could well be the real cause.
Hi Gordon.
Thanks for your interest in my paper.
As you probably know, H2O is the most important greenhouse gas following by CO2. Around wavelengths of 15 um, CO2 has extremely strong absorption features associated with the fundamental bending mode of that molecule (sometimes spectroscopists refer to it as the nu-2 band). H2O has relatively weak absorption around 15 um, which is why CO2 is as important a greenhouse gas as it is. Since there are a large number of lines associated with the CO2 bending mode, due to rotational transitions , referred to as the P- and R-branches, which are weaker than the fundamental and thus change more quickly with rising CO2, adding 22 ppm to the atmosphere in a decade leads to a change in transmission in those features and thus an increased greenhouse effect.
The overlap of H2O and CO2 features is important and something that we consider, but I should note that even if features overlap, that can both contribute to a greenhouse effect. Where lines are unsaturated, the effect is approximately linear, and where they are saturated, the effect is approximately logarithmic. If you have a chance, check out Goody and Yung 1989 … it’s pretty mathematical but it does describe the basics of how this all fits together.
Cheers,
Dan
Isn’t it interesting how a mechanism that can increase the Earth’s average surface temperature by 33C can be so difficult to isolate and measure?
“0.2 Watts per square meter per decade”
What was the IPCC AR5 prediction of Watts per square meter per decade?
Using the standard Radiation = Sigma(S/B Constant) *Epsilon(about .5)*Temp^4 (Temp =300 K, for start) I find a needed 0.7 degree C (K) upward shift to put out 2 more watts per meter^2, i.e. 100 years down the line.
NOT SOMETHING TO WORRY ABOUT!
This is a very nice result but it measures rather less forcing than predicted by radiative transfer models. Fits to a range of these models show (Mehr et al.) that radiative forcing as CO2 concentration rises from a value C0 to a final value C should be
forcing = 5.3*in(C/C0)
putting the numbers in we would expect 5.3*ln (395/368) = 0.35 W/m2
Whereas the measured value is 0.2 W/m2 or 40% less than expected.
People should not readily jump to conclusions about the validity of this ‘confirmation on CO2 forcing’.
Look at it this way. If CO2 creates more warming, think about the following situation. If CO2 emissions is steadily rising around the globe, then how come temperatures bobs up and down so much and quite significantly? In places like Alice Springs, in the middle of the year, temperature during a June day can vary between early morning and midday by 20 degrees centigrade without any influence from CO2, then cool again in the afternoon? Clearly, CO2, which is not a meteorological parameter, cannot have much effect on temperature.
The sun is the primary source of energy. What CO2 may do is absorb some energy and emit it but not add anymore heat to that which exists.
CO2 acts like this. Imagine a manufacturing company (the Sun) manufactures widgets (heat). A wholesaler (CO2) purchases 500 widgets (absorbed energy). The wholesaler actually receives 600 widgets instead. So the wholesaler returns to the manufacturer the extra 100 widgets (emitted energy). The manufacturer takes back the 100 widgets. Has the manufacturer increased production (created more heat) because it receives back the 100 widgets? Of course not. No extra widgets were produced.
The first and second laws of thermodynamics are laws of nature. Also, temperature is related to atmospheric mass, gravity and pressure, which explain the atmospheric temperature profiles of Earth, from the surface to the top of the atmosphere. And it has nothing to do with CO2 or that IPCC fraudulent term “back-radiation”.
It’s time to create an automatic ( and viral) response every time someone says that additional CO2 causes warming. That response should be “No, CO2 does not, and cannot create heat, it just slows down cooling. “
I’m not too bright so I try to think simply. I grew up in a chilly attic room with steam a radiator. So the input was steam from the oil burner down in the basement. It heated the room poorly because all the heat went straight up, convection, there wasn’t any conduction unless I sat and leaned my back against the radiator, if I sat nearby instead I could get a little infrared warming. The convection currents had cooled by the time they were pushed around the room and back to the bottom of the radiator. So I have learned from climate science that if I had placed another radiator in the room a few feet away that, without connecting steam to it, it would be heated by infrared, helping to warm the room, and it would make the original heater hotter by reflecting infrared back to it as well. If I put enough disconnected radiators in the room it would get too hot. Is that right?
“If I put enough disconnected radiators in the room it would get too hot. Is that right?”
Don’t forget you need plenty of open water sources in the room to get the water vapor feedback the IPCC depends upon in their models…
8>)
No silly. You had two problems.
1. You needed to throw a blanket over your roof to create a greenhouse that would keep all the heat from your room from escaping to space.
2. You would have to strap all the disconnected radiators to your ceiling so that the absorbed and re radiated infared was directed back down into your room.
3. You’d have to stop breathing on your room, because all of that additional CO2 would eventually raise the temp so high, your room would spontaneously combust, leaving a giant pingo.
/sarc
https://www.scribd.com/doc/257319806/Assesment-of-Atomospheric-Radiation-Measurement-Results-Published-Feb-25-2015-Nature-NASA-NOAH-12-year-Project
Got it! You can download my write up (with nice MathCAD math format, like a text book) on ScribD
The media is agog over the Lawrence Lab paper, saying that it measures the warming effect of CO2 in the atmosphere, and is proof of the greenhouse gas effect.
This paper claims to prove rising CO2 in the atmosphere increases downwelling infra-red radiation (DWIR), thereby warming the earth’s surface. The claim is based on observations from 2 sites, in Alaska and Oklahoma. Let’s examine the case made.
Observation: In Alaska and Oklahoma CO2 and DWIR are both increasing.
Claim: Additional CO2 is due to fossil fuel emissions.
Claim: Higher DWIR is due to higher CO2 levels.
Claim: Global DWIR is rising.
Claim: Global surface temperatures are rising.
Conclusion: Fossil fuel emissions are causing Global surface temperatures to rise
Issue: What is the source of rising CO2?
Response: Natural sources of CO2 overwhelm human sources.
The sawtooth pattern of seasonal CO2 concentrations is consistent with release of CO2 from the oceans. Peaks are in March when SH oceans are warmest (60% of world oceans), and valleys are in September when NH oceans are warmest. In contrast biosphere activities peak in January in SH and July in NH.
CO2 content of the oceans is 10 times that of the atmosphere, resulting in the sawtooth extremes. Human emissions are ~5 to 7 Gigatons compared to ~150 Gigatons from natural sources.
Issue: What is the effect of H2O and CO2 on DWIR?
Response: H2O provides 90% of IR activity in the atmosphere.
The long term increase in DWIR can be explained by increasing cloudiness, deriving from evaporation when the sunlight heats the oceans. A slight change in H2O vapor overwhelms the effect of CO2 activity, and H2O varies greatly from place to place, while the global average is fairly constant.
Issue: What is the global trend of DWIR?
Response: According CERES satellites, DWIR has decreased globally since 2000, resulting in an increasing net IR loss upward from the surface.
Globally, Earth’s surface has strongly strengthened its ability to cool radiatively from 2000 to 2014 (by about 1.5 W/m2 or ~1 W/m2 per decade) according to CERES. The increased upward heat loss from the surface is matched by decreasing trend of DWIR globally. And this is in spite of significantly increasing atmospheric content of both CO2 and H2O (WV & clouds) + allegedly rising temps since 2000.
Conclusion:
The rise in CO2 is almost all from natural sources, not fossil fuel emissions.
IR activity is almost all from H2O, not from CO2.
Global DWIR is lower this century, and the surface heat loss is less impeded than before.
Global surface temperatures are not rising with rising fossil fuel emissions.
debunked soundly
https://stevengoddard.wordpress.com/2015/03/02/basic-physics-for-clueless-climate-scientists
Guys: Look at my paper. I don’t care if it is real, the numbers as small enough to be insignificant over 100 years. If “we” (civilization) are not looking down from the “Starship Enterprise” and checking the status of the “matter/antimatter” converters (for energy)…then we haven’t advanced enough!
Max
In case anyone is wondering, I’m aware of Dr. Spencer’s critique of this work, in terms of it’s over all significance. I’m also aware of Dr. Spencer’s statement “you can’t correlate IR numbers with temperature in any direct way..” (in varience to my, admitted, simplistic Stephan Boltzmann analysis…) However, I stand by my analysis (and will point out that, yes, the atmosphere is a “gray gas”, yes, it needs a “layered approach” to try and figure out the NET “radiation” balance effect on TROPOSPHERIC temperatures, and (hat tip to Willis) we don’t REALLY have a decent way of modeling the “heat pump” work of thundestorms, which could have as much as a 10% effect on the energy balance, if the peak numbers observed per season, continuously appeared) is deliberately simplistic. I’d also suggest this experiment: Take a square meter box…put 213 one watt LED flashlights on the top..make it closed. Put themocouples in it. See where it balances in the long run (with a constant ambient temperature on the outside of the box). Add two MORE 1 watt LED flashlights. Note the difference… I’m willing to bet, it cannot be observed. It’s a NEAT physical model to help “get a grip” on the magnitudes involved here. At some point one has to be able to draw the line and say, TRIVIAL!!!