Almost 30 years after Hansen's 1988 "alarm" on global warming, a claim of confirmation on CO2 forcing

From the “this ought to shut up the “Skydragon slayers” department. Despite sophomoric claims that I’m a “denier”, I’ve never disputed that CO2 has a role in warming via retardation of IR transfer from the surface to the top of the atmosphere. What is really the issue related to AGW claims are the posited/modeled but not observed feedbacks and the logarithmic (not linear) saturation curve response of CO2. Along those lines, eyeballing the graph presented from the north slope of Alaska, it appears there might be a bit of a slowdown or “pause” in the rate of forcing from about 2007 onward. Hopefully, LBL will release the data for independent analysis.

CO2-forcing-barrow-ak

First direct observation of carbon dioxide’s increasing greenhouse effect at the Earth’s surface

Berkeley Lab researchers link rising CO2 levels from fossil fuels to an upward trend in radiative forcing at two locations

Scientists have observed an increase in carbon dioxide’s greenhouse effect at the Earth’s surface for the first time. The researchers, led by scientists from the US Department of Energy’s Lawrence Berkeley National Laboratory (Berkeley Lab), measured atmospheric carbon dioxide’s increasing capacity to absorb thermal radiation emitted from the Earth’s surface over an eleven-year period at two locations in North America. They attributed this upward trend to rising CO2 levels from fossil fuel emissions.

The influence of atmospheric CO2 on the balance between incoming energy from the Sun and outgoing heat from the Earth (also called the planet’s energy balance) is well established. But this effect has not been experimentally confirmed outside the laboratory until now. The research is reported Wednesday, Feb. 25, in the advance online publication of the journal Nature.

The results agree with theoretical predictions of the greenhouse effect due to human activity. The research also provides further confirmation that the calculations used in today’s climate models are on track when it comes to representing the impact of CO2.

The scientists measured atmospheric carbon dioxide’s contribution to radiative forcing at two sites, one in Oklahoma and one on the North Slope of Alaska, from 2000 to the end of 2010. Radiative forcing is a measure of how much the planet’s energy balance is perturbed by atmospheric changes. Positive radiative forcing occurs when the Earth absorbs more energy from solar radiation than it emits as thermal radiation back to space. It can be measured at the Earth’s surface or high in the atmosphere. In this research, the scientists focused on the surface.

The scientists used  spectroscopic instruments operated by the Department of Energy’s Atmospheric Radiation Measurement (ARM) Climate Research Facility. This research site is on the North Slope of Alaska near the town of Barrow. They also collected data from a site in Oklahoma. (Credit: Jonathan Gero)
The scientists used spectroscopic instruments operated by the Department of Energy’s Atmospheric Radiation Measurement (ARM) Climate Research Facility. This research site is on the North Slope of Alaska near the town of Barrow. They also collected data from a site in Oklahoma. (Credit: Jonathan Gero)

They found that CO2 was responsible for a significant uptick in radiative forcing at both locations, about two-tenths of a Watt per square meter per decade. They linked this trend to the 22 parts-per-million increase in atmospheric CO2 between 2000 and 2010. Much of this CO2 is from the burning of fossil fuels, according to a modeling system that tracks CO2 sources around the world.

“We see, for the first time in the field, the amplification of the greenhouse effect because there’s more CO2 in the atmosphere to absorb what the Earth emits in response to incoming solar radiation,” says Daniel Feldman, a scientist in Berkeley Lab’s Earth Sciences Division and lead author of the Nature paper.

“Numerous studies show rising atmospheric CO2 concentrations, but our study provides the critical link between those concentrations and the addition of energy to the system, or the greenhouse effect,” Feldman adds.

He conducted the research with fellow Berkeley Lab scientists Bill Collins and Margaret Torn, as well as Jonathan Gero of the University of Wisconsin-Madison, Timothy Shippert of Pacific Northwest National Laboratory, and Eli Mlawer of Atmospheric and Environmental Research.

The scientists used incredibly precise spectroscopic instruments operated by the Atmospheric Radiation Measurement (ARM) Climate Research Facility, a DOE Office of Science User Facility. These instruments, located at ARM research sites in Oklahoma and Alaska, measure thermal infrared energy that travels down through the atmosphere to the surface. They can detect the unique spectral signature of infrared energy from CO2.

Other instruments at the two locations detect the unique signatures of phenomena that can also emit infrared energy, such as clouds and water vapor. The combination of these measurements enabled the scientists to isolate the signals attributed solely to CO2.

“We measured radiation in the form of infrared energy. Then we controlled for other factors that would impact our measurements, such as a weather system moving through the area,” says Feldman.

The result is two time-series from two very different locations. Each series spans from 2000 to the end of 2010, and includes 3300 measurements from Alaska and 8300 measurements from Oklahoma obtained on a near-daily basis.

Both series showed the same trend: atmospheric CO2 emitted an increasing amount of infrared energy, to the tune of 0.2 Watts per square meter per decade. This increase is about ten percent of the trend from all sources of infrared energy such as clouds and water vapor.

Based on an analysis of data from the National Oceanic and Atmospheric Administration’s CarbonTracker system, the scientists linked this upswing in CO2 -attributed radiative forcing to fossil fuel emissions and fires.

The measurements also enabled the scientists to detect, for the first time, the influence of photosynthesis on the balance of energy at the surface. They found that CO2 -attributed radiative forcing dipped in the spring as flourishing photosynthetic activity pulled more of the greenhouse gas from the air.

###

The scientists used the National Energy Research Scientific Computing Center (NERSC), a DOE Office of Science User Facility located at Berkeley Lab, to conduct some of the research.

The research was supported by the Department of Energy’s Office of Science.

0 0 votes
Article Rating
523 Comments
Oldest
Newest Most Voted
Inline Feedbacks
View all comments
Janice Moore
February 25, 2015 11:20 am

“They attributed this upward trend to rising CO2 levels from fossil fuel emissions.”
With absolutely NO proof of causation.

Janice Moore
Reply to  Janice Moore
February 25, 2015 11:29 am

{35:41} 1. AGWers claim that human CO2 dilutes atmospheric Carbon 13; for this to be true, native sources of CO2 must NOT dilute C13;
{36:34} 2. Native Source of CO2 – 150 (96%) gigatons/yr — Human CO2 – 5 (4%) gtons/yr (i.e., native = 2 orders of magnitude greater than human);
{37:01} 3. Native Sinks Approximately* Balance Native Sources – net CO2
*Approximately = even a small imbalance can overwhelm any human CO2;
{37:34} 4. Since many native sources also involve Carbon 13, leaner than in the atmosphere, “ALL BETS ARE OFF.”
Source: Dr. Murry Salby’s April, 2013 Hamburg lecture , published on youtube:

Reply to  Janice Moore
February 25, 2015 1:38 pm

Janice,
1. There are only two sources of low 13CO2: recent organics and fossil organics. All other sources (volcanoes, oceans, carbonate rocks) are higher in 13C/12C ratio than the atmosphere.
Recent organics, that is the whole biosphere, is a net absorber of CO2, thus of preferably 12CO2, thus not the cause of the 13C/12C decline, only human emissions are…
2. Currently 9 GtC/year of human emissions and growing, thus going to 1 order of magnitude difference…
3. The measured imbalance between natural sources and sinks over the past 55 years is +/- 1 ppmv. Human emissions are 4.5 ppmv/year and the increase of CO2 in the atmosphere is over 2 ppmv/year. Thus human emissions and increase in the atmosphere both are larger than the natural imbalance…
4. That simply is not true, see point 1.

Janice Moore
Reply to  Janice Moore
February 25, 2015 1:46 pm

Ferdinand,
Your unsupported statement: “1. … the whole biosphere, is a net absorber of CO2;”
is mere conjecture.
Janice

Janice Moore
Reply to  Janice Moore
February 25, 2015 1:53 pm

Thank you for providing the opportunity to present this from Dr. Murry Salby’s Hamburg lecture (above in this comment http://wattsupwiththat.com/2015/02/25/almost-30-years-after-hansens-1988-alarm-on-global-warming-a-claim-of-confirmation-on-co2-forcing/#comment-1868870 ):
{39:40} 1. High CO2 values (per SCIAMACHY satellites) are not in industrialized nor highly populated regions, they are in Amazon basin, tropical Africa, and SE Asia.
{41:20} 2. Observed deviations of global mean (natural) CO2 deviate widely, sometimes more than 100% from year to year, decade to decade – they are INcoherent with human CO2 emission rate, i.e, net global natural emission evolves independently of human emission.
{42:35} 3. Observed global (land or ocean measurements) CO2 emission has strong sensitivity (.93 correlation [43:41]) to surface properties (mostly temperature, c = .8, and also soil moisture), i.e., increase in either increases CO2 native emissions.
{44:28} 4. C13 has strong coherence with temp. and soil moisture, but inversely, temp. up = C13 down; {45:15} the same is seen in the ice proxies.
{45:22} 5. Satellite record shows that the emissions are clearly NOT human, unless human emissions cause volcanic eruptions and El Nino.

Joseph Murphy
Reply to  Janice Moore
February 25, 2015 2:13 pm

Ferdinand, where are the other 2 ppm going? I understand that the obvious source for the 13C seems to be anthropogenic, but I am not convinced of the connection between human emissions and rising global CO2 (although, it seems like a likely culprit). What I mean is, we are discussing two separate metrics; the composition of atmospheric CO2, and the composition of the atmosphere itself. Both are changing, but your evidence speaks more to the former rather than the latter. Can you elaborate on why you think there is a connection and can confidently rule out natural sources? Thanks for your comments thus far!

ozric101
Reply to  Janice Moore
February 25, 2015 4:43 pm

How accurate is this Video? It makes perfect sense to me.

Janice Moore
Reply to  Janice Moore
February 25, 2015 6:49 pm

Hi, Oz Ric 101,
I agree! It is highly persuasive (not being a scientist, I had to watch it 3 times to really understand, but well worth it).
As to its accuracy, while I cannot personally verify that for you, I can offer you this evidence of Dr. Salby’s being highly qualified to speak to the issue and also likely being correct in his analysis:
1. There are other excellent scientists who agree with him.
2. Here is a list of Salby’s published work (pretty impressive):
http://academic.research.microsoft.com/Search?query=Murry%20L.%20Salby
Even more impressive is the number of citations to each of his published works: Click on the (Citations:54) line to see them.
3. Here is his (cringe) Wikipedia bio: http://en.wikipedia.org/wiki/Murry_Salby
4. Dr. Pehr Bjornborn of Sweden replicated Dr. Salby’s work: http://hockeyschtick.blogspot.se/2013/07/swedish-scientist-replicates-dr-murry.html
There! Hope that is helpful.
Your friendly research librarian (who does not want to do anymore for you at this time!),
Janice

Reply to  Janice Moore
February 26, 2015 2:28 am

Janice,
The whole biosphere (plants, bacteria, molds, insects, animals) is a net absorber of CO2. That can be calculated from the oxygen decline in the atmosphere: every type of fossil fuel burning uses its own amount of oxygen when burned.
Since about 1990 the methods of measuring oxygen in the atmosphere were accurate enough to measure a change of less that 1 ppmv oxygen within 210,000 ppmv in the atmosphere. That shows that there is less oxygen used than needed by burning fossil fuels. Thus the biosphere as a whole is a net producer of oxygen, that means a net absorber of CO2 and preferably 12CO2, leaving relative more 13CO2 in the atmosphere. The earth is greening…
Thus the biosphere as a whole (or anything else) is not the cause of the firm decline of the 13C/12C ratio in the atmosphere. As that is the only huge known source of low 13CO2 on earth besides fossil organics, what is left are human emissions.
If Dr. Salby had informed himself about this (not so) recent scientific knowledge, he would have known that.
See:
http://www.sciencemag.org/content/287/5462/2467.short
and
http://www.bowdoin.edu/~mbattle/papers_posters_and_talks/BenderGBC2005.pdf up to 2002
If you or Dr. Salby can point to any other important sources of low-13C besides recent and fossil organics, I may change my mind…

Reply to  Janice Moore
February 26, 2015 2:39 am

Joseph Murphy,
See the second link in the previous reply.
In general the distribution of about halve the ~9 GtC human emissions is partly in vegetation, partly in the oceans. For the period 1990-2000, a nice distribution graph was made, based on the oxygen changes in the atmosphere:
http://www.ferdinand-engelbeen.be/klimaat/klim_img/bolingraph.gif

kuhnkat
Reply to  Ferdinand Engelbeen
February 28, 2015 10:52 am

“In general the distribution of about halve the ~9 GtC human emissions is partly in vegetation, partly in the oceans. For the period 1990-2000, a nice distribution graph was made, based on the oxygen changes in the atmosphere:”
In general we do not have adequate measurements and knowledge of sources and sinks to say that your graph and comment is anything other than speculation. More hot air to try and help the CO2 myth along.

Reply to  Janice Moore
February 26, 2015 3:05 am

Janice Moore February 25, 2015 at 1:53 pm
Again Janice, Dr. Salby is right and wrong on these points:
1. The equatorial oceans are the main natural source of a continuous influx of CO2 due to the upwelling of CO2 rich deep ocean waters. But Dr. Salby doesn’t mention the equally important continuous outflux of CO2 in the polar sink places, where slightly more CO2 sinks in the deep oceans as what is upwelling near the equator. The estimates, based on 13C and 14C decline are around 40 GtC/year continuous influx and around 43 GtC/year outflux.
2. The variability in natural sink rate does vary +/- 1 ppmv from year to year (Pinatubo, El Niño), but that is the variability around the trend, which levels off within 2-3 years. The trend itself is 2 ppmv/year and human emissions are over 4 ppmv/year. Thus human emissions are twice the natural variability in net sink rate, that is the difference between the sum of all natural influxes and the sum of all natural outfluxes… The overall increase in the atmosphere is in extremely fixed in ratio with human emissions, but the short term variability is quite obviously linked to fast variations in temperature.
3. and 4. Agreed, but that is only for the variability: seasonal that is caused by the NH extra-tropical vegetation, short term (2-3 years) that is caused by tropical vegetation (temperature, drought), but decadal and longer, that is not caused by vegetation, as vegetation is a net sink for CO2 over time…
But that is NOT seen in ice proxies: the main change in CO2 between ice ages and interglacials is from the (deep) oceans, not from vegetation. That can be seen in very small changed of a few tenths per mil δ13C in the past 800,000 years. Until about 1850: a drop of 1.6 per mil δ13C in the past 165 years in ice cores, firn and direct measurements…
5. Satellite records – until now – can’t detect the faint human emissions because they lack the precision needed for emissions of 0.01 ppmv/day caused by humans. Maybe the new OCO-2 satellite can do better…

DEEBEE
Reply to  Janice Moore
February 26, 2015 5:17 am

Ferdinand and Janice, interesting as this back and forth is, it is difficult to see whether the numbers you easily throw around are of any significance. No error bars. 4 pomv this and 2 ppmv that.
Not to single you out Ferdinand, the neat little neat graph you show gives no idea of the the scatter. Which IMO would be reality. It looks like model generated. Also some of your explanations, seem plausible, (upwelling CO2) but without any numbers behind them it is merely interesting. And quickly grows tiresome.

Janice Moore
Reply to  Janice Moore
February 26, 2015 7:26 am

Dear DEEBEE,
With a little effort on your part, you could easily verify the underlying numbers and identify the error bars. Did you watch Dr. Murry Salby’s lecture? There are many sources, easily accessible online, where you can verify the parts per million of CO2 and other figures.
Would you want to be spoon-fed all the information, anyway? A genuine scholar would verify these things for him or herself.
If you are bored, perhaps you are in the wrong classroom… .
Janice

milodonharlani
Reply to  Janice Moore
February 26, 2015 7:39 am

http://carbon-budget.geologist-1011.net/
Volcanic Carbon Dioxide
Timothy Casey B.Sc. (Hons.)
Consulting Geologist
Uploaded ISO:2009-Oct-25
Revision 3 ISO:2014-Jun-07
Abstract
A brief survey of the literature concerning volcanogenic carbon dioxide emission finds that estimates of subaerial emission totals fail to account for the diversity of volcanic emissions and are unprepared for individual outliers that dominate known volcanic emissions. Deepening the apparent mystery of total volcanogenic CO2 emission, there is no magic fingerprint with which to identify industrially produced CO2 as there is insufficient data to distinguish the effects of volcanic CO2 from fossil fuel CO2 in the atmosphere. Molar ratios of O2 consumed to CO2 produced are, moreover, of little use due to the abundance of processes (eg. weathering, corrosion, etc) other than volcanic CO2 emission and fossil fuel consumption that are, to date, unquantified. Furthermore, the discovery of a surprising number of submarine volcanoes highlights the underestimation of global volcanism and provides a loose basis for an estimate that may partly explain ocean acidification and rising atmospheric carbon dioxide levels observed last century, as well as shedding much needed light on intensified polar spring melts. Based on this brief literature survey, we may conclude that volcanic CO2 emissions are much higher than previously estimated, and as volcanic CO2 contributions are effectively indistinguishable from industrial CO2 contributions, we cannot glibly assume that the increase of atmospheric CO2 is exclusively anthropogenic.

milodonharlani
Reply to  Janice Moore
February 26, 2015 7:46 am

The biosphere is responding to increased CO2, as is to be expected on a homeostatic planet.
Gosselin estimates that at present rate of emission, CO2 should stop increasing in about 30 years, thanks to the greening of Earth.
http://notrickszone.com/2013/10/05/carbon-dioxide-will-cease-to-be-a-problem-as-biosphere-absorbs-increasing-amounts-of-co2/#sthash.yiYzSGme.dpbs

Janice Moore
Reply to  Janice Moore
February 26, 2015 7:51 am

Dear Milodon,
Thank you for providing us with all that helpful information and insightful analysis.
Hope all is well in Cheelay :),
Janice

milodonharlani
Reply to  Janice Moore
February 26, 2015 7:53 am

Which implies stabilization at an equilibrium around 460 ppm, followed possibly by decline, especially if other power sources replace fossil fuels.
That level of CO2 is still far below optimum for most plants, but far better than the 280 ppm at the end of the Little Ice Age in the mid- or late 19th century.

milodonharlani
Reply to  Janice Moore
February 26, 2015 7:57 am

Janice,
You´re welcome.
Well here, thanks.
No Mag 6, 7, 8 or 9 earthquakes so far this year. Had a protracted 5+ last week here (Valpo Region) though.
Hope all’s well in your Area of Operation, too.
John

milodonharlani
Reply to  Janice Moore
February 26, 2015 8:53 am

Mike,
I too would like their water vapor observations.
So far the effect of an atmosphere richer in plant food has been beneficial to life on earth.
A new equilibrium state will be reached, IMO, before mid-century. If we weren’t burning fossil fuels, it would be good for the planet to do so, as long as real pollution is controlled, as unfortunately it has not been in the dark, satanic mills of rapidly industrializing, Dickensian China.

Tom Prendergast
Reply to  Janice Moore
February 26, 2015 4:22 pm

Doing a back of the envelope calculation 0.2C per decade means that it would takes 185 years to get to the IPCC figure of 3.7 W/m2 for a doubling of CO2 concentration. Is that about the time period that the Industrial Age started up to now?

Reply to  Janice Moore
February 27, 2015 10:47 am

DeeBee,
Sorry for the late reply, the Greenpeace attack on Willie Soon was here in the press too, I had a good time with providing some backfire…
Atmospheric CO2 measurements are accurate to +/- 0.2 ppmv. Oxygen measurements are better than +/- 1 ppmv and human emissions are estimates (based on fuel production and sales) accurate to -1/+2 ppmv.
Errors in one year for CO2 and O2 measurements are compensated in the next year(s) as the changes are additive. That is not so for the human emissions, but these are probably more underestimated than overestimated (by under the counter sales…).
All together, the error bars are quite small compared to the year by year and overall increases/decreases.

Reply to  Janice Moore
February 27, 2015 11:45 am

milodonharlani February 26, 2015 at 7:39 am
I had read your source some time ago. For a geologist he makes a lot of assumptions which don’t fit reality…
– Take the amount of CO2 released by volcanoes: except for the Toba all huge eruptions are a factor 100-500 smaller that human emissions over one year (MtC vs. GtC). Even the Pinatubo didn’t show up in the Mauna Loa measurements, only negative: more uptake than usual…
– There is nothing magic to distinguish volcanic from human CO2 emissions: the 13C/12C ratio of subduction volcanoes is near zero per mil, as that comes mainly from carbonates, while deep magma volcanoes emit CO2 at around -6 per mil, about what the atmosphere is, but the average of human emissions is around -25 per mil.
– As far as I know, most elements that can be oxidized on earth are oxidized. But even if that wasn’t the case, the oxygen decline in the atmosphere is less than calculated from the use of fossil fuels. Thus there is a source of oxygen at work. I do know only one main source of oxygen: photosynthesis. That clearly does overwhelm any use of oxygen by any other process besides fossil fuel burning.
– Underwater volcanoes may be underestimated, but most of their CO2 doesn’t reach the surface as at the pressure and temperature of the deep oceans the waters are undersaturated for CO2. Further, there is no measurable increase in upwelling or throughput of oceanic CO2…
– Oceanic acidification by stronger acids from underwater volcanoes do lower the pH, but that is accompanied by a decrease in total carbon (DIC) in the oceans. What is observed is an increase in DIC for a lower pH, thus the net flux of CO2 is from the atmosphere into the oceans, not reverse.
Thus a lot of assumptions, not based on what is observed in the real world…

george e. smith
Reply to  Janice Moore
February 27, 2015 3:49 pm

Ferdinand,
Why do you quote molecular abundances in ppmv rather than just ppm. Who cares what the volume is; its the number of each molecular species molecules that matters; not the volume.

Reply to  Janice Moore
February 28, 2015 12:53 am

George,
In general ppm is used and implied for gases as molecular ratio which for ideal gases is “by volume” in dry air. Water vapor being a big exception in that game. But some use ppm as “by weight”, especially in liquids. This is just to avoid confusion… See:
http://en.wikipedia.org/wiki/Parts-per_notation#Mass_fraction_vs._mole_fraction_vs._volume_fraction

Reply to  Janice Moore
February 28, 2015 3:05 pm

Salby is your credible source?
‘A National Science Foundation investigation report issued on 20 February 2009 found that Salby had overcharged his grants and violated financial conflict of interest policies, displaying “a pattern of deception, a lack of integrity, and a persistent and intentional disregard of NSF and University rules and policies” and a “consistent willingness to violate rules and regulations, whether federal or local, for his personal benefit.” It debarred Salby from receiving federal assistance and benefits until 13 August 2012.
After leaving Colorado, Salby joined the faculty of Macquarie University in Australia, where he was appointed Professor of Climate Risk in 2008. Salby’s employment at Macquarie was terminated in 2013; his return ticket from Paris was cancelled by Macquarie, stranding Salby in Europe. Macquarie University stated that he was not dismissed because of his views on climate change, but for refusing to fulfill his teaching responsibilities and for inappropriate use of university resources including a corporate credit card.’

kuhnkat
Reply to  warrenlb
March 4, 2015 8:39 am

“Salby is your credible source?
‘A National Science Foundation investigation report issued on 20 February 2009 found that Salby had overcharged his grants and violated financial conflict of interest policies, displaying “a pattern of deception, a lack of integrity, and a persistent and intentional disregard of NSF and University rules and policies” and a “consistent willingness to violate rules and regulations, whether federal or local, for his personal benefit.” It debarred Salby from receiving federal assistance and benefits until 13 August 2012.
After leaving Colorado, Salby joined the faculty of Macquarie University in Australia, where he was appointed Professor of Climate Risk in 2008. Salby’s employment at Macquarie was terminated in 2013; his return ticket from Paris was cancelled by Macquarie, stranding Salby in Europe. Macquarie University stated that he was not dismissed because of his views on climate change, but for refusing to fulfill his teaching responsibilities and for inappropriate use of university resources including a corporate credit card.’”
Assuming that these were not just Political hatchet jobs, and the Macquarie University trash appears to be just that, you are still stuck on stupid with a fallacy.
Dr. Mengele was a horrendously evil man as far as what he perpetrated. You would have us ignore all of his work that so many paid so much suffering and their lives to obtain.
Actually, you are probably fine with the knowledge that Mengele gained for us. It is only Salby, because he doesn’t fit your agenda, that you have a problem with…

Reply to  Janice Moore
February 28, 2015 4:35 pm

@warrenlb
Either your comment above is due to ignorance, or you are trolling. I suspect the latter, based on your previous comments.
If you do a simple archive search here [keyword: Salby], you will see that the charges against Prof. Salby were/are highly questionable. It is the other side of the coin from M. Mann, who was given a completely free pass in every ‘investigation’ that supposedly ‘exonerated’ him.
So you are either naive and credulous, or you are being your usual pestilent self.
Again, I suspect the latter.

Bart
Reply to  Janice Moore
March 1, 2015 1:43 pm

Great stuff, Janice. Everyone in London in mid-March, mark your calendars.

Prof. Murry Salby presents
Control of Atmospheric CO2
His new research applies observed changes of climate and atmospheric tracers to resolve the budget of atmospheric carbon dioxide. It reveals the mechanisms behind the evolution of CO2, including its increase during the 20th century. Thereby, the analysis determines the respective roles of human and natural sources of CO2, with an upper bound on the contribution from fossil fuel emission.
Tuesday 17th March, 7.00 for 7.30pm
Emmanuel Centre, Marsham Street SW1P 3DW
Westminster tube, then a ten minute walk past Parliament, turn right up Great Peter St. then 4th left into Marsham St. The EC entrance is ~30 yards on the left. Or bus number 507 from Victoria to the corner of Horseferry Road and Marsham Street.
Free admission (donations welcome) but please book:
philip.foster17@ntlworld.com 01480 399098

bones
Reply to  Janice Moore
February 25, 2015 1:29 pm

Do you suppose that it bothers them that they are measuring a rate of increase that is less than the IPCCs 3.7 w/m^2 for a doubling period that is 14 decades with CO2 emissions going up 5% per decade?

Reply to  bones
February 26, 2015 8:44 am

“The biosphere is responding to increased CO2, as is to be expected on a homeostatic planet”
This also what I see too in the graph as the lows in CO2 and forcing over the last 7 years of the study have flat lined. CO2 is being used up by plants. This is what I see in observations of the real world. Photosynthesis is created a strong negative feed back.
Vegetative health/growth is booming. This is also effecting transpiration and the water cycles, adding some water vapor but also increasing low clouds(that have a cooling effect) and producing more rain in the growing seasons.
I would have liked very much to see their measurements of H2O, as this is supposed to more than double the greenhouse effect from CO2. Since they were able to separate out CO2, I wonder why H2O is not part of this?
This is a confirmation of my understanding of the effect of greenhouse gas warming from CO2 and the response from the atmosphere and biosphere.

milodonharlani
Reply to  bones
February 26, 2015 8:59 am

Mike,
Oops. Please see reply above.
I might add that the US won’t sell China the low-sulfur, high BTU density coal that would help clean up its air, yet we buy windmills & solar panels from them. Even had America the needed rare earths, our environmental regulations would not permit solar cells to be made here.
Windmill & solar farms are environmental disasters, massacring millions of birds & bats, increasing our reliance on insecticides. Besides which “Green” energy requires fossil fuel backup. Craziness on a massive scale.

Janice Moore
Reply to  bones
February 26, 2015 9:58 am

Re: Mike Maguire (8:44am):
… the greenhouse effect from CO2. … This is a confirmation of my understanding of the effect of greenhouse gas warming from CO2 … .
You are strangely determined to keep on asserting (wherever a WUWT thread presents even the slightest opening) the “greenhouse effect from CO2” conjecture as if it were fact despite the fact that, so far, there is no evidence, that CO2 drives climate change (not by a “greenhouse effect” nor by any other speculated means). None. Correlation is not causation.
Even the AGWers admit this by their panicked scrambling for explanations for where the “missing heat” went.
CO2 up –> WARMING STOPPED.
AGW Game Over.

Donb
Reply to  Janice Moore
February 25, 2015 5:52 pm

F.E.’s statement that only biogenic sources, including fossil fuels, have lower delta 13C than the atmosphere is mainly true. These biogenic sources include soils, land plants, marine organic C, etc. The highest delta 13C are limestones and the ocean. (Volcanic CO2 resembles the atmosphere.)
However, whereas fossil fuels contribute about 7 gigatons per year, the carbon exchange rate between soils plus vegetation and between the ocean and the atmosphere are an order of magnitude higher. Thus fossil fuels are a minor player in the long-term delta 13C of the atmosphere, and the competition among these other sources are dominant.

Samuel C Cogar
Reply to  Donb
February 26, 2015 2:29 am

@ Donb

“Differences in altitude are also known to affect terrestrial plant carbon isotopic signatures (δ13C) in mountain regions, since plant δ13C values at high altitudes are typically enriched (Körner et al. 1988; 1991) compared to the carbon signatures of plants from low altitudes. Soil organic matter also show enrichment in 13C with soil depth, which is suggested to be a consequence of humification and the loss of the lighter isotope (12C) via respiration, thus concentrating 13C in the soil organic matter (Kramer et al. 2003). This might be transitional to temperature and differences in decomposition. Moreover, the isotopic carbon signatures of autochthonous and allochthonous food-sources in aquatic ecosystems are generally separated, which is also reflected in the consumer community. Stable isotope analysis is therefore a useful method for determining the autotrophic or heterotrophic character of lake food webs (Karlsson et al. 2003; 2007).”
http://www.diva-portal.org/smash/get/diva2:303212/FULLTEXT01.pdf

Reply to  Donb
February 26, 2015 3:36 am

Donb,
Mostly true what you say. But the exchanges between vegetation and the atmosphere and the ocean and the atmosphere are quite rapid: the 13C/12C decline caused by human emissions is rapidly distributed within the biosphere and the ocean surface. The ratio that goes out in one season mostly comes back in next season.
The deep oceans are where the difference is: what goes into the deep oceans is the isotopic composition of the atmosphere of today (minus the fractionation at the air-water border), what comes out of the oceans is the isotopic composition of ~1000 years ago (minus the fractionation at the water-air border). One can estimate the CO2 exchange between the deep oceans and the atmosphere. based on these differences:
http://www.ferdinand-engelbeen.be/klimaat/klim_img/deep_ocean_air_zero.jpg
The discrepancy in the earlier years is probably from vegetation, which was a small source of low-13C until about 1990 and a small, increasing sink thereafter.
The ~40 GtC/year deep ocean exchange was confirmed by the decay rate of the 14C atomic bomb tests spike since 1960: the rapid decline also was in part caused by the difference in output and input concentrations for 14C via the deep oceans…

Anto
Reply to  Janice Moore
February 25, 2015 6:45 pm

“They found that CO2 was responsible for a significant uptick in radiative forcing at both locations”
A fly on the wall, when the authors were discussing their findings: “Hmm…seem to remember something I read sometime about correlation and causation…nope, it’s gone.”

Crispin in Waterloo
Reply to  Anto
February 26, 2015 7:31 am

Anto
Exactly. If the water vapour varied in concert it would be far more likely to be water vapour as the CO2 band is usually saturated at ground level anyway.
Another thing, if the DWIR increase is real, why hasn’t it made a dent in the temperature at these two locations, of equal magnitude, or of any magnitude? I find the readings interesting, for sure. I am sure they measured something very precisely. I am not convinced they have attributed it with equal precision. It looks a leap of faith from measurement to attribution.
Let’s suppose the ‘back radiation’ values are completely accurate and caused by CO2 – that is a possibility. OK, now what? It proves CO2 is a GHG. Is this news? Were they investigating whether it is or not? They cannot attribute the increase of 2/10th of a watt/m^2 unless they have simultaneously factored the result for water vapour increase which is supposed to accompany the CO2 increase – isn’t that how it goes? Where is the total H2O vapour column concentration? Show it then subtract that first.
What I would then look for is whether the expected 1/logarithmic effect for an increase at 400 ppm is being tracked. If it doesn’t match, and has something closer to a linear response to CO2 concentration, then they are blowing smoke.

Reply to  Janice Moore
February 25, 2015 11:03 pm

From 2000 until the end of 2010. That’s the pause isn’t?

D.J. Hawkins
Reply to  Santa Baby
February 26, 2015 2:53 pm

Yes, begging the question of why, with the putative increase in forcing, we didn’t see the expected increase in global temperatures.

milodonharlani
Reply to  Santa Baby
February 26, 2015 3:06 pm

Please excuse the pedantry, but you mean “raising the question”. “Begging the question” is the name of a logical fallacy, basically assuming what you intend to demonstrate, which is of course what the GIGO climate models do.

johnmarshall
Reply to  Janice Moore
February 26, 2015 2:47 am

Also I cannot understand how CO2 reduces radiation to space when it is a very good emitter of IR.
Most CO2 is volcanogenic not anthropomorphic.

Reply to  johnmarshall
February 26, 2015 4:51 am

Most CO2 is anthropogenic, not volcanogenic as you put it. We emit 130 times more GHG’s than all the world’s volcanoes combined.

Brad
Reply to  johnmarshall
February 26, 2015 6:59 am

And termites produce 10 times the amount of CO2 as humans.
http://preventdisease.com/news/10/071110_terminte_co2.shtml

Janice Moore
Reply to  johnmarshall
February 26, 2015 7:18 am

Douglas Hollis: Most CO2 is natural and not anthropogenic. You mix in a little truth (that volcano CO2 emissions are less than human CO2 emissions) with a big l1e.
{36:34} — Native Sources of CO2 – 150 (96%) gigatons/yr — Human CO2 – 5 (4%) gtons/yr (i.e., native = 2 orders of magnitude greater than human).
{Source: Dr. Murry Salby, in video posted in this comment: http://wattsupwiththat.com/2015/02/25/almost-30-years-after-hansens-1988-alarm-on-global-warming-a-claim-of-confirmation-on-co2-forcing/#comment-1868870 }

milodonharlani
Reply to  johnmarshall
February 26, 2015 7:26 am

Doug,
Actually no one knows how much naturally occurring CO2 comes from volcanism, since most of it is submarine.

George E. Smith
Reply to  johnmarshall
February 26, 2015 8:28 am

John,
You say “CO2 is a very good emitter of IR”
That may be true. But that doesn’t mean CO2 is a primary source of IR.
So about the only EM radiation CO2 can emit, is the same LWIR that it is absorbing from surface emitted LWIR which is energy in the 5.0 to 80 micron wavelength range. CO2 grabs some of the 13.5 to 16.5 micron band.
That is IR energy that would have escaped to space, if not for the atmosphere.
So the CO2 absorbs some of it, and shortly thereafter, re-radiates essentially the same wavelength.
BUT …. The reradiated IR is isotropic in distribution; it goes in every direction, and only half of that is towards space.
So some of it comes back to the surface. And all the time of course, the CO2 can recapture it and continue the delaying process.
Now since the CO2 is part of a gas mixture at a Temperature above zero K, it can also radiate (at low intensity) a thermal spectrum of radiation that depends on the gas Temperature. That (BB like) radiation is due to the collisions between molecules that distorts the molecule exposing a non zero dipole electrical moment (and other higher multipole antennas as well).
Since the molecular density is low in gases, so they are not opaque in available quantities, the emissivity is very low, but it isn’t zero.
So it is the delaying effect of the GHGs which results in the warming (caused by more solar energy getting in during that delay.
If you partially plug up the drain in your bathtub, to slow down the emptying, but the faucet is still on adding water to the bathtub, then the water level will rise over the level it had before you plugged up the drain partially.
G

Bert Walker
Reply to  johnmarshall
February 26, 2015 11:11 am

Termites produce 50 GT CO2 / yr according to:
“Termites: A Potentially Large Source of Atmospheric Methane, Carbon Dioxide, and Molecular Hydrogen”
Science 5 November 1982:
Vol. 218 no. 4572 pp. 563-565
DOI: 10.1126/science.218.4572.563

Samuel C Cogar
Reply to  johnmarshall
February 27, 2015 7:47 am

@ George E. Smith February 26, 2015 at 8:28 am

BUT …. The reradiated IR is isotropic in distribution; it goes in every direction, and only half of that is towards space.
So some of it comes back to the surface. And all the time of course, the CO2 can recapture it and continue the delaying process.

BUT, BUT, ….. George E, ….. does not the Law of Diminishing Returns …. apply to the above scenario?
Does not the downward (toward the surface) reradiated IR energy decrease by 50% each and every time it is absorbed and reradiated by another CO2 molecule?
Me thinks it does, me thinks it does.
And whenever there is a minimum or very little (<1%) H2O vapor in the near surface atmosphere (desert areas) then things cool down pretty damn quick when solar irradiance terminates at the end of each day.
Thus, in actuality, 400 to 1,000 ppm of CO2 will have absolutely no measurable effect on near-surface air temperatures.

george e. smith
Reply to  johnmarshall
February 27, 2015 1:55 pm

“””””…..
Samuel C Cogar
February 27, 2015 at 7:47 am
@ George E. Smith February 26, 2015 at 8:28 am

BUT …. The reradiated IR is isotropic in distribution; it goes in every direction, and only half of that is towards space.
So some of it comes back to the surface. And all the time of course, the CO2 can recapture it and continue the delaying process.
BUT, BUT, ….. George E, ….. does not the Law of Diminishing Returns …. apply to the above scenario?
Does not the downward (toward the surface) reradiated IR energy decrease by 50% each and every time it is absorbed and reradiated by another CO2 molecule? …..”””””
Well just think this through Sam.
At some height H you have a CO2 molecule absorb a 15 micron photon (which could have come from ANY direction).
Later it re-emits essentially the same photon, again in any direction. About half of those incoming photons came up, and about half came down.
Likewise the re-emitted photons go about half up and half down. It looks like a static symmetry; BUT … !!
Up and down are not quite the same.
Down is denser, and warmer. Up is cooler and less dense.
Warmth and density lead to line broadening; Doppler shift broadening in the case of higher Temperature, and collision broadening in the case of higher density.
So photons headed downwards, see a GHG laden atmosphere with broader absorption lines, so the probability of a photon being absorbed is increased.
Photons headed up, see an atmosphere with narrower absorption lines, so are LESS likely to be absorbed.
So the atmospheric gradients tend to favor the upward escape direction over the downward re-capture direction.
When you take the gradient refractive index of air into account, slightly more than half of a geometric hemisphere of GHG emitted photons head downwards, and slightly less head upwards. BUT
The upward ones are more likely to escape than the downward ones.
Eventually they escape; but all the delaying tactics just allow more solar energy to come in during that delay time.
Sans any absorption in the atmosphere a photon can escape to 300 km height in one millisecond.
The incoming ones from the sun make the atmospheric journey in about a millisecond, but the outgoing takes longer. And no I have never tried to compute how much longer, but I’m sure the X-box chaps can do that. so the delay allows the Temperature to rise slightly compared to what it would be with no delay of the outgoing LWIR.
G

Samuel C Cogar
Reply to  johnmarshall
February 28, 2015 10:20 am

@ george e. smith February 27, 2015 at 1:55 pm
First of all, George E, your 2nd sentence in this statement makes no logical sense, to wit:

Later it re-emits essentially the same photon, again in any direction. About half of those incoming photons came up, and about half came down.

Therefore we have to discredit it without any further ado.
And likewise, your next statement, it is also discredited, to wit:

Likewise the re-emitted photons go about half up and half down. It looks like a static symmetry; BUT … !!

But ells bells, half of those re-emitted photons could be leaving at a 45 degree angle to the zenith …… and half could be leaving at a 33 degree angle to the zenith ………. and half leaving at a 78 degree angle to the zenith. And five (5) halves and twenty (20) quarters does not equal one (1) orb.
And remember, George E, the higher the altitude is when that CO2 molecule emits that photon ….. the less likely it is that that proton will be re-emitted at an angle to make contact with the earth’s surface ….. and the less likely it is to make contact with another CO2 molecule. As the mass density of the GHG gasses decreases with increases in altitude, … so does the decreasing of the photon’s chances of colliding with one of their molecules.
Now the remainder of your verbiage, IMLO, reads awful purdy like, but does nothing to explain the actual, factual near-surface temperature measurements, ….. especially the extremely quick decreases in near-surface temperatures of desert environments of extremely low humidity (H2O vapor).
Climate scientists or whoever …. should set-up some actual “controlled” experiments on some locale of the earth’s surface ……. to test their conjecture ….. before making claims of factual science.
There is an ole design engineering “saying” that goes, to wit:
If it don’t work on paper ….. then you don’t have a chance in hell of it working when you put it to practice.
Well now, there is an awful lot of climate science claims out there “on paper”, ….. but very few to none of their authors want to put their “claims” to practice.
Does it make you wonder why they don’t. HA, their reason is quite obvious to me.

Reply to  Janice Moore
March 1, 2015 7:25 am

.
And your source for saying that the widely reported charges against Salby were ‘highly questionable” is…..?

Reply to  warrenlb
March 1, 2015 2:20 pm

I have explained that to you, but you ignored it — and then you asked the very same thing again.
Quit trolling, warrenlb, and do the archive search on this site, keyword: Salby.
You will see all kinds of things to set you straight. I suspect that’s why you pretend you don’t understand. You did the search already, and found out way more than you wanted to. The fact is that Prof Salby is the victim of yet another witch hunt by the ethics-free climate alarmist crowd.
When you’ve read the results of your search, report back. Tell us what you found. I will be happy to discuss it here.

February 25, 2015 11:25 am

0.2 W/m^2? What’s the uncertainty on that value? Per decade? Compared to all the other heat sources? Seems almost below the threshold of detection to me. Is it another statistical construct? Was all the raw data +/- 1.0 W/m^2 with the statistical average carried out to 0.x?

hugh
Reply to  nickreality65
February 25, 2015 11:43 am

I always have to wonder when they leave out details of technical accuracy and precision of their equipment and assumption.

george e. smith
Reply to  hugh
February 25, 2015 1:48 pm

Well we already have incontrovertible evidence from their new fancy Carbon Satellite that disproves the claim that CO2 is well mixed in the atmosphere.
So these two sites that they sampled are just cherry picking.
So you drill a rock core in Oklahoma (might as well; they got orl down there,) And you drill another hole in the North Slope of Alaska; wow there’s orl there too.
And from those two rock cores you describe the complete Geology of the North American continent.
Wow Nyquist must have been wrong. No wonder the telephone system doesn’t work any more.
Two samples from the whole earth, and eleven years does not make a climate cycle.
But I guess I will wait and see what sort of legs this brand new Nobel Prize worthy research has.
So they can isolate IR from CO2 out in the wild, whereas before they could only do it in the lab. I assume they mean the science guy’s 100 watt light bulb experiment.
But ok. Now that we know for sure that CO2 is the culprit, then we don’t need to waste any more taxpayer’s money on research that is already settled science, and bigorl doesn’t need to waste any more money funding Willie Soon to prove it ain’t so, now that it has been proven to be true.
That is going to make a whole lot of new unemployed and otherwise unemployable climate scientists available to do all those odd jobs that Americans simply won’t do.
Well they will, when they finally have to figure out how to put food on their table.
A new day, and a new startling revelation.
I thought this was already concensucised settled science ??

george e. smith
Reply to  hugh
February 25, 2015 1:54 pm

I think I see their problem.
I just looked at their Mauna Loa like graph, and I noticed that there isn’t any Temperature information in there anywhere.
So this is like using you camera light meter to demonstrate that clouds block sunlight.
Well we already knew that.
So what is it that Le Chatalier’s principle says happened as well as their forcing increase, to result in no statistically perceptible Temperature result from that CO2 ??

Reply to  hugh
February 26, 2015 4:29 am

george e. smith
The satellites don’t disprove the “well mixed” CO2, they show the opposite:
The seasonal exchanges between the atmosphere and the other reservoirs are 20% of all CO2 in the atmosphere. The satellite shows +/- 2% differences of full scale. I call that well mixed.
Well mixed doesn’t imply that CO2 at all moments is the same everywhere on earth, that only implies that any source or sink rapidly is mixed in with the rest of the atmosphere…

Samuel C Cogar
Reply to  hugh
February 27, 2015 8:22 am

The satellites don’t disprove the “well mixed” CO2, they show the opposite:

Humans can not see the CO2 molecules in the atmosphere ….. and neither can a satellite …. so cease with all the silly conjecture that it can.

george e. smith
Reply to  hugh
February 27, 2015 2:02 pm

Well I believe that Nitrogen and Oxygen and Argon too are well mixed in the atmosphere, even though oxygen comes and goes as a result of biological processes that vary all over the place.
So 2% variation is not my idea of well mixed.
Can these satellites discern local variations in the Nitrogen / Oxygen ratio in the atmosphere ?? And is it anything like 2%.
The CO2 satellite photo map that I saw, showed concentrations of CO2 where there were no unusual sources of CO2.

george e. smith
Reply to  hugh
February 27, 2015 2:10 pm

The Mauna Loa CO2 data shows about a 6ppm P-P CO2 abundance annual cycle with about 7 months to rise that much and five months to fall back. Well there’s about a 1-1.5 ppm remainder.
BUT ! at the North Pole, that CO2 p-p cycle in a place where there are no CO2 sources like trees, the amplitude of the CO2 cycle is about 18-20 ppm ; three times the ML amunt.
And at the South pole where likewise no CO2 sources exist, the amplitude of the CO2 cycle is about -1 ppm , meaning it is out of phase with the north pole and ML.
So there is a 19 – 21 ppm difference between the north and south poles.
No that is NOT well mixed.

Reply to  nickreality65
February 25, 2015 2:46 pm

They give the values as 0.2 +/- 0.06 W/sm for SGP, and 0.2 +/-0.07 W/sm for NSA data set. The seasonal range for SGP was 0.1 – 0.2 W/sm, and for NSA the seasonal range was 0.1 W/sm.

Reply to  nickreality65
February 26, 2015 12:54 am

“The time series of this forcing at the two locations—the
Southern Great Plains and the North Slope ofAlaska—are derived from
Atmospheric Emitted Radiance Interferometer spectra3 together with
ancillarymeasurements and thoroughly corroborated radiative transfer
calculations4
. The time series both show statistically significant trends
of 0.2Wm per decade (with respective uncertainties of +-.06W m^2
per decade and +- .07W m^2 per decade)

DEEBEE
Reply to  Steven Mosher
February 26, 2015 5:22 am

You mean model significant, not instrumental significant.

Reply to  Steven Mosher
February 28, 2015 8:11 am

Hi Dan,
Thanks for the explanation. I gather that you are looking at the P and R branch differentials to the saturated nu-2, essentially using the pressure broadening effect to gauge the CO2 contribution. An interesting approach. As you know, this can be tricky if the inputs from other gasses in the mix to the “pressure” are not carefully controlled.
I eagerly await your paper which will undoubtedly answer many other questions such as the altitude profile and the measured H2O content and forcing.
Thanks again,
Gordon

KuhnKat
Reply to  Steven Mosher
February 28, 2015 10:37 am

Since the time period was cherry picked the results are not robust.
But go ahead and blow some more hot air. It won’t warm the earth any faster than CO2 is…

February 25, 2015 11:26 am

Why are they using a computer modeling system to track CO2 sources? When we have that brand new satellite that shows exactly where the CO2 really is coming from. Oh yeah it’s not coming mostly from us. The Amazon doesn’t fit in their model’s.

Reply to  Bobby Davis
February 25, 2015 12:24 pm

The Amazon source IS human–they are building a dam that will or is flooding large areas of land. That kills the organisms that were there, including an endangered turtle and human beings from indigenous cultures. Rot bacteria produce methane, CH4. This is more of a greenhouse gas than CO2–but it isn’t stable in an atmosphere around 20% oxygen. It becomes H2O and CO2.
The killing of life. THAT is what is producing the main increase in CO2. The alarmists picked up the signal–the Keeling curve. But they have totally misinterpreted it.
This Alaska research is a little silly. All it really says is that atmospheric CO2 is rising. We already knew that.
In Europe, the “heavily industrialized area” of the recent NASA graph is not Germany, France or England; it is Turkey. Huh? Turkey has just built a horrifying dam that is killing life to produce the death-signal you see on the NASA graph. It is also inundating ancient archaeological sites of immense importance, and it is also going to harm the farmers of the vast fertile crescent enormously. That dam is a monstrous crime and the warmists miss it. So do the skeptics.
Most of the warmists are gullible do-gooders who want to save the biosphere. It will be rather easy to knock them off the warming alarmism if they understand the real meaning of the global death signal.

Keith Willshaw
Reply to  ladylifegrows
February 25, 2015 1:37 pm

Dams that are still being built cannot by definition have flooded or killed anything and people never sit still waiting to be drowned.
The Deriner Dam in Turkey was only completed in 2012 so it can hardly be responsible for a massive ‘death signal’. IN any case one of the major aims of the dam is to provide a controlled source of water to allow MORE stuff to grow. It is also NOT in Europe but is in fact in Asia.
The fertile crescent lies between the Tigris and Euphrates and the Nile valley. Both of these areas have had managed water systems since the bronze age and are downstream of the the Deriner Dam watershed so rather unlikely to be flooded.
The areas claimed to be responsible for the generation of CO2 that causes global warming are Europe and North America not Eastern Anatolia
Now Europe has massive dams all across southern Germany, Italy and Austria – where is the ‘death signal’ ?
The USA has massive dams across the Columbia and Colorado – where is the ‘death signal’ ?
Hint – its in your head.

Alx
Reply to  ladylifegrows
February 25, 2015 3:35 pm

Interesting the global death signal, look for the CO2 signatures, cross reference with dams, and you will find massive kill zones.
Are you a novelist?

Latitude
Reply to  ladylifegrows
February 25, 2015 4:10 pm

amazing……dams can cause CO2 levels to rise before they are built

Reply to  ladylifegrows
February 25, 2015 9:15 pm

Lady,
The only life forms that are net CO2 consumers are the chlorophyll primary producers. Everything else, including our freeloading selves, produce CO2. Even the primary producers produce some CO2 by their own respiration. They don’t produce all that ATP just for us.

DEEBEE
Reply to  ladylifegrows
February 26, 2015 5:24 am

That is only a plausible explanation. Just like I can explain the last few dips in the stock market. Where is the scientific data , with measurement. Otherwise all your did is tell plausible myths.

Samuel C Cogar
Reply to  ladylifegrows
February 28, 2015 11:19 am

Little dams, big dams and gigantic dams, …. including lakes of all sizes, ….. are notorious for producing horrendous amounts of atmospheric H2O vapor atop the water surface as well as “downwind” from the water impoundment areas.
Anyone want to discredit lake effect snowfall …. or early morning lake fogs … then stand up and be counted.
And of course, atmospheric H2O vapor not only has a much greater “IR signature” than does the atmospheric CO2, …… but also the same “IR signature” as the atmospheric CO2 except for the 3.5-.8 uM wavelength which is only a small portion of its total IR absorption band.
So phooey on your satellite images of IR radiation emissions from atmospheric CO2 sources.

Gregory
February 25, 2015 11:27 am

Isn’t this the same curve affected by deciduous trees? http://c3headlines.typepad.com/.a/6a010536b58035970c01b7c6de0d93970b-pi

Ian Schumacher
February 25, 2015 11:28 am

Excuse my ignorance, but would CO2 forcing correlate well with CERES radiation measurements? And does it?

Reply to  Ian Schumacher
February 25, 2015 1:28 pm

In fact, it doesn’t correlate at all. Globally, Earth’s surface has strongly strengthened its ability to cool radiatively from 2000 to 2014 (by about 1.5 W/m2 or ~1 W/m2 per decade) according to CERES:comment image
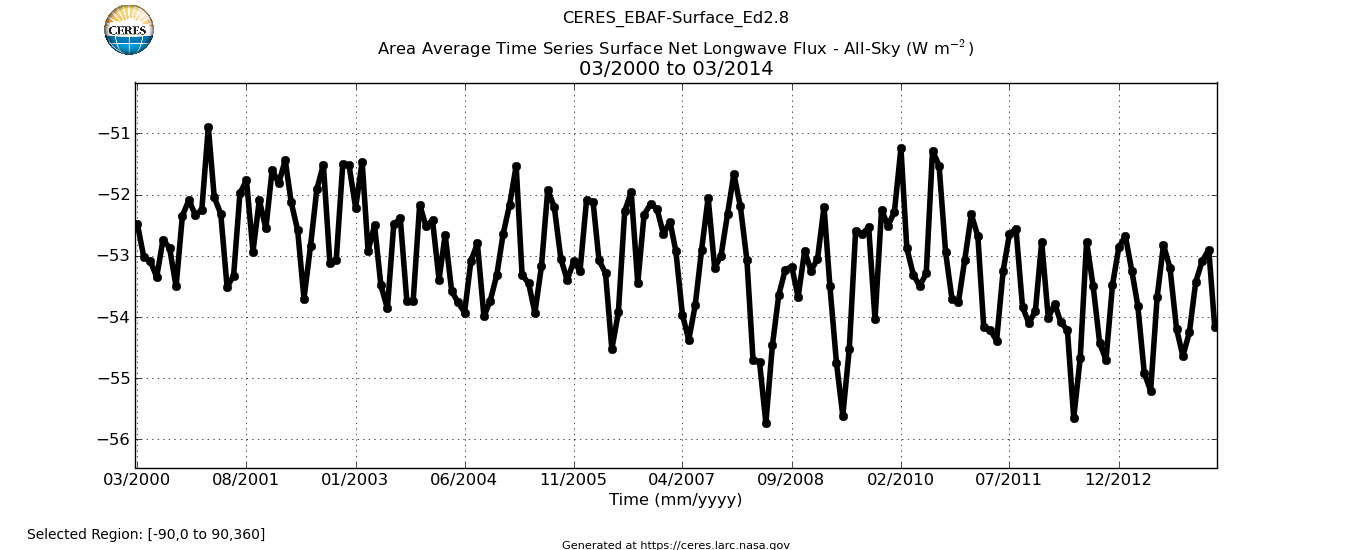
(Note, absolute values, negative means LARGER surface heat loss.)
Not much trace there of any increasing atmospheric retardation of outgoing surface radiative heat, is there? Rather the opposite …
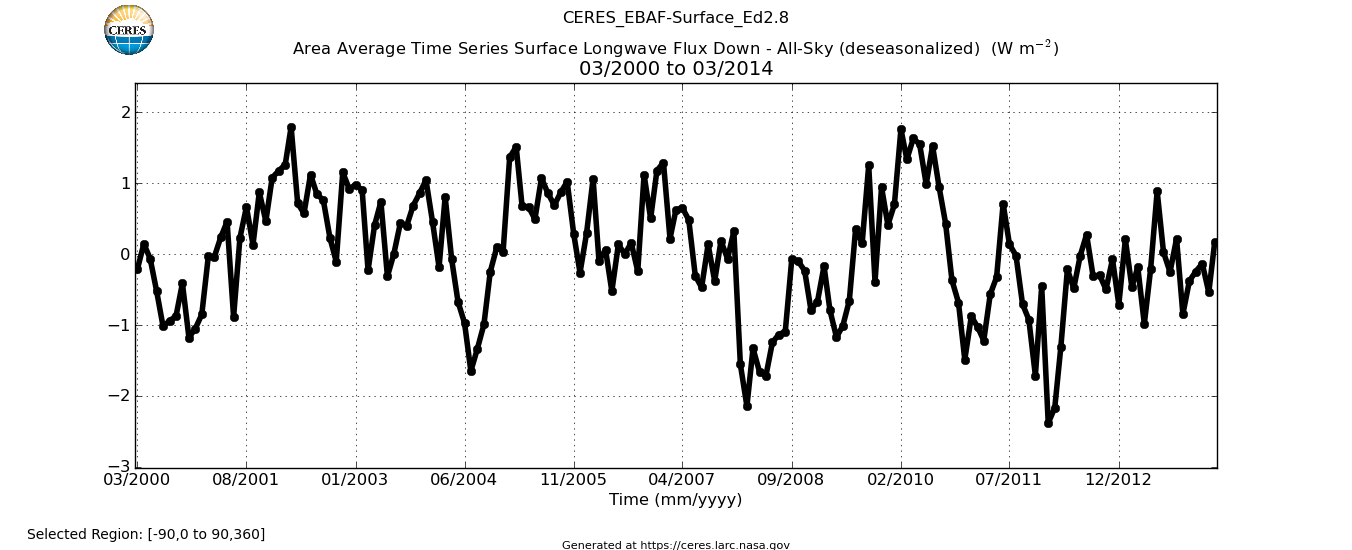
And if you think this is only because the surface has warmed somewhat and so radiates more, think again. Here’s global DWLWIR (“atmospheric back radiation”) over that same period:comment image
(Note, anomalies, negative values mean LESS in.)
Down by ~1 W/m2.
And this is in spite of significantly increasing atmospheric content of both CO2 and H2O (WV & clouds) + allegedly rising temps since 2000.
Go figure …

Reply to  Kristian
February 25, 2015 1:50 pm

Curiously, every time a cloud is formed heat from the surface is released into the atmosphere and is free to radiate into space. i.e. more clouds = more cooling

Ian Schumacher
Reply to  Kristian
February 25, 2015 2:17 pm

This is what I thought. Which seems to contradict this articles evidence, right?
Why should I believe this new data over the CERES data (which shows no positive correlation), especially since Willis showed recently how strongly CERES correlates with other surface data? Or is this apples and oranges and not talking about the same thing? Seems like it is, but I don’t follow this stuff that closely and maybe they are not really talking about the same phenomenon (i.e. measuring the greenhouse effect).

Reply to  Kristian
February 25, 2015 2:44 pm

“Which seems to contradict this articles evidence, right?”
Oh, I’m sure they’ll find a way around it. Like they do with all inconvenient data. Simply ignoring it works well most of the time …

Reply to  Kristian
February 25, 2015 2:57 pm

Ian,
No, they seem to be talking about something else, i.e. the radiative balance at the ToA (which, btw, hasn’t moved since 2000), which they strangely claim can also be measured somehow at the surface.
But what they actually measure is the so-called “sky radiance”, which is basically the same thing as what is plotted in the lowermost CERES diagram above, which is total DWLWIR. They are simply targeting the CO2 part of it, that is its active spectral bands specifically.

lgl
Reply to  Kristian
February 25, 2015 3:34 pm

ENSO down > less WV in the tropics > DLR down, easy.

Richard M
Reply to  Kristian
February 25, 2015 8:38 pm

Look at your data in 2010. It is a high period (probably due to ENSO). If you limit the data to 2000-2010 there might actually be a slight increase. Is this paper pure cherry picking?

Reply to  Kristian
February 25, 2015 9:46 pm

@ Richard M…you hit the nail on the head with that thought. Not only was 2010 a moderate El Nino year, but the year 2000 was the deepest part of a La Nina.

DC Cowboy
Editor
Reply to  Kristian
February 26, 2015 4:52 am

“They are simply targeting the CO2 part of it, that is its active spectral bands specifically.”
what you say may be true, but, if it is, how do they distinguish between CO2 & Water Vapor, which, as I understand it overlaps the CO2 spectral bands almost completely (which is why the tropics don’t seem to respond to increasing levels of CO2 but the Antarctic does?).

Reply to  Kristian
February 26, 2015 7:54 am

dccowboy
Antarctica ? In theory perhaps. In reality, not so much:
From the sidebar:
ftp://ftp.ssmi.com/msu/graphics/tlt/plots/rss_ts_channel_tlt_southern%20polar_land_and_sea_v03_3.png

Crashex
Reply to  Kristian
March 1, 2015 10:09 am

It’s a shame that the paper Anthony references only includes data to 2010, it’s the last five years data that have been particularly interesting. If you crop off your CERES data in 2010 the resulting trends look a bit different than if you include 2011 and 2012. Same for the arctic sea ice area and volume behavior. Same for the global temperature trends.
The plot the Anthony references has an interesting variation to the overall trend the last couple years. While the peaks for CO2 continued to increase, both the peak and minimums to the Forcing curves did not increase. Wonder which trend persisted through the 2014 data?

whiten
Reply to  Ian Schumacher
February 25, 2015 4:00 pm

Ian Schumacher
February 25, 2015 at 11:28 am
You ask:
“Excuse my ignorance, but would CO2 forcing correlate well with CERES radiation measurements? And does it?”
——————–
Not necessarily with the CERES calculated CO2 forcing as actually per this particular case.

whiten
Reply to  Ian Schumacher
February 25, 2015 4:08 pm

Ian Schumacher
February 25, 2015 at 2:17 pm
Again, you ask:
Why should I believe this new data over the CERES data (which shows no positive correlation),
——————–
Because this new data are a measurement, a physical measurement, when in the same time CERES data in this one is a calculation not a real measurement, less credible…, beside, very likely CERES calculation relying in Temp measurements, directly or indirectly.
Please someone correct me if I got this one wrong.
cheers

climatebeagle
February 25, 2015 11:28 am

3300 and 8300 measurements over a ten year period, I would have expected many many more, for example recording every five minutes, not around once per day.

Bubba Cow
Reply to  climatebeagle
February 25, 2015 12:17 pm

I wonder about that too – assuming 365 days/yr – 3300 measurements would, if evenly done, allow 82% of days to be measured and 8300 could be twice/day. But so far, we haven’t learned much about their sampling methods. The graphs seem to show continuous lines but they say only “on a near-daily basis” whatever that means?

sideline observer
Reply to  Bubba Cow
February 25, 2015 1:02 pm

Another question:
Why does the error range seem to be greater for the Oklahoma series than the Alaska series where the sampling was 2.5 times ?

sideline observer
Reply to  Bubba Cow
February 25, 2015 1:04 pm

2.5 greater than the Alaska sampling?

Aussiebear
Reply to  climatebeagle
February 25, 2015 5:59 pm

With that being said, even if it was close to once a day, what time of day? What it consistent? Same for the 2.5/day average. If the sampling time as not consistent, could that be a problem for any conclusion being drawn from the data. I could be wrong, but doesn’t the rate of CO2 uptake and release vary with time of day especially in OK with a lot of biological/plant activity? Just curious.

Gregory
February 25, 2015 11:30 am

Also, those sure are some wide data lines aren’t they

CodeTech
February 25, 2015 11:32 am

Meanwhile, back in reality, if it was even possible for CO2 levels to create temperature havoc, it would have already happened. Since the planet is still here, it’s only pseudo-science.
Simple convection effects completely swamp any tiny radiative changes, and that doesn’t require decades of data fiddling, name calling, bad science, government grants, increased taxes, etc.

Robert of Ottawa
Reply to  CodeTech
February 25, 2015 3:17 pm

Here, Codetech, you are trashing, correctly, the “positive feedback” hand waving that is so important to the Warmistas, as even they say the direct CO2 effect is small.

Janice Moore
Reply to  CodeTech
February 25, 2015 3:42 pm

Aaaaa! That video is sabotaged at the end by a ROBOT SPEWING JUNK SCIENCE! I’ve asked the mod (in a comment invisible to all but me and the mod) to remove it. Sorry for not watching to the very end.

u.k.(us)
Reply to  Janice Moore
February 25, 2015 4:48 pm

I hate it when that happens 🙂

Janice Moore
Reply to  u.k.(us)
February 25, 2015 5:51 pm

Oh, brother (wry smile) — Hi, U.K. — I thought THAT comment would go away as a “reply” to the original messed up video post. OH. WELL. 🙂
Hope you enjoyed watching the magical sight of the falling snow.

u.k.(us)
Reply to  Janice Moore
February 25, 2015 6:08 pm

I saw nothing of the sort/ or the video, just giving you a hard time 🙂
I’ve been there.

Janice Moore
Reply to  Janice Moore
February 26, 2015 10:00 am

The video referred to here was one about positive feedback loops in systems engineering. It has been removed. Thanks mod!

Janice Moore
Reply to  CodeTech
February 25, 2015 3:49 pm

Excellent point re: Positive Feedback Loop Gain (process engineering principles), Code Tech. You just sunk the AGW battleship.
Engineers rock!
They should be running the government (but, they are just too busy… ALL the time….. (sigh)).
#(:))

Crispin in Waterloo
Reply to  Janice Moore
February 26, 2015 8:38 am

Janice, how miserably right you are. 🙁

Alberta Slim
Reply to  CodeTech
February 25, 2015 4:19 pm

Absolutely right on…

whiten
Reply to  CodeTech
February 25, 2015 4:23 pm

Code Tech.
Meanwhile, back in reality, if it was even possible for CO2 levels to create temperature havoc.
——-
This new thing here does not prove that CO2 emissions cause climate change or as you put it, temperature havoc………, it simply proves that CO2 emissions increase RF (Radiative Forcing).
cheers

Bubba Cow
Reply to  whiten
February 25, 2015 4:44 pm

actually they have, at least here, shown in graphs that behaviors of CO2 and radiative forcing eyeball similar “trends”. They don’t provide the data or the stats – say correlations – to estimate any relationship and,even if they did or do in the paper, that wouldn’t prove anything.

whiten
Reply to  whiten
February 25, 2015 5:59 pm

Bubba Cow
February 25, 2015 at 4:44 pm.
actually they have, at least here,
—————–
Another Moshering here for you….:-)
Wrong, they have not…….
cheers

scarletmacaw
Reply to  whiten
February 25, 2015 7:30 pm

The showed that increased CO2 levels correlate with an increase in downward radiation in the wavelengths that CO2 absorbs. That was never in question. Your tax dollars (= money taken by force from productive citizens) at waste.

CodeTech
Reply to  whiten
February 25, 2015 7:39 pm

Exactly what scarletmacaw said.
NOBODY (that I know of) has ever said that CO2 has absolutely NO effect, just that the effect it has is inconsequential. And that is something that neither you nor anyone else CAN EVER SHOW.
The preponderance of evidence is that we should not be worrying about CO2, not even a little, at the levels we’re dealing with.

DC Cowboy
Editor
Reply to  whiten
February 26, 2015 5:00 am

Didn’t we already know that (except for the Skydragon Slayers anyways). I don’t know of any ‘skeptical’ scientists that ‘deny’ that CO2 causes increased DWLWIR over an absence of CO2. So does water vapor.
And Anthony, I don’t expect that this will ‘shut up’ the Skydragon folks.

Chris
Reply to  CodeTech
February 26, 2015 9:03 am

How do simple convection effects swamp radiative changes? Convection simply moves heat around within the earth’s biosphere, that has nothing to do with the net inflow of heat into the biosphere changing due to changes in radiative forcing,

CodeTech
Reply to  Chris
February 26, 2015 2:51 pm

Simple.
CAGW hypothesis is that CO2 “traps” heat, leading to harmful atmospheric changes.
Reality is that convection moves any “extra” heat around, completely eliminating ANY possibility of harmful (or unusual) temperatures.
If heat can’t escape as easily into space due to the imagined CO2 blanket, warmer air simply convects higher to radiate to space.
This is what is actually happening, as opposed to the elaborate, and incorrect, nitpicking regarding individual photons, DWLWIR, etc.
Heat outflow always matches inflow, no matter what happens in between. Although ACC is a popular hypothesis, it is disproved each and every single day, which is why the whole “climate change” meme has absolutely nothing to do with science, and everything to do with political goals.

Myron Mesecke
February 25, 2015 11:32 am

Okay, I’m not in any way, shape or form a scientist and don’t even to pretend that my math skills are strong enough to conduct science. But…
“We see, for the first time in the field, the amplification of the greenhouse effect because there’s more CO2 in the atmosphere to absorb what the Earth emits in response to incoming solar radiation,” says Daniel Feldman,
These instruments, located at ARM research sites in Oklahoma and Alaska, measure thermal infrared energy that travels down through the atmosphere to the surface. They can detect the unique spectral signature of infrared energy from CO2.
Other instruments at the two locations detect the unique signatures of phenomena that can also emit infrared energy, such as clouds and water vapor.

They say “what the Earth emits” but then don’t measure anything going up. They just measure what is coming down.

Jimbo
Reply to  Myron Mesecke
February 26, 2015 2:42 am

The science is settled. This is what happens when you set up an organisation like the IPCC too early. Conclusions are reached before the real research gets going!

August 5, 2014
Paper finds a decrease of IR radiation from greenhouse gases over past 14 years, contradicts expected increase – cloudiness blamed for difference.
A paper published in the Journal of Climate finds from 800,000 observations a significant decrease in longwave infrared radiation from increasing greenhouse gases over the 14 year period 1996-2010 in the US Great Plains. CO2 levels increased ~7% over this period and according to AGW theory, downwelling IR should have instead increased over this period…………..
http://wattsupwiththat.com/2014/08/05/bombshell-study-shows-greenhouse-gas-induced-warming-dropped-for-the-past-14-years/

Reply to  Jimbo
February 26, 2015 5:28 pm

That’s because the Great Plains are drier during a warm AMO mode:
http://www.atmos.umd.edu/~nigam/GRL.AMO.Droughts.August.26.2011.pdf

ralfellis
February 25, 2015 11:34 am

Quote:
This increase (in CO2 forcing) is about ten percent of the trend from all sources of infrared energy such as clouds and water vapor.
_______________________________
Ok, so what they are saying is that Global Warming is 90% caused by water vapour and clouds. So why are we worrying about CO2? What is the point in trying to eliminate a source of 10% of the warming trend?
R

A C Osborn
Reply to  ralfellis
February 25, 2015 11:50 am

Great spot ralfellis, I wonder why our host did not mention it?
We need to drastically cut out all atmosheric water of any kind.
Oh hang on a minute, just like reducing CO2 to zero everything dies.

Robert B
Reply to  A C Osborn
February 25, 2015 12:54 pm

“What is really the issue related to AGW claims are the posited/modeled but not observed feedbacks”
It is kind of mentioned. I don’t know about putting the Dragon Slayers in their place though. The energy measured is coming from CO2 within a few hundred metres.
Remember that this graph shows that the rate of ‘forcing’ increase was the same pre-2000, assuming that it correlated well with CO2 levels then as well, and we still have a pause/hiatus/cessation/bloody freezing in the NH now.

Aphan
Reply to  ralfellis
February 25, 2015 12:59 pm

That was exactly my first thought too ralfellis ! “10% of the trend of FORCING from all sources of infrared energy.”
And there is NO PROOF offered that the increased CO2 was from human sources. If the oceans are warming up as stated, then the oceans are going to outgas more C02.
Also…question for the experts here…how relevant to “global warming” is the CO2 radiative forcing detected at a surface in Alaska that is covered with snow/ice all year (almost all year?) considering albedo etc. And the OCO-2 satellite shows us that CO2 is NOT a “well mixed greenhouse gas”…the current map shows a difference in CO2 readings that is 15.5 ppm!! So how could BOTH places register the exact same “22ppm” increase…is that 22 ppm a “global average” or were they actually as “precise” as they claim to have been?

Reply to  Aphan
February 25, 2015 9:59 pm

+1 great question

Crispin in Waterloo
Reply to  Aphan
February 26, 2015 8:43 am

Aphan, the variation in CO2 in Alaska is FAR more than in Kansas. 15.5 ppm is not even close. Have a look at the Point Barrow CO2 levels during the year.
As someone who has to measure and deduct background CO2 from experiments, I have seen 1100 ppm CO2 floating by the lab, with a duration of less than an hour. Sometimes it is less than 400. In anyone’s ordinary life the CO2 is not constant at all near the surface. Mixed? More like mixed up.

Editor
Reply to  ralfellis
February 25, 2015 6:57 pm

Thanks Ralph. Saved me posting it. What a stupid world we livevin.

harrytwinotter
Reply to  ralfellis
February 27, 2015 6:27 am

Back of the envelope calculations.
If CO2 increase is contributing 10% of the forcing trend, then 90% of the forcing trend must be something else, I assume water vapour feedbacks mostly. This gives an increase of around 1.8 W/m2 per decade.
So the 10% from CO2 is significant as it drives the increase of around 1.8 W/m2 per decade in the total clear-sky longwave flux at the surface.

rh
February 25, 2015 11:38 am

It looks like the two curves are diverging at about the same rate as all of the model vs. reality graphs. Maybe it’s “the logarithmic (not linear) saturation curve response of CO2”, or maybe it’s the increasing rate of growth of plants now that they are less CO2 deprived. Hopefully they release their data and methodology. I’d like to see it get the Eisenbach treatment before buying in.

Ian H
February 25, 2015 11:44 am

OK – if they have the instruments to do this for CO2 then please hurry up and do it also for H2O. The H2O contribution needs to be going up at around 3 times or more the rate of the CO2 contribution if the positive feedback assumption (on which the whole CAGW edifice is constructed) is to be correct. If it isn’t then CAGW is a busted flush. They mention that separating out the contribution from water vapour was obviously a problem for them, so they must surely be able to measure it.
Measuring the radiative effect of CO2 as they have done is an impressive piece of experimental physics, but the result is quite uncontroversial and banal. Only the sky dragon lot will be challenged by it. Measuring the radiative contribution of H2O however goes to the heart of the dispute between mainstream skeptics and the current paradigm over the size of the feedback and is potentially of huge significance. Why do one but not the other? Were the results unexpected?
A graph showing the H2O contribution to radiative ‘forcing’ going up in lockstep with the CO2 contribution but at over three times the rate would be one of the few pieces of evidence at this point that might persuade me to change my mind. The other piece of evidence I’d need to see is accurate measurements of cloud coverage and albedo to show that this has not changed in compensation.

Joe Crawford
Reply to  Ian H
February 25, 2015 3:44 pm

OK – if they have the instruments to do this for CO2 then please hurry up and do it also for H2O…
… They mention that separating out the contribution from water vapour was obviously a problem for them, so they must surely be able to measure it.

Yep. I am suspicious that since they had to measure/calculate the H2O effect in order to get what they were looking for with the CO2 the H2O didn’t match expected. If it had I am sure it would have been included.

G. Karst
Reply to  Ian H
February 25, 2015 5:02 pm

Yes, the most important parameter data would be the water IR signal. Hopefully we will see that data soon as it must exist. GK

A C Osborn
February 25, 2015 11:46 am

So, these measurements are only taken at night then?
So where are the links to the data, has it been properly Peer Reviewed?
Why does it need “The scientists used the National Energy Research Scientific Computing Center (NERSC), a DOE Office of Science User Facility located at Berkeley Lab, to conduct some of the research.”
to do this research.
After seeing what BEST does to surface temperature records I would not trust anything that comes out the the place.
And then there is this “They can detect the unique spectral signature of infrared energy from CO2.”
With what accuracy I wonder?
So that is the one tiny little band where it is not swamped by H2O then.
As someone else said what were the Error Bars on the 0.2 W/m^2?

AndyG55
Reply to  A C Osborn
February 25, 2015 12:00 pm

“After seeing what BEST does to surface temperature records I would not trust anything that comes out the the place.”
Nail. meet hammer !!!

Reply to  A C Osborn
February 25, 2015 12:12 pm

You want a real hoot, take a look at SURFRAD. Go pull a “downwelling” plot from any site and see where they’ve got a floor of at least 190 w/m²… which I have to assume is the cavity temperature of their sensor. Or they’re doing some more mathematical adjusting. I guess they never learned Stefan’s Law in science class…

Reply to  nielszoo
February 25, 2015 4:12 pm

KaiserDerden February 25, 2015 at 2:31 pm
and doesn’t the water signal cover the same frequencies as CO2 ?

No.

David Ball
Reply to  nielszoo
February 25, 2015 8:51 pm

Phil. – Links please.

acementhead
Reply to  nielszoo
February 25, 2015 9:58 pm

Phil. February 25, 2015 at 4:12 pm
KaiserDerden February 25, 2015 at 2:31 pm
and doesn’t the water signal cover the same frequencies as CO2 ?
No.

Incorrect Phil, there is a lot of overlap between water vapour and carbon dioxide absorption spectra.
https://encrypted-tbn3.gstatic.com/images?q=tbn:ANd9GcSyV3jKQP83Xnj3s_w03Fu6Yo-nabi17fMLKFIPKXG5D0NOp4czgg

Reply to  A C Osborn
February 25, 2015 12:37 pm

They can pick CO2 out well enough. I did some IR spectra in advanced organic chemistry labs that will be taken by any chemistry undergrad in any advanced country.
The water signal, on the other hand, is very broad and harder to pick out.

KaiserDerden
Reply to  ladylifegrows
February 25, 2015 2:31 pm

and doesn’t the water signal cover the same frequencies as CO2 ?

Gary Hladik
Reply to  ladylifegrows
February 26, 2015 6:45 pm

KaiserDerden, in an atmospheric absorption graph, the CO2 bands at 4.3 and 15 microns are distinguishable as “shoulders” on the H2O spectrum:
http://clivebest.com/blog/wp-content/uploads/2010/01/595px-atmospheric_transmission.png

milodonharlani
Reply to  ladylifegrows
February 26, 2015 7:02 pm

Gary,
Great graphic. Thanks!

Reply to  ladylifegrows
February 26, 2015 9:23 pm

Well repeating that old, low resolution, cartoon of a spectrum shows nothing, here are proper spectra of CO2 and H2O from the 15 micron band which show how little overlap there is between the spectra.
http://s302.photobucket.com/user/Sprintstar400/media/H2OCO2.gif.html

Reply to  ladylifegrows
February 26, 2015 9:25 pm

The link above appears corrupted, try again.
http://i302.photobucket.com/albums/nn107/Sprintstar400/H2OCO2.gif

mobihci
Reply to  ladylifegrows
February 28, 2015 9:36 pm

phil, the chart posted (low res if you like) is correct enough. the fine lines are broadened by various functions.
http://www.arm.gov/publications/proceedings/conf09/extended_abs/mlawer_ej.pdf
see page 4 figure 3 for a comparison of no continuum and a ckd model.
there it shows the reality is closer to the “low res” graph than the individual lines. the water vapour by itself is also correct. yes there is more saturation of co2 in that region, however there is water vapour absorption there (as shown by the graph) and there is up to 1000x more of it in the atmosphere.

February 25, 2015 11:46 am

I would love to see this paper. If they’re using the same convoluted math they use for the SURFRAD system the data is mathematically created fiction. Even if they’ve got a sensor system with a cavity resonator tuned below 190°K and the filters that could read CO2 @ 15μ the ONLY temperature “forcing” they’re reading is from atmosphere to sensor. CO2’s peak radiation is ~193°K… and the only place that energy’s going is out to space at 3°K or possibly to the middle of Antarctica in July. Just because they can do the math backwards doesn’t mean that entropy in the real world can go backwards.

February 25, 2015 11:50 am

0.2 Watts per meter squared? HAHAHAHA! That’s 2 Watts per 100 years.
That’s 1%, in 100 years. NOT ENOUGH TO CAUSE A NOTICEABLE DIFFERENCE!
Heaven help us.

rh
Reply to  Max Hugoson
February 25, 2015 11:58 am

TSI change by sunspots is about five times that amount, and we know that doesn’t have any affect on global temperatures. Right?

bones
Reply to  rh
February 25, 2015 1:35 pm

rh – +1

jonesingforozone
Reply to  rh
February 25, 2015 3:02 pm

Changes in EUV radiation and the solar wind are much larger than changes in the total solar irradiance.

Reply to  Max Hugoson
February 25, 2015 12:14 pm

Hey, that’s a dangerously high 43°K… you could get a really severe burn. OK, it would be frostbite, but still it still counts as a burn.

Thinair
Reply to  Max Hugoson
February 25, 2015 2:10 pm

0.2 x 100 = 20

Thinair
Reply to  Thinair
February 25, 2015 2:14 pm

Never mind. 0.2 x 10 decades = 2

The Engineer
Reply to  Thinair
February 25, 2015 2:31 pm

0,2 watts pr. decade – altså 0,2 x 10 = 2,0 watts pr. century.

Hugh
February 25, 2015 11:53 am

People mention the logarithmic nature of CO2 forcing. Yes, the log nature appears when you double the amount and then double it again. On yearly and decadal level the percentage of change is so small it differs little from its linear approximation.
That’s why drawing CO2 growth and temp on the same graph does not do much violence at a short period of time, given the scaling factor used is representing the chosen TCR assumption.

george e. smith
Reply to  Hugh
February 25, 2015 3:33 pm

There is NO experimentally measured evidence that anything depends on the logarithm of the CO2 molecular abundance. You can’t experimentally differentiate it from a linear dependence. You can also fit the Temperature / CO2 relationship to the function :
Y = exp(-1/x^2) with suitable parameters, and (x , y) are Temp and CO2 abundance (in either order).
So far in measured data, there has been about 25% of one doubling.
Ln(1+x) = x (roughly)
Nor is there a theoretical basis for assuming a logarithmic relationship. It could be non linear, but it isn’t logarithmic.
If it was logarithmic, you would get the same Temperature change going from one CO2 molecule per litre (at STP) to two CO2 molecules per liter. You don’t !

Hugh
Reply to  george e. smith
February 26, 2015 5:59 am

Ln(1+x) = x (roughly)

Yes, when |x| is small. That was my point, thanks for expressing it.

If it was logarithmic, you would get the same Temperature change going from one CO2 molecule per litre (at STP) to two CO2 molecules per liter. You don’t !

Reductio ad absurdum. Yes, it is definitely not mathematically precisely logarithmic, which would mean equal cooling to each halving of CO2. That would lead to colder than 0K temperatures on zero-CO2 boundary. Also I was talking about temperature, but CO2 causes warming in W/m2, which converts somehow to a surface temperature change. Thanks for bringing this into my attention.
However, you may also want to read this old wattsupwiththat.

MikeB
Reply to  george e. smith
February 26, 2015 7:08 am

The warming effect of CO2 is logarithmic at current concentrations. At low concentration, the effect is linear.

Reply to  george e. smith
February 27, 2015 9:10 am

George, there is a very good basis for the logarithmic relationship, it arises from the curve of growth, see e.g.
http://www.physics.sfsu.edu/~lea/courses/grad/cog.PDF
For weak lines it gives a linear relationship which is what you’d get in your example of 1molec/l->2molec/l
See 0.1 in ref.
For moderately strong lines (CO2 in today’s atmosphere) it gives a log relationship: see 0.2.1
For very strong lines it gives a square root relationship: see 0.2.2

Aphan
Reply to  george e. smith
February 27, 2015 10:13 am

http://deforestation.geologist-1011.net/
To toss in a graph amongst all this logarithmic discussion that shows no correlation at all….because I’m currently on the fence…

whiten
Reply to  Hugh
February 25, 2015 4:32 pm

Hugh
February 25, 2015 at 11:53 am
logarithmic nature of CO2 forcing.
————————
Let me do a Mosher arguing here.
Nope, wrong, Logarithmic nature of CO2 is only a figment of imagination…..sorry.
cheers

Janice Moore
Reply to  whiten
February 25, 2015 5:34 pm

Heh, Whiten, you are too kind to do M0sher.
M0sher: Nope.
🙂

Hugh
Reply to  whiten
February 25, 2015 8:50 pm

So you disagree with Alan Watts?
That’s OK.

Gary Pearse
February 25, 2015 11:55 am

Why do these guys stop at 2010? A guess would be that a divergence is apparent starting from 2008. Trenberth also forgot about the years after 2010 when the temps were heading into a decline. I’m thinking a good board game would be “Hide the Decline” – a lot of interesting possibilities come to mind.

mpainter
Reply to  Gary Pearse
February 25, 2015 1:18 pm

“The scientists used incredibly precise spectroscopic instruments..”
####
Do we have more scientists who fail to distinguish between precision and accuracy?. These are different. I am not so much impressed by precision as I am by accuracy. You can have data that is very precise but inaccurate.
Note “incredibly precise” but nothing about accuracy.
Note that the data spans a decade 2000-2010, ending 5 years ago. Hmmm. So what about these last five years? Why such a tardy report? Somethin’ dead in the woodpile.

Alan McIntire
February 25, 2015 11:57 am

A doubling of CO2 would supposedly increase the flux at earth’s surface by 3.7 watts.
Currently the average wattage per square meter, assuming an average temperature of 15 C or 288 K, is 390.7 watts.
A century of increase in CO2 caused wattage flux of 0.2 watts/decade is 2 watts. Since wattage increases as the fourth power of the temperatue That would result in a temperature increase of about
1/4 (288/390.7) degress K per wat increase, or 0.18 degrees per watt. At the measured increase of 2 watts per century, we can expect a temperatue increase of 0.36 K by 2115.

Louis
Reply to  Alan McIntire
February 25, 2015 12:35 pm

How do their results compare to what the IPCC predicted for CO2 forcing? Anyone know?

Matthew R Marler
Reply to  Alan McIntire
February 25, 2015 8:04 pm

Alan McIntire: At the measured increase of 2 watts per century, we can expect a temperatue increase of 0.36 K by 2115.
I expect that by now that computation has been done by hundreds of people worldwide, soon to be read by thousands, and then more. I expect much followup to this paper: more data collection and more commentary.

Danny Thomas
Reply to  Matthew R Marler
February 26, 2015 9:21 am

Matthew R. Marler,
Could that have meant .36C, not K?

Danny Thomas
Reply to  Matthew R Marler
February 26, 2015 9:28 am

Matthew R. Marler,
Please ignore my question about K vs. C. I see where I erred.
Regards,

AndyG55
February 25, 2015 12:04 pm

“At the measured increase of 2 watts per century, we can expect a temperature increase of 0.36 K by 2115.”
Can we now stop the demonisation of CO2, and stop the insidious spread of bird-munchers and get back to feeding the world’s plant life properly !?
Also, this destroys the world push for UN governance.. Obama will not be happy !

AlecM
February 25, 2015 12:04 pm

Dream on sucker.
50 years of incorrect Physics’ teaching means ‘Forcing’ is unphysical.
There is no Enhanced GHE. The non-enhanced GHE is near zero.

Harold
February 25, 2015 12:08 pm

“The scientists used incredibly precise spectroscopic instruments operated by the Atmospheric Radiation Measurement (ARM) Climate Research Facility, a DOE Office of Science User Facility.”
Sounds like marketing material. Can they elaborate on what these “incredibly precise” thingbobs are, and what they’re measuring so incredibly precisely? Is their definition of “precise” the same as the reviewers of Pat Frank’s paper used? And I don’t think “incredible” means what they think it means.

Janice Moore
Reply to  Harold
February 25, 2015 12:52 pm

LOL, good one, Harold. Pretty pathetic.
Note: They did not say “accurate.” Got a little loophole, there, eh, Envirostalinists?

F. Ross
Reply to  Janice Moore
February 25, 2015 3:14 pm

Second that.

old44
Reply to  Harold
February 25, 2015 1:18 pm

Sounds like it was written by Douglas Adams.

jonesingforozone
Reply to  Harold
February 25, 2015 3:08 pm

For a graphic distinction between “accuracy” and “precision,” see CBeaudry’s post, http://wattsupwiththat.com/test/#comment-1867650

Alx
Reply to  Harold
February 25, 2015 3:44 pm

It means some drunk guy tried to come out each day to take readings, Occasionally he noted them correctly. If he was too drunk to come out for a few days he would fabricate notations for the days he missed. The data is incredibly precise and reliable.

February 25, 2015 12:08 pm

“The influence of atmospheric CO2 on the balance between incoming energy from the Sun and outgoing heat from the Earth (also called the planet’s energy balance) is well established. But this effect has not been experimentally confirmed outside the laboratory until now.”
OK, help me out it. We have a guess about how this works that is well established but has never been verified? So, it’s well established how?

Konrad.
Reply to  Cube
February 26, 2015 1:11 am

Cube,
their claim of the atmospheric radiative GHE being “well established” is of course complete garbage. The idea that adding radiative gases to the atmosphere will reduce the atmosphere’s radiative cooling ability remains as inane as ever.
All that has been demonstrated in this study is a new way of detecting CO2 in the atmosphere.
This tells you nothing about the role of radiative gases in our radiatively cooled atmosphere, let alone the role of our radiatively cooled atmosphere in cooling our solar heated oceans.

Toneb
February 25, 2015 12:10 pm

“I’ve never disputed that CO2 has a role in warming via retardation of IR transfer from the surface to the top of the atmosphere.”
Thank you Anthony for that clarification of your position.
It is very hard to recognise that fact when coming here to read your Blog – as indeed many posters are from the “the “Skydragon slayers” department”. Or the conspiracy ideation league.
I always thought a fellow Meteorologist would stand by the role of CO2 as a GHG.
More info on the paper here:
http://www.nature.com/nature/journal/vaop/ncurrent/fig_tab/nature14240_SF5.html

Alx
Reply to  Toneb
February 25, 2015 3:49 pm

There is no dispute as to whether CO2 is a GHG. The dispute is that CO2 in a greenhouse or lab or math equation, is not the same as CO2 in a planetary atmosphere and eco-system.
The dispute is taking a taking a simple theory and jumping the shark with it.

Don Perry
Reply to  Alx
February 25, 2015 5:43 pm

The real dispute is what water vapor does. The increased CO2 allegedly causes an increase in temperature, which results in an increase of water vapor. The models are set to assume water vapor acts as a strong positive warming feedback, while others say water vapor acts as a negative cooling feedback. Observations tend to support the latter. Either way, the models have been seriously flawed.

whiten
Reply to  Alx
February 26, 2015 8:36 pm

Don Perry
February 25, 2015 at 5:43 pm
The real dispute is what water vapor does. The increased CO2 allegedly causes an increase in temperature, which results in an increase of water vapor. The models are set to assume water vapor acts as a strong positive warming feedback, while others say water vapor acts as a negative cooling feedback. Observations tend to support the latter. Either way, the models have been seriously flawed.
—————–
The big problem is that there is no any significant increase of “water vapor”.
That is what observations support.
Seems like both are wrong in that one,……. as both seem to be wrong also with the assumption of the logarithmic relation of CO2 and RF.
With careful consideration it becomes obvious that both approaches lead to ACC, one through AGW and the other through abrupt climate disruption due to disruption of ocean atmosphere coupling.
cheers

Reply to  Alx
February 28, 2015 1:00 pm

Toneb
There is in fact dispute and it is not irrational, for you to dismiss other views out of hand shows your ignorance.
l

Editor
Reply to  Toneb
February 25, 2015 7:22 pm

Thank you Anthony for that clarification of your position.“. This really p’s me off. Anthony has stated time and time again, as have many of those who dispute CAGW here, that CO2 is a greenhouse gas, that it does have a warming effect, but that it does not warm the planet anything like as much as is claimed. The pro-CAGW fraternity have continually and relentlessly misrepresented Anthony’s and others’ position, in order to maintain the misconception that A&Co are d-n–rs. I think the correct term for your statement is “slime”.

Danny Thomas
February 25, 2015 12:16 pm

Still not a scientist, and doubting I ever will be. Out of no concern of embarassment I need to ask (again) for assistance.
If CO2 acts as a restriciton which holds in energy from solar IR, is there any evidence that the same change in CO2 levels has reduced incoming IR? As I understand, CO2 “absorbs” and re-radiates all directions. But due to the increase in atmospheric concentrations, wouldn’t one expect there to be a change both directions that should be measurable? Considering all the variables in the climate on the planet, why wouldn’t one expect to see fewer variables and therefore a variation more measureable above the atmosphere?

Gary Pearse
Reply to  Danny Thomas
February 25, 2015 12:31 pm

The main sunlight radiation passing through the atmosphere on the way down is not IR. When it heats the surface, the surface converts it to more IR so radiation going up is different that going down. It is this larger amount of IR that gets slowed by CO2 (and water vapour)

Danny Thomas
Reply to  Gary Pearse
February 25, 2015 12:59 pm

Gary,
Thank you. I missed the first part: “The main sunlight radiation passing through the atmosphere on the way down is not IR.” Gotta find a good on line class.
Still makes me wonder if the theory is that the IR is absorbed and re-emitted in all directions then it seems the “volume” of IR would be more easily measured with fewer variables if looked at above the atmosphere. Is this thinking off base considering an ever increasing emission of CO2? Maybe we don’t have a base line with which to compare except since the satellite era.

Aphan
Reply to  Gary Pearse
February 25, 2015 1:14 pm

Danny-
Incoming sunlight energy is short wave radiation (SWR) and the ocean surface and land surfaces absorb this radiation and warm up. Then they emit long wave radiation (LWR) back into the atmosphere. CO2 (and water vapor and methane etc) only absorbs and re-emits LWR.
Clouds and aerosols absorb/reflect some of the incoming SWR and return it to space before it has a chance to become LWR at the surface.

bones
Reply to  Gary Pearse
February 25, 2015 1:39 pm

Nevertheless there is a significant amount of flux incoming in the near IR and it should, indeed, be measurable.

Danny Thomas
Reply to  bones
February 25, 2015 2:16 pm

Bones, et al,
I’m obvioulsy a bit lost. Am I to understand that the sun does not produce the same wavelengths of radiation as that which is returned from the earth after orgination from the sun?
If it does, it seems like it would be “measurable” from both the earth prior to entering the atmosphere to see if there is a delta after and then again at surface. If there is no base line for comparison one could be started, and comparisons made?
Suggestions on resources?
Thanks,

Reply to  Gary Pearse
February 25, 2015 2:38 pm

Incoming solar radiation gets absorbed by the atmosphere too, the same as at the surface. Comes in as a black body, leaves as IR. The planet warms from space down, not the surface up, which is the biggest omission, mistake, or lie of the AGW theory.

asybot
Reply to  Gary Pearse
February 25, 2015 8:27 pm

This data started in 2000 ran till 2011 and is eerily similar to the rise of the current (small ) solar max cycle, which btw is now 4 -5 years later in said cycle and almost over. The forcing in 2010 is already lower than in 2011. It would have been nice to see the data gathered a little longer to see were it would be today. (@ Danny Thomas I am not a scientist either but you ask good questions, thanks)

Aphan
Reply to  Danny Thomas
February 25, 2015 6:15 pm

http://www.physicalgeography.net/fundamentals/7i.html
Here’s a link to a pretty basic description of Earth’s energy budget. I haven’t checked all the math, and some energy budget figures are debated/estimated, but this site seems to lay out the cycles etc pretty well.
Satellites can supposedly measure the difference between incoming and outgoing radiation (according to James Hansen who claims there is less outgoing than incoming) but there are still error margins in those measurements and of course the satellites that do it are owned by NASA etc so who knows if there’s any way to verify them independently.

Danny Thomas
Reply to  Aphan
February 25, 2015 7:06 pm

Aphan,
My next homework assignment as I must gain a (better?) grasp on the concept. I very much appreciate your offering.
My thanks!

Aphan
Reply to  Danny Thomas
February 26, 2015 3:37 pm

You’re very welcome. I’m a baby in all this sciencey wiencey stuff myself, but I love to learn and many here have helped me in the past.

Gary Pearse
February 25, 2015 12:17 pm

Other things:
1) Barrow is in total darkness for just over two months a year and not a lot of light for probably half that (total 1/3 of a year).
2) because of the snow and ice, albedo and angle of incidence, 70-80% of the incident light is reflected from October until April-May.
3) there aren’t any plants to speak of for this robust absorbtion of CO2.
The responses should be markedly different for Oklahoma and Barrow, unless you are actually measuring something different than you think.

Bubba Cow
Reply to  Gary Pearse
February 25, 2015 12:40 pm

and how much photosynthetic activity is there in Spring of wherever Oklahoma?

Bubba Cow
Reply to  Gary Pearse
February 25, 2015 12:55 pm

think I found it – SGP = Southern Great Plains
SGP Central Facility, Lamont, OK
36° 36′ 18.0″ N, 97° 29′ 6.0″ W
Altitude: 320 meters
The SGP site consists of in situ and remote-sensing instrument clusters
arrayed across approximately 55,000 square miles (143,000 square kilometers)
in north-central Oklahoma.
The heart of the SGP site is the heavily instrumented central facility
located on 160 acres of cattle pasture and wheat fields southeast of
Lamont, Oklahoma.

Kelvin Vaughan
February 25, 2015 12:18 pm

Am I understanding this correctly?
Comparing 200ppm to 400ppm CO2.
Roughly speaking, 200 extra parts per million CO2 has to absorb enough energy to raise the other 999800 parts per million of the atmosphere by 1°C, very roughly from15°C to 16°C which is approximately about a 5 watts per square metre change.
200 is 1/5000 of 1 million therefore 200 parts of CO2 has to absorb 5,000 times the energy to raise the temperature of the other 999800 parts.
To raise 1 square metre of atmosphere by 5 watts, CO2 would have to absorb 25000 watts?

Reply to  Kelvin Vaughan
February 25, 2015 2:42 pm

Well spotted.
It also needs to stop any of this extra energy escaping into space.

Alberta Slim
Reply to  Kelvin Vaughan
February 25, 2015 4:30 pm

Very good Kelvin…………

Jim G1
February 25, 2015 12:19 pm

“This increase is about ten percent of the trend from all sources of infrared energy such as clouds and water vapor.” So, the other 90% might not overwhelm the 10%? And the outgassing of CO2 from the oceans due to the warming over the past 12, 000 years of interglacial warming might not be the source of the CO2? And still two decades of no warming. Trade those models in on a Victoria’s Secret model and ask her. Irrespective of her answer it would be a great trade.

DirkH
February 25, 2015 12:20 pm

“Both series showed the same trend: atmospheric CO2 emitted an increasing amount of infrared energy, to the tune of 0.2 Watts per square meter per decade.”
I’m confused. Wasn’t the idea behind the CO2 greenhouse effect that at surface pressures, absorption of IR in the band of CO2 , by a CO2 molecule, is way more likely than (re-)emission? And that therefore, thermalization of IR heats up the (low) atmosphere? And would this not also apply to an IR photon coming from above, i.e. a downwelling radiation, assuming the scientists have pointed their sensor upward.
SO, if CO2 is a net absorber at surface pressure, should they not have measured a decrease of IR photons in that band?

DirkH
Reply to  DirkH
February 25, 2015 12:24 pm

…because, if the concentration of the absorbing element rises, more absorption should happen.

DCE
Reply to  DirkH
February 25, 2015 1:12 pm

We must remember that in the case of CO2 it is not a linear relationship, meaning that if you double the concentration in the atmosphere it does not mean twice the amount of IR radiation will absorbed. There has been some speculation that we are approaching the saturation point where further increases in concentration will have little effect on IR absorption.

mpainter
Reply to  DirkH
February 25, 2015 2:00 pm

tty:
Good point. More wv===>more convection ===>more cooling. Positive feedback is absurd. Increase wv, you simply increase cooling of the atmosphere. In fact, water vapor represents cooling of the surface.

george e. smith
Reply to  DirkH
February 25, 2015 3:18 pm

“””””…..
DCE
February 25, 2015 at 1:12 pm
………………………………………
There has been some speculation that we are approaching the saturation point where further increases in concentration will have little effect on IR absorption.
Not so.
That picture is based on the assumption that the captured photons stay dead; which is a requirement of the Beer-Lambert model.
But the don’t stay dead. because of thermal collisions the excited states are terminated and the photon re-emitted at some line broadened wavelength, so it stumbles on uintil another CO2 moleculse somewhere else re-captures it.
So there isn’t any saturation process. It’s almost as if the CO2 is acting as a catalyst, modifying the photon behavior but without changing the photon (much).

Reply to  DirkH
February 28, 2015 1:12 pm

George
However when the co2 emits the photon it “Cools” so the net result is that no matter how much ir radiation there is the co2 once warmed never again can add to the energy balance. in essance it can only slow the rate transfer once.

Reply to  DirkH
February 25, 2015 1:05 pm

The absorbed energy is all re-radiated and eventually leaves the Earth. The presence of CO2 causes this heat loss to slow down a little as the energy bounces around in all directions for longer. Eventually, there is a new equilibrium at a higher temperature.
I saw that nicely demonstrated by some schoolkids in a You Tube video using sealed boxes with different concentrations of CO2. The question is–what happens in the real atmosphere with no seals, plenty of convection and unknown feedbacks?

CodeTech
Reply to  ladylifegrows
February 25, 2015 1:52 pm

I don’t think it even reaches a new equilibrium at a higher temperature. It’s NOT CO2 that drives temperature, it’s more a function of atmospheric pressure.
Water vapor is lighter than air, and will rise to whatever altitude it takes before radiating enough heat to condense and fall back. The absolute most change that CO2 levels CAN make is to change the altitude of that change. Heat will never build up significantly, it will always be radiated as required.
This is THE fundamental flaw in the whole “greenhouse” hypothesis, and the reason I simply laugh at anyone who thinks CO2 drives climate. It has never done so historically, and it never will.

DirkH
Reply to  ladylifegrows
February 25, 2015 2:33 pm

ladylifegrows
February 25, 2015 at 1:05 pm
“The absorbed energy is all re-radiated and eventually leaves the Earth. The presence of CO2 causes this heat loss to slow down a little as the energy bounces around in all directions for longer.”
According to warmists’ explanations at surface pressure a CO2 that catches an IR photon, with a high probability, collides with another molecule faster than it would take to re-radiate the photon. Situation is reverse in the stratosphere- where re-radiation is more likely.
So, IR is net thermalized near the surface (where they measured) and net de-thermalized higher up (the energy is obviously transported upwards mostly by convection).
BUT this would mean that there should be FEWER free IR photons (what they measure) near the surface if there’s more CO2.
I don’t understand their logic a bit.

DirkH
Reply to  ladylifegrows
February 25, 2015 2:39 pm

And, people on this blog, warmists, and lukewarmers, and generally everyone except the slayers, have lambasted me for not understanding the difference between high and low atmospheric pressure and the according absorption/emission probabilities (I claimed that at every height every absorbed IR photon is net re.radiated – which seems to be false).
Now, these scientists detect MORE IR photons when there’s MORE net-absorbing CO2? Can someone get Tamino and Eli Rabbett to call them nitwits? Or bend themselves into a pretzel while explaining the obvious contradiction away?

george e. smith
Reply to  ladylifegrows
February 25, 2015 2:43 pm

So Ladylife, You watched some u-tube kids do a CO2 radiation absorption experiment.
So what was it that they used as their source of 10.1 micron peak spectral wavelength LWIR radiation at 390 W/m^2 like the earth’s surface puts out.
Was it a bottle of water chilled to about +15 deg. C (288K) or was it a 3,000 K 100 Watt light bulb that is 10,000 times as bright as the bottle of water, and 100,000 times as bright (spectrally) at the peak wavelength; which incidently gives photons having 10 times the photon energy of the earth’s photons or the water bottle’s photons.
Oh that light bulb is 1/16th as bright as the sun’s surface.
So yeah that’s a great experiment to prove that heat conducts through box walls and heats the air inside.

george e. smith
Reply to  ladylifegrows
February 25, 2015 3:06 pm

“””””…..
DirkH
February 25, 2015 at 2:33 pm
ladylifegrows
February 25, 2015 at 1:05 pm…..””””
So Dirk,
Your near surface CO2 molecule at 288 K Temperature, captures a 15.0 micron Photon which is about 86.7 meV energy, and it starts doing the elbow bend oscillation, while still running around consistent with its 288 K Temperature environment, to which the elbow bend oscillation is totally oblivious.
If they leave it alone like up in the stratosphere, it will eventually reradiate about the same 86.7 meV photon, and quit flexing its muscles.
But instead, another nitrogen molecule collides with it, and upsets its timing so it prematurely ejects the photon. But it is still a nearly 86.7 meV photon, except the Heisenberg uncertainty, will change the energy a bit since dE.dt > h’2pi and the unperturbed lifetime of the excited state got perturbed.
So the CO2 molecule and the N2 molecule exchanged some billiard ball kinetic energy and each went off in some other direction, but the CO2 molecules emitted photon is still at about 86.7 mev just slightly line broadened because of the collision.
So just where in this process, did the photon’s energy get “Thermalized” ??
I can’t see it.
Sodium atoms in a sodium lamp absorb and emit 589.0 and 589.6 nano-meter yellow lines.
They also bang into each other, which results in broadening those emission lines. But they never move far from that 589.3 mean wavelength.
The idea that somehow the 86.7 meV energy of a CO2 elbow photon gets cut and divided up and distributed to a bunch of nitrogen, or oxygen or argon molecules, seems pretty phony to me.
The 15 micron dip (13.5 to 16.5 microns) in the as seen from space earth extra-terrestrial spectrum, is not because some of the surface emitted captured photons got thermalized away as some other critters. It is because the emission is isotropic, and only about half of them head in the direction of outer space, leaving a deficit in that 15 micron band as seen from space.
This not peer reviewed research was financed in part by a grant from the Government of New Zealand (circa 1954-57). Just too early to be included in the IGY researches.

Brett Keane
Reply to  ladylifegrows
February 25, 2015 3:28 pm

llg: people who say that should realise that the delay is in millionths of a second, and does not take account of negative feedbacks. Nor do they seem to consider that we are dealing with emissions, not absorptions. Brett

DirkH
Reply to  ladylifegrows
February 25, 2015 3:49 pm

Thanks, George.

Bart
Reply to  ladylifegrows
March 1, 2015 12:09 pm

ladylifegrows @ February 25, 2015 at 1:05 pm
“I saw that nicely demonstrated by some schoolkids in a You Tube video using sealed boxes with different concentrations of CO2. “
You may have seen a claim of that, but it would be impossible to demonstrate it that way. CO2 in sealed boxes does not experience pressure and Doppler and other broadening, and would intercept an utterly negligible amount of outgoing IR. Experiment debunked throughly here.

February 25, 2015 12:21 pm

Do we just “eyeball” their charts and “see” their correlation?

Louis
February 25, 2015 12:23 pm

“They found that CO2 -attributed radiative forcing dipped in the spring as flourishing photosynthetic activity pulled more of the greenhouse gas from the air.”

I have to assume that radiative forcing doesn’t go up much during the summer, either, because plants are still growing. That means the greatest increase of CO2-attributed radiative forcing must be occurring during fall and winter months. Oh no, an increase of 0.02 watts/m^2 each cold-weather season is going to doom us all!

Mike
February 25, 2015 12:24 pm

“The direct sunlight at the earth’s surface when the sun is at the zenith is about 1050 W/m2, but the total amount (direct and indirect from the atmosphere) hitting the ground is around 1120 W/m2”
So my take on their claim of “two-tenths of a Watt per square meter per decade” is the following equation:
MWRD= 0.2W/Decade=Noise
Note: MWRD = More wasted Reseach Dollars

Richard
Reply to  Mike
February 25, 2015 7:51 pm

And they assume a linear increase but all the data I have seen shows everything occurs in cycles. The trend reverses about 2011 and temps moderate and sea ice increases.

Toneb
February 25, 2015 12:25 pm

Ian H said ……………
“OK – if they have the instruments to do this for CO2 then please hurry up and do it also for H2O. The H2O contribution needs to be going up at around 3 times or more the rate of the CO2 contribution if the positive feedback assumption (on which the whole CAGW edifice is constructed) is to be correct. If it isn’t then CAGW is a busted flush. They mention that separating out the contribution from water vapour was obviously a problem for them, so they must surely be able to measure it.”
Much more difficult to measure H2O increase as it varies enormously in time/space. indeed the measurements have to be taken in clear skies.
The paper does show radiosonde measurements though of H2O profile averages – showing an increase in lower tropospheric H2O, especially at the Alaska site in summer.
Remember we have a snapshot of just 2 locations for the globe here.
BTW: WV must increase if the temp is rising, such that the absolute humidity goes up while the rel humidity stays constant (given a water molecule’s stay of around 10 days in the atmosphere). The Earth’s surface is ~70% water and can’t help but evaporate to saturate any warming. It’s empirical physics.

A C Osborn
Reply to  Toneb
February 25, 2015 12:34 pm

Take a look at the Satellite CO2 data, it is not well mixed as advertised.

tty
Reply to  Toneb
February 25, 2015 1:42 pm

“WV must increase if the temp is rising, such that the absolute humidity goes up while the rel humidity stays constant (given a water molecule’s stay of around 10 days in the atmosphere).”
There is no physical law that says that rel, humiditry has to stay constant. And note that convective heat transport to the tropopause increases linearly with the amount of water evaporated.

mpainter
Reply to  tty
February 25, 2015 1:57 pm

tty:
Good point. More wv===>more convection ===>more cooling. Positive feedback is absurd. Increase wv, you simply increase cooling of the atmosphere. In fact, water vapor represents cooling of the surface.

george e. smith
Reply to  tty
February 25, 2015 2:35 pm

So what evidence do you have that some specific water molecule has stayed in the atmosphere for ten days.
Only Mother Gaia can read the serial numbers on water molecules to tell them apart, and she won’t tell us which is which.
Water vapor is a PERMANENT component of the earth’s atmosphere. In recorded history, there has never been a time with no water vapor in the atmosphere.
Well there was when Peter Humbug took them all out on his Play Station just to watch the planet fry.
Trouble is they all came back within three months.

1sky1
February 25, 2015 12:26 pm

It will be interesting to see what bona fide evidence they have for their grand claims. Meanwhile, mere eyeball correlation with little evident phase lag does not causation make.

ColA
February 25, 2015 12:29 pm

Weren’t there a couple of large volcanic eruptions between 2000 & 2010 and wouldn’t they show on the CO2 graph??

Berényi Péter
February 25, 2015 12:30 pm

Both series showed the same trend: atmospheric CO₂ emitted an increasing amount of infrared energy, to the tune of 0.2 Watts per square meter per decade. This increase is about ten percent of the trend from all sources of infrared energy such as clouds and water vapor.

Are they claiming that overall forcing increased at a rate of 2 W/m²/decade between 2000 and 2010? If they do, this claim is plainly contradicted by both OHC (Ocean Heat Content) and CERES satellite radiation flux measurements at ToA (Top of Atmosphere).

Reply to  Berényi Péter
February 25, 2015 1:46 pm

Not much increase in any alleged radiative imbalance at the TOA over the last 14+ years:comment image
Any upward trend to discern? (CERES, March 2000 – June 2014.)

RH
Reply to  Kristian
February 25, 2015 3:12 pm

“Any upward trend to discern?”
Sure, start the graph in 2001 and stop at the end of 2009 and you have a nice scary picture that ought to be worth some grant money.

A C Osborn
Reply to  Kristian
February 26, 2015 6:09 am

RH, there data has a nice rising trend in line with overall CO2 data, but the ceres data does nothing from 2001 to 2008 and then jumps up 1 Unit.
So the Atmosphere stores up there steady input and then sends it out in one package over 12 months. Really clever.

A C Osborn
Reply to  Kristian
February 26, 2015 6:11 am

Damn, wish they had either a spell checker or Edit facility.
For there please read their.

February 25, 2015 12:33 pm

Can some one do the math – what would the 0.22 watts per m^2 per decade equate to in terms of climate sensitivity , deg C per doubling ?
TIA

Alan McIntire
Reply to  Jeff L
February 25, 2015 1:08 pm

I just checked NOAA- atmospheric CO2 was 369.92 ppm in 2000, increased to 389.85 ppm in 2010- 10 years. the natualr log of 389,85/369.92 is about 0.052475.
The natural log of 2 is 0.693147.
.693147/0.052475 is 13.2 If CO2 continues to double at the 2000-2010 rate, It’ll take 13.2 decades for a doubling, at which point the wattage increase would be 0.02 watts/year * 132 years = 2.64 watts for a doubling of CO2, only about 2/3 the IPCC figure of 3.97 watts increase for a doubling of CO2..

Dawtgtomis
Reply to  Alan McIntire
February 25, 2015 3:09 pm

Dude! I’m sittin’ next to you next pop quiz!

Toneb
February 25, 2015 12:37 pm

Mike said………..
“The direct sunlight at the earth’s surface when the sun is at the zenith is about 1050 W/m2, but the total amount (direct and indirect from the atmosphere) hitting the ground is around 1120 W/m2″
So my take on their claim of “two-tenths of a Watt per square meter per decade” is the following equation:
MWRD= 0.2W/Decade=Noise
The measurements were made at night, at which time only back-radiated IR impinges the Earth’s surface.
The measurements are “spectral” and so can attribute the IR frequencies out to the molecules that are re-radiating them. A basic IR thermometer can do it for you.
Roy Spencer explains how…….
http://www.drroyspencer.com/2010/08/help-back-radiation-has-invaded-my-backyard/
There is nothing of “noise” at all here. If that were the case what do you say of satellites measuring planets and stars millions of light years away?

Alan McIntire
Reply to  Toneb
February 25, 2015 1:11 pm

To be picky, Alpha Centauri is only about 4.3 light years away, Sirius is 8 light years away, the super giant Betelgeuse about 300 light years away. The Andromeda Galaxy is about 2.5 million light years away, and satellites CANNOT detect individual stars at that distance, unless they’re supernovae.

Reply to  Alan McIntire
February 25, 2015 1:23 pm

From http://apod.nasa.gov/apod/ap150106.html
“What stars compose the Andromeda galaxy? To better understand, a group of researchers studied the nearby spiral by composing the largest image ever taken with the Hubble Space Telescope. The result, called the Panchromatic Hubble Andromeda Treasury (PHAT), involved thousands of observations, hundreds of fields, spanned about a third of the galaxy, and resolved over 100 million stars. “

CodeTech
Reply to  Alan McIntire
February 25, 2015 1:56 pm

Maybe that’s 100 million supernovae? 😉

george e. smith
Reply to  Alan McIntire
February 25, 2015 2:30 pm

I think relatively modest telescopes can resolve some stars in Andromeda.
Don’t know if I could with my Questar, but I suspect some serious photographers have tried.
I am pretty sure I have seen the Andromeda Galaxy with my naked eye, and that without being on top of some high mountain.

Alan McIntire
Reply to  Alan McIntire
February 25, 2015 2:47 pm

I spotted the Andromeda Galaxy with binoculars- it was a fuzzy blur. I later had the opportunity to see the galaxy through a friend’s Dobson telescope. Through the telescope it was a BIG fuzzy blur.

Reply to  Alan McIntire
February 25, 2015 5:09 pm

Leif says:
…a group of researchers studied the nearby spiral by composing the largest image ever taken with the Hubble Space Telescope…
This is the image of Andromeda. The bright stars around the image are actually stars in our own galaxy. They are bright because they’re close.
Amazing. Astonishing. And it’s only one of trillions of galaxies…

Janice Moore
Reply to  Alan McIntire
February 25, 2015 5:43 pm

Thanks for that video, D. B. . Now, THAT is incredible.

Joseph Murphy
Reply to  Alan McIntire
February 26, 2015 5:43 am

Hubble observed individual variable stars in Andromeda in the 1920’s enough to know what they were and roughly calculate their distance.

milodonharlani
Reply to  Alan McIntire
February 26, 2015 6:25 am

DB,
Hundreds of billions of galaxies, not trillions. Estimates used to range from 100 to 200 billion, but Hubble ST observations suggest that there might be as many as 500 billion.
But the number varies with time. In four billion years Andromeda & the Milky Way will merge. Later still the entire Local Group will combine.

Reply to  Toneb
February 25, 2015 2:35 pm

I think you have Btu/ft^2. The popular heat balances I have seen have annuals of about 342 W/m^2 ToA and 168 absorbed by surface, 390 surface radiation. 0.2 per decade or .02 per year. Yah, it’s still just noise.

Peta in Cumbria
February 25, 2015 12:45 pm

I’m struggling to see whats new here, haven’t all they’ve done is devise a complicated way of measuring the (change) in CO2 concentration in the atmsophere?
Likewise with neilszoo above, so what about a few watts per square metre? A cool object is not going to heat an object thats already warmer – entropy is not running backwards. The power level in my microwave oven is many thousands of watts per square metre, but a glass/ceramic/metal bowl containing anything other than water is not going to get warmed by it. Is this DWIR heating things via dielectric heating because if its not, it cannot do any heating.
Here’s a nit-pick hopefully for us all’s benefit but – As I was taught and came to understand, a ‘linear’ thing is something fully described by ‘an equation’ It matters not that said equation contains exponents, logs, powers to the power n (as per Stefans Law for example)- it is still linear.
Non linear things contain singularities, places where a division by zero is attempted and or the differential of the eqaution heads off to infinity. Such example might be the old joke about falling off a tall building or aeroplane i.e. its not the fall that kills you, its the sudden stop at the end of it, namely where your velocity goes from something to nothing in zero time.
To my knowledge, the only place where Mother Nature gets away with division by zero is at the event horizons of black holes. Folks, especially warmists who claim ‘coupled non-linear blah blahs’ control climate are like folks who claim to understand quantum mechanics, doing so only serves to demonstrate your complete non-understanding of the subject.

Reply to  Peta in Cumbria
February 25, 2015 1:27 pm

That is a different definition of linear.
Yes, by one definition of linear, you have a linear graph if the line is continuous with no singularities. When scientists are discussing the way to variables relate, “linear” means a straight line on regular graph paper and an equation of the form y = mx +c. If there is a logarithmic component, you will get a curve on normal graph paper. If the equation is of the type y = x^2 +b then you get a straight line on log scale graph paper.
It is also possible to have “higher-order polynomials,” which gets more complicated to pick out.

Bart
Reply to  ladylifegrows
March 1, 2015 12:24 pm

Actually, linear means y = mx, full stop. Strictly speaking, y = mx +c is affine, but such a map is often referred to as linear.
Anything which does not move in a straight line is nonlinear. Nonlinear functions are generally much harder to deal with than linear functions, but fortunately, nonlinear equations can often be linearized in a particular domain to a designated degree of accuracy.

Matthew R Marler
Reply to  Peta in Cumbria
February 25, 2015 8:17 pm

Peta in Cumbria: I’m struggling to see whats new here, haven’t all they’ve done is devise a complicated way of measuring the (change) in CO2 concentration in the atmsophere?
Say for the sake of argument that you accepted the basic GHG theory: extra CO2 absorbs extra LWIR, raises temperature of troposphere, and increases downward radiation of LWIR. For you, this would then be the first time that a measured increase of DWLWIR, which you assumed all along was there, had been reported. Two things are important about it:
1. It confirms a part of the hypothesized mechanism.
2. The increase is too small to cause much warming.
Basic problems are (a) there are only 2 locations that have been recorded, for what is supposed to be a global phenomenon, so more measurements are needed; (b) the time series record is short, being only about 10 years, in a system that is quite complex and likely chaotic.

February 25, 2015 12:46 pm

Dumb question, but how would weather (as in high/low pressure systems) affect those readings?

February 25, 2015 12:52 pm

“…“We measured radiation in the form of infrared energy. Then we controlled for other factors that would impact our measurements, such as a weather system moving through the area,” says Feldman…”

Infrared energy? Per second? Per minute? Per Hour? Totaled per day?
When comparing radiation over a time period is the CO2 also measured over the same time period and kept synchronous to the radiation measurements?
Was there any attempt to measure corresponding temperature impacts?
Why control for weather systems? Did they change the CO2 levels? Earth has many weather systems and all contribute directly to climate.
I smell fudge factors.

“…The result is two time-series from two very different locations. Each series spans from 2000 to the end of 2010, and includes 3300 measurements from Alaska and 8300 measurements from Oklahoma obtained on a near-daily basis…”

Did a polar bear eat one while the other got dumped on by cattle in 2010? So, in 2015, there is no attempt to update? A very strong Manniacal influence here.
What’s with the graph lines getting fatter over time? Is this stolen from the graph of Napolean’s Russian invasion or is there some reason for the asymmetrical lines? Which just happen to skew any ability to look for direct CO2 / IR correlations. Even fattened up, there is only general similarity to graph lines.

“…Both series showed the same trend: atmospheric CO2 emitted an increasing amount of infrared energy, to the tune of 0.2 Watts per square meter per decade. This increase is about ten percent of the trend from all sources of infrared energy such as clouds and water vapor…”

Trend? Just how do the researchers define trend?
Offhand, the eyeball effect shows an approximate max to max difference of .2 watts.
Again, was there any attempt to directly measure the effect of .2 watts back radiation on temperature? If not, why not!?

“…Based on an analysis of data from the National Oceanic and Atmospheric Administration’s CarbonTracker system, the scientists linked this upswing in CO2 -attributed radiative forcing to fossil fuel emissions and fires…”

Say what? Anal derived consensus party line assumptions mark this research as false!

“…The measurements also enabled the scientists to detect, for the first time, the influence of photosynthesis on the balance of energy at the surface. They found that CO2 -attributed radiative forcing dipped in the spring as flourishing photosynthetic activity pulled more of the greenhouse gas from the air…”

Again, Anal derived consensus party line assumptions mark this research as false!
Hopefully, the data collectors and the data will be open to analysis. Honest research could instigate some genuine findings; cough cough, after obtaining additional requisite observations and hopefully in more locations.
I am a technical lukewarmer; but getting 0.04% of a trace gas to be such a manifold radiation multiplier is a long reach in my mind.

Mr. Pettersen
February 25, 2015 1:02 pm

Why should any Dragonslayer care about this? Nobody denies ir radiation. Its the automatic asumption that this ir will be convertet to heat at the bottom of the atmosphere the slayers dont accept.
Anyhow an increase in co2 will not generate heat simply because co2 radiates in any direction and every co2 molecule will have at least 6 directions to radiate where at least 5 of them will not be back to earths surface!

whiten
Reply to  Mr. Pettersen
February 25, 2015 4:40 pm

You mean the RF phobic slayers…:-)
cheers

CMS
February 25, 2015 1:08 pm

The opening statement in the report, seems to be the reporter trying to make a statement unsupported by the source he sites, which seems de rigueur for many summaries for policy makers. From the reporter in promoting this article “The influence of atmospheric CO2 on the balance between incoming energy from the Sun and outgoing heat from the Earth (also called the planet’s energy balance) is well established. But this effect has not been experimentally confirmed outside the laboratory until now.”. From the abstract, “However, despite widespread scientific discussion and modelling of the climate impacts of well-mixed greenhouse gases, there is little direct observational evidence of the radiative impact of increasing atmospheric CO2” http://www.nature.com/nature/journal/vaop/ncurrent/full/nature14240.html

JZ
Reply to  CMS
February 26, 2015 1:04 pm

Nice “out of context quote” of a poorly written statement. Taken in the context of the sentence following, the sentence should read, “… “however, despite widespread scientific discussion and modelling of the climate impacts of well-mixed greenhouse gases, there has been here-to-fore little direct observational evidence of the radiative impact of increasing atmospheric CO2″ The verb “is” should have been changed to “has been here-to-fore” to be clearer in the intent of the sentence, i.e., that previously there was little in terms of direct observation. The following sentence says essentially “we now provide that evidence”, which puts the previous sentence in context.

Jeff P
February 25, 2015 1:08 pm

The press release says the study period ended in 2010. The graph ends in 2011. This is 2015. Does anyone know why the discrepancy in their two dates and why the results aren’t carrried forward to present time?

February 25, 2015 1:11 pm

Water vapor has 9 times the impact of CO2.
Development in Earth Science Volume 2, 2014 http://www.seipub.org/des 31
The Greenhouse Effect and the Infrared Radiative Structure of the Earth’s Atmosphere
Ferenc Mark Miskolczi
Geodetic and Geophysical Institute, Hungarian Academy of Sciences, Csatkai Endre u. 6-8, 9400 Sopron, Hungary
fmiskolczi@cox.net
“The stability and natural fluctuations of the global average surface temperature of the heterogeneous system are ultimately determined by the phase changes of water. Many authors have proposed a greenhouse effect due to anthropogenic carbon dioxide emissions. The present analysis shows that such an effect is impossible.”
“One of the most elusive problems of climate science is the correct handling of the radiative effects of the global average cloud cover. After decades of struggle with the cloud forcing parameter and other mixed physical quantities, the role of clouds in the climate system remains hidden.”
“In our view the greenhouse phenomenon, as it was postulated by J. Fourier (1824), estimated by S. Arrhenius (1906), first quantified by S. Manabe and R. Wetherald (1967), explained by R. Lindzen (2007), and endorsed by the National Academy of Science and the Royal Society (2014), simple does not exist.”

george e. smith
Reply to  nickreality65
February 25, 2015 2:19 pm

Clouds always make it cooler in the cloud shadow zone. I have never observed it to get warmer when a cloud passes between me and the sun; no exceptions.

Reply to  george e. smith
February 25, 2015 7:23 pm

Clouds keep the desert warm at night.

Aphan
Reply to  Joel O’Bryan
February 26, 2015 3:39 pm

No silly! Clouds are the atmosphere’s PILLOWS at night, it’s the CO2 “blanket” that keeps the desert warm at night.
/sarc

William Yarber
February 25, 2015 1:11 pm

Long before man produced any measurable amounts of CO2 from combustion, the CO2 centration in Earth’s atmosphere varied from ~ 200ppm to 7,000ppm. All of these fluctuations were natural, not man made. Analysis of ice cores from various locations around the globe tell us that Earth’s atmospheric CO2 concentrations always LAG changes in Earth’s “mean” temperature. This LAG is from 200 to 800 years when the “mean” is increasing and ~ 600 to 2,000 years when the “mean” is decreasing (ie: out of and in to ice ages).
The analysis shows it ALWAYS LAGS! Not 50%, not 75% but 100% of the time that Earth’s “mean” temperature changes. Yes, there is correlation, and yes, there is causality: CO2 concentrations increase when the Earth’s oceans warm and decrease slowly as Earth’s oceans cool. CO2 is not a forcing, it is a RESULTANT! Changes in Earth’s “mean” temperature CAUSE CO2 concentration changes! Thie entire theory that atmospheric CO2 concentration is a dominant forcing is totally bogus!!!! Just ask any engineer (process, electrical, etc) that understands process control. A parameter that lags the primary variable is not a driver, it is a resultant. It’s like saying that the speed of your car is the primary driver of your gas usage. No, you and the cars accelerator are what drives the flow rate of gas and that results in your cars speed, with impacts from drag, terrain, etc! You can do 60 mph coasting down a steep incline while your cars engine is in idle, using minimal gas. Gas usage drives car speed! Car speed is a resultant, not a primary driver.
Bill

Trick
Reply to  William Yarber
February 25, 2015 1:43 pm

Bill 1:11pm: “Earth’s atmospheric CO2 concentrations always LAG changes in Earth’s “mean” temperature….CO2 is not a forcing”
By Bill’s logic, the CO2 emitted by my gas furnace TODAY must then cause a temperature increase effective YESTERDAY. So to comply with Bill’s logic that CO2 increase always lags the temperature increase. Bill will want to rethink cause and effect in this example.

Janice Moore
Reply to  Trick
February 25, 2015 2:01 pm

Trick. You aren’t fooling anyone here but yourself.
CO2 has never been proven to be the cause of ANY temperature forcing in the system we call “earth.”

Aphan
Reply to  Trick
February 25, 2015 2:14 pm

Wow. Either you read backwards or write backwards, or just like exposing your incredible lack of logic, but you in no way used Bill’s logic accurately.
First-your house is not representative of Earth’s climate/atmospheric system.
Second-YOU are using the CO2 emitted by your furnace today as a retroactive forcing, and you’re quote clearly shows that Bill does not consider Co2 to be a forcing AT ALL.
Third-using YOUR logic, the CO2 that your gas furnace emits today, will cause the temperature in your house to increase TOMORROW.
And most importantly-Your gas furnace DOES NOT USE CO2 to heat your house! ROFL

Trick
Reply to  Trick
February 25, 2015 2:20 pm

Janice 2:01pm: That doesn’t change cause is still ALWAYS before effect in nature. So far as we know anyways, universe entropy ALWAYS increases. Relentlessly. There were some who proposed that universe entropy could be decreased by a black hole, but even that fell victim to the 2nd law.

Reply to  Trick
February 25, 2015 2:29 pm

Bin sniffin’ yo gas too much, hommie.

Trick
Reply to  Trick
February 25, 2015 2:36 pm

Aphan 2:14pm: First – My house is subject to the same basic physics as earth’s climate. Second – I commented on Bill rethinking cause and effect; CO2 forcing is more complex. Try to separate the points. Third – Doesn’t make any sense. Surely my furnace turning on causes a later effect in my house. Most importantly – let me clarify, my furnace uses nat. gas. which is primarily methane CH4.

Janice Moore
Reply to  Trick
February 25, 2015 3:13 pm

Trick: “CO2 forcing is more complex”
Truth: CO2 forcing outside a highly controlled laboratory setting has never been proven to exist.
That wasn’t for you, Trick. It’s so you don’t trick anyone else.

Trick
Reply to  Trick
February 25, 2015 3:49 pm

Janice 2:36pm: So….you admit CO2 forcing exists in a highly controlled lab. Curious – what truth allows you to then write CO2 forcing doesn’t exist outside?

richardscourtney
Reply to  Trick
February 25, 2015 10:57 pm

Trick
Janice Moore wrote saying to you

That wasn’t for you, Trick. It’s so you don’t trick anyone else.

and I write to refute some of your nonsense for the same reason she did and in support of her.
You say

Janice 2:36pm: So….you admit CO2 forcing exists in a highly controlled lab. Curious – what truth allows you to then write CO2 forcing doesn’t exist outside?

I answer your question as one of all the many rational people who understand the subject.
The answer to your question results from a basic scientific principle; viz. the Null Hypothesis.
The Null Hypothesis says it must be assumed a system has not experienced a change unless there is evidence of a change.
The Null Hypothesis is a fundamental scientific principle and forms the basis of all scientific understanding, investigation and interpretation. Indeed, it is the basic principle of experimental procedure where an input to a system is altered to discern a change: if the system is not observed to respond to the alteration then it has to be assumed the system did not respond to the alteration.
In the case of climate science there is a hypothesis that increased greenhouse gases (GHGs, notably CO2) in the air will increase global temperature. There are good reasons to suppose this hypothesis may be true, but the Null Hypothesis says it must be assumed the GHG changes have no effect unless and until increased GHGs are observed to increase global temperature. That is what the scientific method decrees. It does not matter how certain some people may be that the hypothesis is right because observation of reality (i.e. empiricism) trumps all opinions.
Please note that the Null Hypothesis is a hypothesis which exists to be refuted by empirical observation. It is a rejection of the scientific method to assert that one can “choose” any subjective Null Hypothesis one likes. There is only one Null Hypothesis: i.e. it has to be assumed a system has not changed unless it is observed that the system has changed.
However, deciding a method which would discern a change may require a detailed statistical specification.
In the case of global climate in the Holocene, no recent climate behaviours are observed to be unprecedented so the Null Hypothesis decrees that the climate system has not changed.
Importantly, an effect may be real but not overcome the Null Hypothesis because it is too trivial for the effect to be observable. Human activities have some effect on global temperature for several reasons. An example of an anthropogenic effect on global temperature is the urban heat island (UHI). Cities are warmer than the land around them, so cities cause some warming. But the temperature rise from cities is too small to be detected when averaged over the entire surface of the planet, although this global warming from cities can be estimated by measuring the warming of all cities and their areas.
Clearly, the Null Hypothesis decrees that UHI is not affecting global temperature although there are good reasons to think UHI has some effect. Similarly, it is very probable that AGW from GHG emissions are too trivial to have observable effects.
The feedbacks in the climate system are negative and, therefore, any effect of increased CO2 will be probably too small to discern because natural climate variability is much, much larger. This concurs with the empirically determined values of low climate sensitivity.
Empirical – n.b. not model-derived – determinations indicate climate sensitivity is less than 1.0°C for a doubling of atmospheric CO2 equivalent. This is indicated by the studies of
Idso from surface measurements
http://www.warwickhughes.com/papers/Idso_CR_1998.pdf
and Lindzen & Choi from ERBE satellite data
http://www.drroyspencer.com/Lindzen-and-Choi-GRL-2009.pdf
and Gregory from balloon radiosonde data
http://www.friendsofscience.org/assets/documents/OLR&NGF_June2011.pdf
Indeed, because climate sensitivity is less than 1.0°C for a doubling of CO2 equivalent, it is physically impossible for the man-made global warming to be large enough to be detected (just as the global warming from UHI is too small to be detected). If something exists but is too small to be detected then it only has an abstract existence; it does not have a discernible existence that has effects (observation of the effects would be its detection).
To date there are no discernible effects of AGW. Hence, the Null Hypothesis decrees that AGW does not affect global climate to a discernible degree. That is the ONLY scientific conclusion possible at present, and the finding reported in the above article does not change it.

Richard

Trick
Reply to  Trick
February 26, 2015 5:01 am

Richard 10:57pm: “..the Null Hypothesis says it must be assumed…Hence, the Null Hypothesis decrees..”
Richard – Your logic though verbose fails inherently. The null hypothesis isn’t useful at all to assume something then decree the something must exist. No, we need to use the full on scientific method here. My nat. gas furnace emitting CO2 today CANNOT affect temperatures yesterday.
“I write….in support of (Janice).”
So….Richard supports CO2 forcing exists in a highly controlled lab. Curious – what truth allows Richard to then support CO2 forcing doesn’t exist outside the lab?

Janice Moore
Reply to  Trick
February 26, 2015 7:43 am

@ Trick — Truth: The laboratory and the earth “system” differ vastly.
I didn’t bother to dignify your nonsense about that with a response, but, once again, NOT FOR YOU FOR THOSE YOU MAY FOOL, I write.
*******************
Thanks Richard! So glad that you are feeling well enough to write here. Trick will not understand (or, just to be a jerk, not admit he or she understands) the null hypothesis or anything else. Trick is obviously sick (or w1cked). No sane, decent, person would write as Trick does.
I’m going to just ignore him/her. Lol, I don’t think there is much danger of Trick fooling anyone anymore here.

richardscourtney
Reply to  Trick
February 26, 2015 9:37 am

Trick
You proclaim you have inadequate reading comprehension skill.
There is no lack of logic in my post which is not verbose.
Do try to read my post again again because you need to understand it if you are to overcome your prejudiced acceptance of the false AGW-scare.
Richard
PS
Onlookers may care to note that the anonymous troll posting as Trick does understand my post but has attempted to trash it because he/she/they have no answer to it.

richardscourtney
Reply to  Trick
February 26, 2015 9:39 am

Janice
Thankyou
Richard

Trick
Reply to  Trick
February 26, 2015 11:50 am

Richard 9:37am – Your post lacks application of the scientific method (as does Janice’ post) so the logic in it easily fails as you do not support your logic with science either inside the lab or outside the lab. The top post paper being discussed writes there is a “discernible” (RSC term) CO2 effect (just see the title – observational!). Your logic thus fails. To improve logic, just add the scientific method to your comments.
——
More for the brave:
“..you need to understand it if you are to overcome your prejudiced acceptance of the false AGW-scare.”
Huh? Where is that from, did you just make that up? No, I accept the scientific method logic which is evident in the abstract paper being discussed, not evident in your post.
See your own cite in Idso using science: “Although the evidence I have presented suggests that a doubling of the air’s CO2 content could raise Earth’s mean surface air temperature by only about 0.4°C, there are a number of reasons to question whether even this minor warming will ever occur.” No kidding. There are many forcing factors besides CO2, infinite time periods for observations, the paper being discussed top post is singularly CO2 forcing being observed with as much data as then available.
See L&C using science: “We instantaneously double CO2. This will cause the characteristic emission level to rise to a colder level with an associated diminution of outgoing longwave radiation (OLR)…The actual amount of warming associated with equilibration as well as the response time will depend on the climate feedbacks in the system.” No kidding.
Gregory calculated from test “radiosonde data from 1960 to date” using scientific method: “Climate sensitivity at doubled CO2 concentration was calculated to be 0.26C…..As global warming may be caused by factors unrelated to greenhouse gases” – no kidding.
Thus absent of science this RSC logic fails: “To date there are no discernible effects of AGW.”
Do you even read & comprehend your own ref.s? If so, use some clips to support your assertions so readers can easily verify context.

Bart
Reply to  Trick
March 1, 2015 12:33 pm

The chain of events was:
1) heat applied to fuel increases temperature of the fuel
2) fuel decomposes into molecules including CO2, further releasing energy and raising temperature
If your furnace operated by releasing CO2, and CO2 then increased your home temperature, you would have a point. It doesn’t, and you don’t. Even here, the initial temperature increase preceded the CO2 release.

Reply to  William Yarber
February 25, 2015 1:44 pm

I have looked at those ice core graphs, for whatever they are really worth. They show some correlation between alleged temperature and carbon dioxide level. Sometimes the alleged temperature is leading and sometimes the carbon dioxide is leading. More oten the CO2, but it is not 100%.
Since I do not know how the temperature was measured, I am skeptical of the whole thing.

mikewaite
Reply to  ladylifegrows
February 25, 2015 2:55 pm

The Vostok ice core plot is in the WUWT reference page with links to the Nature article which is freely accessible to the general public.
As William Yarber says there is an initial lag according to Petit et al , but the the temperature rise is then accelerated by the forcing effect of the CO2 released from the ocean . There are other studies from other cores on the Antarctic icedome showing similar characteristics , but your post allows me to ask an obvious and simple question which I have not seen discussed.
Why does the temp increase peak always stop at approx 2K above the benchmark temperature .
Is this because that is the point when no more CO2 is expelled from the oceans – but if so the quantity existing in the atmosphere should just continue the heating effect . Is that not one of the principal concerns of the AGW camp , that stopping the CO2 rise is not enough to prevent continued global warming. .

Reply to  William Yarber
February 26, 2015 8:20 am

Bill,
Two errors in your reasoning:
1. The CO2 levels in general lag the temperature changes with a variable amount of time over the past 800,000 years and even for the past 55 years for short time variations (seasons, El Niño, Pinatubo). But CO2 levels lead temperature since about 1850: at the current temperature the equilibrium CO2 level would be 290 ppmv, not 400 ppmv.
2. That temperature leads CO2 doesn’t exclude a small influence of CO2 on temperature, as long as the combined fortifying factor is less than 1, see following graph for CO2 and temperature with and without feedback from CO2 on temperature:
http://www.ferdinand-engelbeen.be/klimaat/klim_img/feedback.jpg
All what happens is that with a (small) feedback, temperature and CO2 and slightly higher. How much, that depends of the total factor. For the temperature-CO2 relationship, the influence of temperature on CO2 is modest: some 8 ppmv/°C and the influence of CO2 on temperature is very small: theoretically (based on absorption spectra) some 1°C/2xCO2, without feedbacks of other elements in nature.
Or an initial increase of 1°C in temperature would get to 1.03°C and the initial 290 ppmv would end around 298.3 ppmv instead of 298 ppmv if there was no feedback from CO2 on temperature.
That simply means that all stories that CO2 fortifies the initial increase in temperature and ultimately produces 30% of the warming during a deglaciation (Hansen, 2003) are exaggerated, except if you include huge feedbacks from water vapor etc., which are proven wrong…

whiten
Reply to  Ferdinand Engelbeen
February 26, 2015 9:18 pm

Ferdinand Engelbeen
February 26, 2015 at 8:20 am
But CO2 levels lead temperature since about 1850: at the current temperature the equilibrium CO2 level would be 290 ppmv, not 400 ppmv.
—————————-
Very wrong Ferd.
In the most extensive increment of the CO2 emissions period, the CO2 totally lags temp, does not follow or lead temps…….the latest period, the last 20 years, for not saying more.
Yes in the AGW handicap approach it seems like the CO2 has lead the temps for most of the time from 1850.
But when considering that the warming for that period especially at the first part of that period, is not due to CO2 emissions, and while also considering the previous warming period from LIA trought to 1850, then you clearly see that CO2 does not lead but actually follows temps for this period in question, and totally lags at the very moment that it should lead, contrary to what expected by AGWers.
Besides you have a problem that confuses you I think.
The 290 ppmv is not the CO2 equilibrium, is just the CO2 natural variation mean.
The CO2 equilibrium is the the amount of variation of CO2 per temp variation in a accordance with time length.
The lag means no equilibrium, regardless of the actual amount of CO2,. A lag at 290 ppmv meas no equilibrium at 290ppmv.
A transient climate, climate not in equilibrium means no CO2 equilibrium, no matter what amount of CO2.
Since the early stage of LIA till now we are in a Transient climate period, climate not in equilibrium, meaning that a reference to any actual CO2 amount as it being the equilibrium in accordance with temps is actually irrelevant for the period in question.
cheers

Trick
Reply to  William Yarber
February 26, 2015 8:46 am

Janice 7:43am: Physics principles are the same in the lab as outside the lab – that’s why science calls them principles.

richardscourtney
Reply to  Trick
February 27, 2015 12:18 am

Trick
Your response to Janice demonstrates that you really, really don’t understand science.
Principles are constant. Their effects vary with circumstances.
For example, addition of a cold material to a warmer material cools it.
So, add some ice-cream to a bowl and the bowl always gets colder.
But, add some ice-cream to a healthy child and the child’s temperature does not change.
Richard

richardscourtney
Reply to  William Yarber
February 27, 2015 12:12 am

Trick
You again proclaim your lack of reading comprehension skills.
My post at 9:37am is here. It is an explanation of a basic scientific principle and the application of the principle to the AGW hypothesis. But you write

Richard 9:37am – Your post lacks application of the scientific method (as does Janice’ post) so the logic in it easily fails as you do not support your logic with science either inside the lab or outside the lab.

That response is surreal. And it falsely claims I did not “support {my} logic with science either inside the lab or outside the lab” when I cited three different pieces of published research!
Then you add

The top post paper being discussed writes there is a “discernible” (RSC term) CO2 effect (just see the title – observational!). Your logic thus fails. To improve logic, just add the scientific method to your comments.

That is another demonstration that you cannot understand what you read.
My explanation says

In the case of global climate in the Holocene, no recent climate behaviours are observed to be unprecedented so the Null Hypothesis decrees that the climate system has not changed.

What is your evidence that the “effect” in the above article is unprecedented in the Holocene?
And my explanation uses the word “discernible” when it says

Indeed, because climate sensitivity is less than 1.0°C for a doubling of CO2 equivalent, it is physically impossible for the man-made global warming to be large enough to be detected (just as the global warming from UHI is too small to be detected). If something exists but is too small to be detected then it only has an abstract existence; it does not have a discernible existence that has effects (observation of the effects would be its detection).
To date there are no discernible effects of AGW. Hence, the Null Hypothesis decrees that AGW does not affect global climate to a discernible degree. That is the ONLY scientific conclusion possible at present, and the finding reported in the above article does not change it.

Clearly, the word “discernible” refers to “man-made global warming” and not radiative forcing. There was no global temperature trend discernible as being different from zero at 95% confidence (i.e. there was no discernible global warming or global cooling) over the period assessed in the above article. There cannot have been any effects of the global warming which did not exist.
In reality the AGW is purported to be an effect of the radiative forcing change which the above article claims to have detected. This is the opposite of your assertion that the radiative forcing change is an effect of AGW.
Trick, your inability to read is not any lack of logic and/or scientific prowess on my part.
And you contradict your self when you claim I did not “support {my} logic with science either inside the lab or outside the lab” when you say you don’t like the findings in my references although you clearly don’t understand them (no surprise there!) and assert no fault in them.
I commend all onlookers to read them especially the paper by Idso which is written with the clarity of Darwin so is comprehensible to anyone with reasonable intelligence. To aid that I remind that I wrote

Empirical – n.b. not model-derived – determinations indicate climate sensitivity is less than 1.0°C for a doubling of atmospheric CO2 equivalent. This is indicated by the studies of
Idso from surface measurements
http://www.warwickhughes.com/papers/Idso_CR_1998.pdf
and Lindzen & Choi from ERBE satellite data
http://www.drroyspencer.com/Lindzen-and-Choi-GRL-2009.pdf
and Gregory from balloon radiosonde data
http://www.friendsofscience.org/assets/documents/OLR&NGF_June2011.pdf

Richard

richardscourtney
Reply to  richardscourtney
February 27, 2015 12:42 am

Trick
This is a PS for onlookers.
The self contradiction in the recent post to me from Trick is a strong suggestion that the anonymous troll posting at Trick is more than one person.

One version of Trick claims I “do not support {my} logic with science either inside the lab or outside the lab”.
Another version of Trick reads and fails in attempt to find fault with the scientific research papers I linked in “support of {my} logic”.
The responses of both versions of Trick are collated to form the recent post to me from Trick.
Professional trolls obtain payments for providing disruptive posts and often consist of teams.
Richard

mickcrane
February 25, 2015 1:13 pm

I’m just addressing something that might be missing in these posts.
As soon as I remember I went ” Oh look at that, how beautiful is that ? ”
I look at the complexity of all the things around me and I went
” Oh look at that, how beautiful is that ? “

u.k.(us)
Reply to  mickcrane
February 25, 2015 2:32 pm

Light snow falling on a weather weary Chicagoan, but damn if it ain’t beautiful.

Janice Moore
Reply to  u.k.(us)
February 25, 2015 3:15 pm

Aw, U.K. — that’s the first happy thing I’ve seen you write in a long time. That’s great. Make some hot chocolate and toast and just….. smile.
#(:))

A C Osborn
February 25, 2015 1:14 pm

Some slightly different data here.
http://www.carbonbrief.org/blog/2015/02/new-study-directly-measures-greenhouse-effect-at-earths-surface/?utm_source=feedburner&utm_medium=feed&utm_campaign=Feed%3A+carbonbrief+%28The+Carbon+Brief%29
For instance there is reference to the IPCC AR5 report which this nicely matches.
How convenient.

Aphan
Reply to  A C Osborn
February 25, 2015 1:28 pm

From A C Osborn’s link-
“The study finds that rising carbon dioxide concentrations are responsible for emitting around 0.2 Watts per square metre (W/m2) of energy per decade. This is slightly below the global average of 0.27 W/m2 over the last decade estimated by the Intergovernmental Panel on Climate Change (IPCC) in its latest report.”
“This difference highlights how specific on-the-ground studies can be to their location, Prof Richard Allan, a climate scientist at the University of Reading, tells Carbon Brief:
“The results of the study are not applicable globally, since two relatively dry locations are considered. It is doubtful that a detectable signal would be present at the surface in the wet tropics where there is copious water vapour and cloud.”
So “around 0.2 W/m2″…means what? In the neighborhood? Close to? Kind of like? “Estimated by the IPCC”…estimates are not precise by definition.
Yet two “specific on the ground” locations at different latitudes produced the exact same results?

Doug Proctor
Reply to  Aphan
February 25, 2015 5:35 pm

So the CO2 effect is stronger in dry places. Which means the global effect is 《2.5W/m2 doubling from 280 ppm????

February 25, 2015 1:19 pm

http://jennifermarohasy.com/2013/12/agw-falsified-noaa-long-wave-radiation-data-incompatible-with-the-theory-of-anthropogenic-global-warming-2/
The news is CO2 has had zero warming effect on the climate and I can show through the data that this is indeed the case.
The above is one of many recent studies that shows the amounts out going long wave radiation from earth being emitted to space has increased. The exact opposite of what AGW theory predicts.
.
Next point is yes a greenhouse gas effect does exist but it does not govern the climate , rather the GHG effect is in response to the climate. A warmer climate causing a greater GHG effect and vice versa.
This can be shown to be true due to the fact CO2 always follows the temperature never leads it and secondly the warmer the oceans are the less CO2 they can hold.
Next the data of recent past temperature trends which I will send shows each warm period in the Holocene starting with the Holocene Optimum and going to the Minoan, Roman, Medieval ,to the Modern Warm Period has been cooler then the one that proceeded it and this despite lower CO2 concentrations during those earlier warmer periods.

richardscourtney
Reply to  Salvatore Del Prete
February 26, 2015 3:28 am

MikeB
Yes, you are right. Sorry.
But that does not affect my point; i.e. irrelevant trivia is a distraction.
Richard

Reply to  Salvatore Del Prete
February 25, 2015 9:04 pm

You should correct the graph, it should be Years before Present (1950 AD)

richardscourtney
Reply to  Phil.
February 25, 2015 11:24 pm

Phil.
Technically you are correct; i.e. “Present” should be cited as 1950 AD and not 2000 AD.
However, for the sake of onlookers who may not know, I write to point out that your pedantic nit pick does not affect the arguments (whatever they are worth) from Salvatore Del Prete. This is because the x-axis of the graph clearly states it ends at 1950, and the ice core data has a temporal resolution of ~80 years at best.
Richard

MikeB
Reply to  Phil.
February 26, 2015 2:16 am

Salvatore,
You do realise that this graph, like all ice-core graphs, says nothing about modern day temperatures?
Richard,
One of us needs to go to specsavers. The x-axis says nothing about 1950.

Reply to  Phil.
February 26, 2015 3:24 am

The last data point of that graph was from 1855.

richardscourtney
Reply to  Phil.
February 26, 2015 3:30 am

MikeB
My response to you is in the wrong place. It is here. Sorry.
Richard

Reply to  Salvatore Del Prete
February 26, 2015 6:10 pm

I find the very small variance of ~0.5°C in the most recent 700 years of that chart most unconvincing.

February 25, 2015 1:25 pm

Atmospheric absorption of IR from the surface does not an increase in temperature make, simply because “heat rises” in the troposphere. (That is how easy the real physics is.) It just falls “down” the temperature gradient (the temperature lapse rate of -6.5K/km), even as much of it is lost horizontally, to wind and “weather”–and it is that (stable) temperature gradient that predominates over all other climate variables, on the global scale. See my 2010 Venus/Earth temperatures comparison (which precisely confirmed the Standard Atmosphere, which in turn is based upon the stable temperature lapse rate as the fundamental, governing reality). “Radiative forcing” from the planetary surface is irrelevant, immaterial, and incompetent, on the global scale.

Trick
Reply to  harrydhuffman (@harrydhuffman)
February 25, 2015 3:02 pm

harry 1:25pm: “.which precisely confirmed the Standard Atmosphere..”
Earth standard atmosphere (avg. LR 6.5K/km) was determined by a committee vote.

AndyG55
Reply to  Trick
February 25, 2015 7:50 pm

“was determined by a committee vote”
So is the Earth’s temperature. !
A very stacked committee with one agenda.

February 25, 2015 1:30 pm

Climate alarmists contend that the degree of global warmth over the latter part of the 20th century, and continuing to the present day, was greater than it was at any other time over the past one to two millennia, because this contention helps support their claim that what they call the “unprecedented” temperatures of the past few decades were CO2-induced. Hence, they cannot stomach the thought that the Medieval Warm Period of a thousand years ago could have been just as warm as, or even warmer than, it has been recently, especially since there was so much less CO2 in the air a thousand years ago than there is now. Likewise, they are equally loath to admit that temperatures of the Roman Warm Period of two thousand years ago may also have rivaled, or exceeded, those of the recent past, since atmospheric CO2 concentrations at that time were also much lower than they are today. As a result, climate alarmists rarely even mention the Roman Warm Period, as they are happy to let sleeping dogs lie.
Finally the data shows quite clearly that from the Holocene Optimum to Present the overall temperature trend has been down punctuated with warm periods.
What is driving the climate is NOT CO2, but rather Milankovitch Cycles which have been driving the climate on a slow gradual cooling trend for the past 10,000 years or so, this gradual cooling trend being superimposed with periods of active solar activity from time to time such as the Medieval Warm Period or the recent Modern Warm period, causing brief warming counter trends.
The data shows quite clearly that this is the case ,but then again those who believe in AGW do not go by the data ,they make the data fit what they want to convey.
I will send another chart showing what has been happening during the Holocene.

Aphan
February 25, 2015 1:31 pm

Isn’t it a thermodynamic law that a warming object WILL increase the amount of it’s outgoing radiation to the 4th power of the temperature increase? The warmer something gets…the more energy it radiates…

Reply to  Aphan
February 25, 2015 2:04 pm

Also depends on emissivity. A black pipe will radiate more than an aluminum lagged pipe. Black wood burning stoves emit more heat than chrome plated ones. The amount of infrared back radiated from a clear night sky must be corrected for a low emissivity. Simply pointing a non-contact IR meter at the sky without correcting for emissivity is misleading .

george e. smith
Reply to  Aphan
February 25, 2015 2:14 pm

Actually, that has nothing at all to do with thermodynamics. It’s a radiation physics matter.

February 25, 2015 1:32 pm

comment image
I rest my case and made my points.
.

Pipedream
February 25, 2015 1:39 pm

These two sites are northern hemisphere only so its not possible to extrapolate to the whole planet. Would be interested to know why this hasn’t been extended to places like Antarctica and other southern hemisphere locations where there are already scientific weather stations.

February 25, 2015 1:42 pm

As I said elsewhere: As time went by the AGW advocates drove themselves into a frenzy. It is a sort of a verbal Tarantella.

mpainter
Reply to  vukcevic
February 25, 2015 2:18 pm

Thanx, Vuk, you have just identified the origins of the American dance known as the “swing”, first seen in the mid-forties.
If you like that sort of dance, check out some of the moves by ‘swing” dancers.

Gonzo
February 25, 2015 1:49 pm

Ok let me get this straight. According to Hansen et al and others the Earths energy imbalance is .85watts per sq mtr. Correct me if I’m off here. They seem to be saying that Co2 is responsible for less than 20% of the Earths energy imbalance. If that’s the case (and please correct me if I’m wrong) then I’m OK with this. That would mean Co2 has increased temps by .2C over the last 134 since “official” records began. Shocking!

Gonzo
February 25, 2015 1:50 pm

Oops that should be less than 25% and .25C of warming over 134yrs

Stephen Garland
February 25, 2015 1:54 pm

I wonder if they made the same weather pattern ‘correction’ every spring? I wonder if their weather pattern corrections were the same over time?

george e. smith
Reply to  Stephen Garland
February 25, 2015 2:08 pm

Well come on now; we all know that weather isn’t climate so you have to eliminate weather. Do enough data cherry picking, and pretty soon absolutely nothing at all happens.
That tends to happen when you average stuff.
Mother Gaia never averages anything.

Stephen Garland
Reply to  george e. smith
February 25, 2015 3:46 pm

I am not suggesting the corrections should be the same over time! I am wondering if their corrections were unbiased or appropriate. For example, was a correction made that was unique to spring, that produced a suggested association with reduced carbon dioxide (due to increased photosynthesis) and reduced forcing.

RWturner
February 25, 2015 1:59 pm

AHAH!!! Look everyone, they found the Earth’s long sought-after ideal and one true temperature. It was about 1999-2000 when their surface forcing was at zero!
Seriously though, those graph’s left axis should be labeled surface forcing anomaly compared to 2000, right?

RWturner
Reply to  RWturner
February 25, 2015 2:03 pm

Furthermore, outgoing thermal radiation SHOULDN’T be the same as incoming solar radiation, correct? Because of this little thing called photosynthesis that literally absorbs visible light in order to create molecular bonds.

Pat Kelly
February 25, 2015 2:04 pm

Actually, I’d be pretty disappointed if their data collection DID NOT SHOW a correlation between IR absorbance and CO2 concentrations. That would be grounds to rewrite physics texts.
However, the elephant in the room is not a singular aspect of the model construction, but rather the symphony of elements being woven together. How can a model be considered correct when the most prevalent GHG is not modeled adequately?
I appreciate the modeler’s problem though. How do you go about modeling a thunderstorm is such a large model?

February 25, 2015 2:08 pm

This only confirms an increase in energy received over a 10 year period in a specific location (if measurements are correct). It does not prove the reason for it. The CO2 connection is pure speculation.

masInt branch 4 C3I in is
February 25, 2015 2:08 pm

Even around Barrow, Alaska, there is a heat island effect.
http://scholarworks.umt.edu/cgi/viewcontent.cgi?article=1003&context=geography_pubs

masInt branch 4 C3I in is
Reply to  masInt branch 4 C3I in is
February 25, 2015 2:20 pm

The paper looks to be a statical analysis of spectroscopy without attention to wind field effects, UHI, or even a cursory review of prior literature (UHI) and station siting.
Nature no doubt accepted the publishing fee with a smile.

Reply to  masInt branch 4 C3I in is
February 25, 2015 2:26 pm

There is also a temperature dependency on the absorption and emission of radiation by CO2. (or any other IR sensitive gas)

February 25, 2015 2:24 pm

The final 3 paragraphs of their manuscript:

“The time series of CO2 surface forcing, derived from differencing AERI
measurements and counterfactual calculations at the SGP (Fig. 4a) and
spectrally integrating and converting to flux, shows clear and increasing
trends in radiative surface forcing and seasonal variability. The
least-squares trend in the long-term forcing is 0.2 (+/-0.06) Wm-2 per
decade and differs significantly (P lessthan 0.003) from zero. The seasonal
amplitude of the forcing is 0.1–0.2Wm-2, closely tracking the independently
assessed pattern in the average CO2 concentration in the
lowest 2 km of the atmosphere. The variation in the power spectral
density function of surface forcing with frequency (Fig. 4b) shows the
largest peak associated with springtime photosynthesis and autumn
respiration.
The time-series for NSA (Fig. 4c) also has a pronounced seasonal
cycle and secular trend. The range of CO2 surface forcing is similar to
that of SGP, although the higher frequency variability is much less
prominent. In addition, the time series of surface forcing at NSA shows
increasing variability in the latter part of the 11-year analysis record.
This variability results from increased numbers of samples and fewer
outages (when not all of the necessary data streams are available to
derive the CO2 forcing) at NSA from 2004 onwards. Nevertheless, the
least-squares trend in CO2 surface forcing at NSA is also 0.2 (+/-0.07) Wm-2
per decade, with a seasonal range of 0.1Wm22 and differs significantly
from zero (P lessthan 0.02).
Increasing atmosphericCO2 concentrations between 2000 and 2010
have led to increases in clear-sky surface radiative forcing of over
0.2Wm22 at mid- and high-latitudes. Fossil fuel emissions and fires
contributed substantially to the observed increase. The climate perturbation
from this surface forcing will be larger than the observed effect,
since it has been found that the water-vapour feedback enhances greenhouse
gas forcing at the surface by a factor of three and will increase,
largely owing to thermodynamic constraints. The evolving roles of
atmospheric constituents, including water vapour and CO2 (ref. 30), in
their radiative contributions to the surface energy balance can be tracked
with surface spectroscopic measurements from stand-alone (or networks
of) AERI instruments. If CO2 concentrations continue to increase at the
current mean annual rate of 2.1 ppm per year, these spectroscopic measurements
will continue to provide robust evidence of radiative perturbations
to the Earth’s surface energy budget due to anthropogenic climate
change, but mediated by annual variations in photosynthetic activity.
These perturbations will probably influence other energy fluxes and key
properties of the Earth’s surface and should be explored further.”

Clearly they used correlation to infer causation.
My thought is they might have found a similar R^2 values if they had plotted their surface forcing measurements with the solar 2000-2011 Umbral Intensity (as the upward sloping secular trend)
http://i62.tinypic.com/zn7l2o.jpg
and the Seasonal variations are being driven by the varying Polar Field strengths (N+S):
http://i62.tinypic.com/19c8g.jpg

Reply to  Joel O’Bryan
February 25, 2015 2:27 pm

note: the 2 solar data graphs above are courtesy of Dr Leif Svalgaard, Stanford Univ.

Reply to  Joel O’Bryan
February 25, 2015 2:39 pm

Here is their Figure 4.
http://i61.tinypic.com/15q5hyp.jpg

RWTurner
Reply to  Joel O’Bryan
February 25, 2015 3:36 pm

Do they explain why the forcing data changes so dramatically over time? Is it the data becoming more variable or is the thickness of the line the error? If it’s the error, why does the error increase?

Reply to  Joel O’Bryan
February 25, 2015 3:44 pm

RWTurner,
They hand waved-off the increasing variability with this statement (also above, their 2nd to last paragrahP:

“In addition, the time series of surface forcing at NSA shows
increasing variability in the latter part of the 11-year analysis record.
This variability results from increased numbers of samples and fewer
outages (when not all of the necessary data streams are available to
derive the CO2 forcing) at NSA from 2004 onwards.”

That explanation, in light of the obvious increasingly variability from 2004 to end-2010, seems to fall short to me when I eyeball the plots.

Matthew R Marler
Reply to  Joel O’Bryan
February 25, 2015 11:37 pm

Where do you find the full paper?

Reply to  Matthew R Marler
February 26, 2015 6:48 am

The nature.com website.

Matthew R Marler
Reply to  Matthew R Marler
February 26, 2015 10:54 am

Joel, thanks, but to me it was paywalled. I guess I’ll have to wait.

Bill Illis
February 25, 2015 2:27 pm

Somebody want to go in and check the data?
Here is the Southern Plains Radiation Centre.
http://www.arm.gov/sites/sgp
They have been here for many, many years and I am very surprised to see this new data suddenly appear. I’ve used some of this data from another site before and there may be a seasonal component of radiation but whether that is so directly tied to seasonal change in CO2 – I doubt it.

Reply to  Bill Illis
February 25, 2015 2:29 pm

I am curious why they just used the period 2000 to end-2010. Why not into 2012 or 2013?

Richard M
Reply to  Joel O’Bryan
February 25, 2015 5:21 pm

Probably because all the data doesn’t show the intended correlation. Here’s a previous paper by one of the same authors. Note the period is 1997-2011. It appears they cherry picked a subset to get the result they wanted.
Long-Term Trends in Downwelling Spectral Infrared Radiance over the U.S. Southern Great Plains
P. Jonathan Gero
“The AERI data record demonstrates that the downwelling infrared radiance is decreasing over this 14-yr period in the winter, summer, and autumn seasons but it is increasing in the spring”

Reply to  Joel O’Bryan
February 25, 2015 6:39 pm

I too strongly suspect they cherry-picked that time frame from their data set. Someone in their field needs to openly call them on it.

Reply to  Bill Illis
February 25, 2015 8:33 pm

Their Excel spreadsheet (in Excel 2010 .xlsx format) is available here:
http://www.nature.com/nature/journal/vaop/ncurrent/source_data/nature14240-f4.xlsx

Bill Illis
Reply to  Joel O’Bryan
February 26, 2015 5:21 am

I used the data supplied in the datafile (along with supplemented CO2 measurements from the Southern Plains Radiation Centre) to check whether 5.35 Ln(CO2) works here.
Well, it is very close (measured is a little lower than the theory).
Now the question is how much data selection is going on here. Downwelling Long-wave at Southern Plains is on the order of 325 W/m2 on average. How did they tease out a 0.2 W/m2 signal?
http://s9.postimg.org/recefss1b/CO2_Forcing_at_SPRC_Feldman_2014.png

Reply to  Joel O’Bryan
February 26, 2015 6:53 am

Bill,
Could you post the linear fit equations and R^2 numbers for those two lines, please. Thanks.
Joel

Bill Illis
Reply to  Joel O’Bryan
February 26, 2015 10:22 am

joelobryan
The measured forcing line would be about 4.46 ln(CO2curr/CO2orig) versus 5.35 in the theory.
I can’t give you an R^2 because there are different time/dates on the x axis between the datasets but it would be a fairly high number.

Bill Illis
Reply to  Joel O’Bryan
February 26, 2015 10:37 am

I don’t think it is possible to pull out a +/- 0.2 W/m2 signal from the data.
Here is one day’s radiation measurements from Table Mountain Colorado. +/- 0.2 W/m2 signal from that?
http://s18.postimg.org/s66p367ft/Table_Mountain_All.png

February 25, 2015 2:27 pm

The only thing the data shows at the top of this article is more CO2 will exert greater forcing.
The question it does not answer is what is the reason for the increase in CO2? The answer is the warmer climate. AGW has it back words.

whiten
Reply to  Salvatore Del Prete
February 26, 2015 9:54 pm

Salvatore Del Prete
February 25, 2015 at 2:27 pm
The question it does not answer is what is the reason for the increase in CO2?
————–
Maybe that is the way the climate and Atmosphere get at a cooling trend that it supposes to be. 🙂
cheers

Aphan
Reply to  whiten
February 27, 2015 1:15 pm

The error margins on the “estimates” given to all of the “natural” sources of carbon dioxide in the atmospheric cycle are so large that the “estimated” human contribution of CO2 to the atmosphere can easily fit within them multiple times. Meaning that ANY natural source can fluctuate a LOT and still fall within the error bands of their estimates and it makes their “estimate” of the human contribution meaningless.
If warmists insist that the oceans are heating up, and warming water out-gasses more CO2, then the increase in CO2 could be coming from the oceans.

Michael Jankowski
February 25, 2015 2:37 pm

I like how the forcing is zero or negative for about 375ppm CO2 and lower…

RWTurner
Reply to  Michael Jankowski
February 25, 2015 3:16 pm

I pointed this out earlier and no one responded. I think that is an anomaly compared to their starting date.

A C Osborn
Reply to  RWTurner
February 26, 2015 7:19 am

The average radiative forcings go down in 2002 from 0.033586957 in 2001 to 0.026244275 a drop of 0.007342682.
It also dropped in 2009 from 0.220432314 in 2008 to 0.213569405 a drop of 0.006862909.
So how does that happen with continuously increasing CO2 when everything else has supposedly been accounted for.

Timo Soren
February 25, 2015 2:40 pm

IF the baseline CO2 concentration is 300 with lambda =5.35 that results in approx 3K = 5.35Ln(2) on doubling to 600. However, if we are looking at their results as being accurate, then the 366 (2001) to 386 (2011) yields 1.064 W/m^2 and 1.384 W/m^2 or a increase of .32 W/m^2 over a decade. However, their paper indicates a gain of .2 W/m^2. This is approximately a 43% reduction in the standard model. In other words,
They have published, empirical evidence to show that their models need to be reduced by 43% to fit this data.

Alan McIntire
Reply to  Timo Soren
February 25, 2015 3:00 pm

Read the IPCC report agian.. that 5.35 * ln 2 gives a figure in WATTS, not degrees. That confusion has led to some wild predictions of global warming. 5.35* ln2 is about 3.7 watts, so my 3.97 watts mentiond earlier was too high.

Timo Soren
Reply to  Alan McIntire
February 25, 2015 3:14 pm

Ignore my equals, as the 3k come from the 5.35ln(2) calculation but the result is in w/m^2. The difference is still .12 W/m^2 or a 43% reduction.

Barry
February 25, 2015 2:48 pm

I’m not sure I would put stock in a single low anomaly from a clearly upward trend. Has anyone been paying attention to the PDO lately? If it flips, it could mean an end to any “hiatus” whatsoever.
http://margaret.atmos.washington.edu/pdo/PDO.latest

RH
Reply to  Barry
February 25, 2015 4:06 pm

The PDO was about as high as it gets for the end of 2014, and all we got was 6th warmest temps. The AMO, however, is primed to go negative. That should be good news for you. You don’t actually want the earth to heat in a catastrophic way, do you?
http://wattsupwiththat.com/2010/09/30/amopdo-temperature-variation-one-graph-says-it-all/

Barry
Reply to  RH
February 25, 2015 5:32 pm

Graph shows US temp only. I was referring to global temps. Also, PDO by its name is a decadal oscillation, and what matters is the cumulative heat released from the Pacific ocean to the atmosphere. And no, I don’t want the plant to warm catastrophically, but neither am I going to bury my head in the sand.

Reply to  RH
February 26, 2015 6:22 am

“You don’t actually want the earth to heat in a catastrophic way, do you?”
What I worry about is the potential for cooling and the impact it would have on world food supplies. The world has so many more people to feed now than during the cold dips of the last century or so.
Even a small dip in temperature could cause millions to suffer who could not afford the higher prices.

richardscourtney
Reply to  Barry
February 25, 2015 11:40 pm

Barry
You ask and say

I’m not sure I would put stock in a single low anomaly from a clearly upward trend. Has anyone been paying attention to the PDO lately? If it flips, it could mean an end to any “hiatus” whatsoever.

Bob Tisdale constantly monitors and reports on the PDO. I commend you to search for his articles on WUWT.
The current plateau of global temperature will certainly end sometime with the onset of either global cooling or global warming. You fail to say why you think the PDO is the only and/or major probable cause of the inevitable end to the current plateau of global temperature.
If pigs grow wings, it could mean an end to any non-flying pigs whatsoever. This, of course, has as much relevance to this thread as your post.
Richard

chili palmer
February 25, 2015 2:50 pm

Article says: “The measurements also enabled the scientists to detect, for the first time, the influence of photosynthesis on the balance of energy at the surface.”….PNAS study on CO2 v photosynthesis was published 10/13/14, “Impact of mesophyll diffusion on estimated global land CO2 fertilization.” They studied much larger time frame than above, 1901-2010, found 17% more CO2 was absorbed by photosynthesis than previously thought. Not sure if they observed No. America or whole planet. “Global carbon cycle models have not explicitly represented this internal drawdown and therefore overestimate CO2 available for carboxylation and underestimate photosynthetic responsiveness to atmospheric CO2.

RWTurner
Reply to  chili palmer
February 25, 2015 3:20 pm

And do they realize that primary producers derive their energy for growth from the sun, therefore upwelling radiation should be lower than downwelling radiation when photosythesis is occurring at the surface? Because it doesn’t appear that they realize this.

Stephen Wilde
February 25, 2015 2:55 pm

CO2 also allows more radiation to space from within the atmosphere than would have occurrred without it.
That radiation to space reduces the energy returning to the surface in adiabatic descent.
Have they thought to deduct that reduction in energy returning to the surface from any reduction in energy escaping from surface to space?
I suspect that if they had thought to attend to that aspect the net thermal effect from more CO2 for the atmosphere as a whole would be zero.

Richard M
Reply to  Stephen Wilde
February 25, 2015 5:36 pm

Exactly. Not only that, but when it gets warmer lower in the atmosphere this enhances convection which carries the energy (both CO2 absorbed and latent heat) higher which enhances its ability to radiate to space. It also wrings out more water vapor reducing that particular GHG at altitude which is critical to the overall energy balance.

February 25, 2015 2:58 pm

so lambda becomes ~ 3.34 (62.5% of 5.35). (62.5% comes from 0.2 / 0.32 = 0.625).

Reply to  Joel O’Bryan
February 25, 2015 3:07 pm

But this still begs the following questions:
1. If this increased radiative forcing occurred, why then did the Earth’s global temperature anomaly remain flat?
2. Why then did the Southern Ocean get colder and Antarctic sea ice levels begin rising so dramatically in the last 4 years (since 2010)?
The one obvious possibility is that natural variation and feed back trumps CO2 forcing.
But I also suspect, there is something in that date range they have used that doesn’t hold true after 2011.

RWTurner
Reply to  Joel O’Bryan
February 25, 2015 3:24 pm

Also, the forcing line on their plotted data becomes thicker with time, and I assume the thickness of the line is the error, so why is the possible error becoming greater with time?

Reply to  Joel O’Bryan
February 25, 2015 3:48 pm

RWTurner,
The thicker red line line (their surface forcing (IR) measurements) is clearly due to a denser data set (more data points per day) as they went along in time. Fewer outages would be their explanation.

Richard M
Reply to  Joel O’Bryan
February 25, 2015 5:38 pm

See this paper and all your questions will be answered.
http://journals.ametsoc.org/doi/abs/10.1175/2011JCLI4210.1?journalCode=clim
Long-Term Trends in Downwelling Spectral Infrared Radiance over the U.S. Southern Great Plains
P. Jonathan Gero
“The AERI data record demonstrates that the downwelling infrared radiance is decreasing over this 14-yr period in the winter, summer, and autumn seasons but it is increasing in the spring”

OldDoodleBugger
February 25, 2015 3:11 pm

Based on the authors’ Schematic (Extended Data Figure 1 at http://www.nature.com/nature/journal/vaop/ncurrent/fig_tab/nature14240_SF1.html) and Figure 4 (joelobryan comment at 1439), it appears that they have added together all the spectral responses (not just from CO2) in processing the data and making their interpretations and conclusions. A problem??

crosspatch
February 25, 2015 3:50 pm

I’m not particularly surprised at the results. The problem all along has been the claimed feedbacks that would make warming “catastrophic” that don’t seem to be happening in real life.

Joe Crawford
Reply to  crosspatch
February 25, 2015 4:01 pm

Crosspatch,
Apparently they have the data for H2O forcing that would permit them to to verify the feedback assumption. I would think that if it did verify they would have included it in the paper. So, my assumption is that either it did not or they must have another paper currently in submission. I guess wee will know shortly.

crosspatch
Reply to  Joe Crawford
February 25, 2015 4:05 pm

We all ready know the feedback assumption is bad. In a century we have seen about 1 degree of warming. SOME of that is due to land use changes, SOME of that is due to natural variability, SOME of that is due to CO2. We also know that we saw a nearly identical period of warming in duration and magnitude from 1910 to 1940 as from 1975 to 2005 when CO2 emissions could not possibly have been a factor. We can simply tell from the data that the feedback is not happening.

Reply to  Joe Crawford
February 25, 2015 5:48 pm

Here is their SGP and NSA site collected T and H2O vertical profiles from radiosonde data.
Trends in the thermodynamic state at SGP and NSA
http://i60.tinypic.com/nx9f1d.jpg
This is what they wrote about it:

“The radiosonde-derived annually averaged least-squared trend in the clear-sky temperature profile at SGP showed an increase in spring in the lowest 2 km of the atmosphere, but decreases elsewhere. Lower-atmosphere water concentrations showed trends of opposite sign depending on season and altitude. At NSA, annually averaged clear-sky temperature profile trends were positive in the lower troposphere except in spring. Lower-tropospheric humidity also increased at NSA, except in the autumn. It is important to note that these thermodynamic trends are based on clear-sky conditions only and are distinct from all-sky trends.”

Here is their calculated forcing data for the GHGs.
Vertical sensitivity
http://i58.tinypic.com/333bn1v.jpg
http://i60.tinypic.com/2rogr9c.jpg
Where they comment:

“Using LBLRTM (note: that is their radiative transfer model), we calculated the vertical sensitivity of broadband longwave surface forcing due to perturbations in the atmospheric state profile. These calculations were based on model atmospheres, including the US standard, the tropical, the mid-latitude summer, the mid-latitude winter, the sub-Arctic summer, and the sub-Arctic winter atmospheres, which span a broad range of atmospheric thermodynamic states46. We separately perturbed the temperature by 1°K, 1% water vapour, 10 ppm CO2, 10% O3, and 1 ppm CH4 profiles for a 1-km-thick layer of the atmosphere from the surface to 20 km. Results are shown in Extended Data Fig. 9 and indicate that, with the exception of O3, contributions to surface forcing are dominated by the bottom 5 km of the atmosphere, regardless of the thermodynamic state. O3 perturbations have a more complicated vertical structure because O3 is partially transparent in the troposphere and its concentration peaks in the stratosphere, meaning that upper-level O3 concentration perturbations at the 10% level can have a modest impact on the surface energy balance.

Joe Crawford
Reply to  Joe Crawford
February 26, 2015 1:20 pm

Thanks for the info Joel. It is going to take me a bit of time to digest it.

Joe Crawford
February 25, 2015 3:56 pm

I haven’t read the paper so I cannot comment on the results. However, I do hope they explained the negative clipping on the forcing on the ‘Southern Great Plains’ graph in the spring of 2007 and summer & fall of 20019. Without a full explanation of the cause I would have trouble accepting any of their forcing data as valid.

Alx
February 25, 2015 3:57 pm

Well I think the mistake they made was sampling Oklahoma and Alaska. This only allows them to extrapolate for the North American continent. If they has used Alaska and Australia they could have extrapolated for the entire globe.
I am sure they will fix this in their next iteration, but are currently sidetracked with trying to extrapolate 2 used flashlight batteries into a nuclear reactor.

Janice Moore
Reply to  Alx
February 25, 2015 4:13 pm

LOL.

Reply to  Janice Moore
February 25, 2015 5:23 pm

LOL X2
Yeah, remember how the US is only 2% of the globe and the Medieval Warm Period was localized to Europe and Greenland – once upon a time in fairyland ?

Reply to  Alx
February 25, 2015 4:13 pm

Alx,
Probably same result if they’d done Australia. My feeling is: “It’s the sun, stupid (that is, insolation at TOA). Always has been always will be.”
The big Climate science news for 2015 will likely come from OCO-2.
First to fall will possibly be the commonly held belief that atmospheric CO2 is well-mixed:
http://i61.tinypic.com/2ducrq9.jpg
After that, OCO-2 data on the seasonal variations in global natural sinks and sources will make the anthropogenic CO2 contribution even less consequential, thus its impact as the source of the overall rising trend untenable.

Reply to  Joel O’Bryan
February 26, 2015 8:32 am

Joel, have a look at the scale: +/- 8 ppmv. That is +/- 2% of full scale CO2.
The seasonal in/out is 20% of all CO2 in the atmosphere within months. If the resulting measurements show only a 2% change, then CO2 changes are rapidly mixed in…

February 25, 2015 4:14 pm

That’s a nice study, but it looks like as of Feb. 25th 2015, 48 out of 50 US states have some snow:
http://www.natice.noaa.gov/pub/ims/ims_gif/DATA/cursnow_usa.gif
[But Hawaii has snow on top of its volcanic mountains on the Big Island. .mod]

Latitude
Reply to  J. Philip Peterson
February 25, 2015 6:01 pm

I have no snow…and it’s 78F 😀

Reply to  J. Philip Peterson
February 25, 2015 9:45 pm

Oops, OK – 49 out of 50. Failed to check on Hawaii…

William Astley
February 25, 2015 4:42 pm

I would expect there should be an increase in spectral down radiation from CO2 molecules due to the increase in atmospheric CO2, I question however the magnitude of the increase in spectral down radiation, in this recent calculation.
There are multiple observations and analysis results that support the assertion that for some physical reason the increase in forcing due to the increase in atmospheric CO2 is less than theoretically estimated and that the planet resists rather than amplifies forcing changes.
We know for example that there has been no increase in planetary temperature for 18 years. We know also that there has been almost no tropical region warming. Those observational facts limit the amount of CO2 forcing and/or require smart mechanisms that exactly hide the warming.
There are other analysis results that directly supports the assertion that the amount of forcing due the increase in atmospheric CO2 is small not large.
http://proceedings.spiedigitallibrary.org/proceeding.aspx?articleid=1690262

A decade of measured greenhouse forcings from AIRS
Increased greenhouse gasses reduce the transmission of Outgoing Longwave Radiation (OLR) to space along spectral absorption lines eventually causing the Earth’s temperature to rise in order to preserve energy equilibrium. This greenhouse forcing effect can be directly observed in the Outgoing Longwave Spectra (OLS) from space-borne infrared instruments with sufficiently high resolving power 3, 8.
Decadal trends for AIRS spectra from 2002-2012 indicate continued decrease of -0.06 K/yr in the trend of CO2 BT (700cm-1 and 2250cm-1), a decrease of -0.04 K/yr of O3 BT (1050 cm-1), and a decrease of -0.03 K/yr of the CH4 BT (1300cm-1). Observed decreases in BT trends are expected due to ten years of increased greenhouse gasses even though global surface temperatures have not risen substantially over the last decade.

Ralph Kramden
February 25, 2015 4:49 pm

The research also provides further confirmation that the calculations used in today’s climate models are on track when it comes to representing the impact of CO2
I disagree with this statement. Only a small fraction of the warming predicted by climate models is attributed to the greenhouse effect of CO2. Most of the predicted warming is attributed to forcings and this research does nothing to confirm the forcings used in the climate models.

Doug Proctor
February 25, 2015 5:23 pm

22 ppm rise for 0.2 W/m2 power equivalence. That is 2.5 W/m2 for doubling CO2 from 280 ppm. Does this field measurement include water vapor?
Really not sure what this means wrt CAGW models. And how it ties to the hiatus. Gives natural variation a +/- 0.2W/m2 limit?

jorgekafkazar
February 25, 2015 5:39 pm

Two points to describe/quantify/confirm global warming? I think not.

Richard M
February 25, 2015 5:41 pm

Although I linked to this paper elsewhere I think it is critical. The full data appears to be from 1997-2011. Why did they cherry pick 2000-2010?
http://journals.ametsoc.org/doi/abs/10.1175/2011JCLI4210.1?journalCode=clim
“The AERI data record demonstrates that the downwelling infrared radiance is decreasing over this 14-yr period in the winter, summer, and autumn seasons but it is increasing in the spring”

Matthew R Marler
Reply to  Richard M
February 25, 2015 11:33 pm

Richard M: http://journals.ametsoc.org/doi/abs/10.1175/2011JCLI4210.1?journalCode=clim
Thank you for the link. Surprisingly, it isn’t paywalled.

Reply to  Richard M
February 25, 2015 11:55 pm

Yep, I remember this one. Seems to be the same location as the Oklahoma site used in the current study. This one’s much more interesting, actually. Shows you exactly how dependent such measurements are of specific local conditions. These studies, then, can’t really tell us anything about global trends.
Cheers 🙂

Reply to  Richard M
February 26, 2015 1:05 am

Although the AERI record extends from 1995 to the present, temporally resolved
estimates of the CO2 concentration profiles from CT201120, which were necessary
for validation of the radiative transfer model (see below), were only available
beginning in 2000 and extending through 2010, resulting in an analysis period
of 11 years. Overall, the AERI is a very robust instrument that inherently produces
continuous, reliable operational data. Quality control for the spectra was achieved
by ensuring that valid sky spectra were being observed by the instrument with the
hatch open, and that unphysical radiance values, anomalously low variances in
brightness temperature across the infrared window band (800–1,200 cm21
) and
scenes with substantial variability in the view of the hot blackbody were removed

Richard M
Reply to  Steven Mosher
February 26, 2015 5:58 am

The problem is 2000 is at the depth of a La Nina and 2010 is the peak of a El Nino. The US is quite sensitive to ENSO. I suspect this is the entire reason for the trend. All trends are sensitive to end points.

Chris
Reply to  Steven Mosher
February 26, 2015 7:18 pm

“The problem is 2000 is at the depth of a La Nina and 2010 is the peak of a El Nino. The US is quite sensitive to ENSO. I suspect this is the entire reason for the trend. All trends are sensitive to end points.”
If you look at the graph during the middle years (away from the end points) – say 2004-2007, the slope is still positive and steady, with each successive year showing higher CO2 and forcing than the prior year.

KevinK
February 25, 2015 6:03 pm

From the press release;
“The influence of atmospheric CO2 on the balance between incoming energy from the Sun and outgoing heat from the Earth (also called the planet’s energy balance) is well established.”
It is a well established hypothesis, but all alleged “energy budgets” prepared from actual measurements yield uncertainty values as much as ten times larger than the alleged imbalance. The alleged imbalance when proper uncertainty is acknowledged is anywhere from -15 to +15 mW/sq m. It could be exactly zero when averaged over time.
Again from the press release;
“But this effect has not been experimentally confirmed outside the laboratory until now.”
COMPLETE HOGWASH.
This experiment measured the correlation between the amount of CO2 and the flux intensity of the back radiation. Nothing else, it does not even mention any correlation to “rising temperatures” anywhere in the data in the press release because there ain’t any rising temperatures.
This experiment is simply a careful measurement of back radiation, so what. Back radiation is like “back emf”, or “back pressure” nothing more.
The ceiling in my residence (8 feet above my head and 3 feet below ~0 degree F outside air) is currently back radiating at me from its temperature of about 65F. That back radiation DOES NOT ADD extra energy above that which was provided by my furnace. The insulation between the ceiling and the outside air does slow the velocity of heat travelling from 65F inside to 0F outside. This extends the time it takes for the energy added to my interior spaces by my furnace to escape to the outside spaces. It does not “retard” the transmission of energy.
CO2 and other “greenhouse gases” do not “retard” the flow of IR energy though the system. They simply delay the total travel time of the energy through the system by milliseconds.
If you put an energized light bulb inside an optical integrating sphere (hollow sphere with a highly diffuse/reflective interior and an “exit port”, the “high tech” version of wrapping a light bulb with tin foil)) it will emit energy towards the interior of the sphere. This energy will be “reflected” (like absorption and re-emission without a time delay) back towards the light bulb. But it does not add to the energy leaving the light bulb. You can measure this back radiation with a radiometer (nobody does because it is useless information). And if you increase the reflectance of the interior of the sphere this measured flux increases (just like the measurements in this experiment), but it does not add energy to the system.
There is a well known error source (self absorption) present when you do this that looks (to untrained practitioners) like the “back radiation” is making the light bulb brighter. But in fact this back radiation is simply changing the efficiency/efficacy of the filament and the power supply (as a interacting system) allowing more photons to be emitted with the same number of electrons. This error source has been turned on its head to become the “radiative greenhouse effect”. In optical engineering we know to consider this error in our calculations, in climate science they think they have discovered an “effect”.
How many decades of rising CO2 and no rising temperatures will it take before folks take a few steps back from the blackboard, scratch their head a few times and think; “holy cow there does not seem to be ANY evidence of the “GHE” in ANY of the temperature data” ???
Cheers, KevinK

Pamela Gray
February 25, 2015 6:21 pm

This seems like a very tight piece of research. Which means that replication is possible using other locations and at other times. If the results are different what we have is a lack of robust results. If the results are the same it would be useful to discuss, “So what?”. There are lots of interesting things that happen on Earth that just don’t matter in the long run in terms of natural variation. In other words, the result can be minutely measured by instruments, but cannot be detected by someone standing at the same spot the instrument is sitting on.

Matthew R Marler
Reply to  Pamela Gray
February 25, 2015 8:30 pm

Pamela Gray: This seems like a very tight piece of research. Which means that replication is possible using other locations and at other times.
That’s my thought as well. Now that it has been done, and gotten a resulting interesting to all but a few (I think), it will be repeated.

Reply to  Pamela Gray
February 26, 2015 5:41 pm

I agree. It would be nice if sites such as Boston were selected.

Arno Arrak
February 25, 2015 6:26 pm

Let’s try not to get all exited about Hansen’s claim of detecting the greenhouse effect in 1988. He absolutely did not prove that greenhouse warming exists. As “evidence” of having observed it he presented a hundred year long warming curve, a third of which turned out to be not greenhouse warming at all but part natural warming and part cooling. This nullified his claim to having observed the greenhouse effect but IPCC nevertheless used his claim as proof of the existence of AGW. These Berkeley people will have to stand on their own feet and not try to use Hansen’s claim to support their cause.

February 25, 2015 6:35 pm

Who the heck cares? Fourier discovered CO2 is a greenhouse gas in 1824 and Tyndall figured out CO2 absorbs LWIR in the 1850’s, if I recall my history correctly…
The forcing effect of CO2 per doubling is the logarithmic equation of 5.35*ln(560ppm/280ppm)=3.7 watts/M^2. Again, who cares???
This teeny tiny amount of forcing only has the GROSS potential of increasing global temps by 1.2C, and once NEGATIVE feedbacks are accounted for, the NET amount of CO2 forcing is perhaps around 0.05~0.6C by 2100, which is almost an order of magnitude LESS than the stupid CAGW hypothesis projects.
Since 1850, which marked the end of the LITTLE ICE AGE, the Earth has managed to RECOVER about 0.8C (likely less given all the temp data fiddling) of warming, of which CO2 perhaps contributed 0.2C. Since the forcing effect of CO2 is logarithmic, by 2100, perhaps CO2 will contribute another 0.3~0.4C of CO2 induce warming, plus or MINUS whatever the SUN decides to do.
Global temps could well be LOWER than now by 2100 if the Sun continues its weak phase, so any CO2 warming effect may well be a NET benefit–oh, the irony…. Moreover doubling CO2 will increase crop yields and forest growth by 50%, which is a fantastic benefit.
CAGW is dead. The only thing that’s rapidly rising in the field of climatology is IPCC’s-disgraced ex-chairman Pachauri’s legal fees, required to keep him out of jail for sexual harassment charges…
CAGW is a bunch of scoundrels chasing skirts and government grants. It’s a disgrace that need to end.

John
February 25, 2015 6:40 pm

The alleged increase of 22 parts per million is a percentage, which happens to be .0022%.
An increase of 22 thousandths of a percent is not very dramatic, and will do little to convince anyone that the anthropogenic contribution is little more than an anecdotal side note
Lies…Damned Lies…and more Statistics.

Chris
Reply to  John
February 26, 2015 7:57 am

No, an increase of 22 ppm is not .0022%. An increase in CO2 from 378 ppm to 400ppm is an increase of 22 above a starting point of 378. That’s an increase of 22/378 = 5.8%

trafamadore
February 25, 2015 6:52 pm

Wow. So impressive. Over two hundred comments and hardly one recognizing the importance of this paper if it pans out.
A direct measurement of forcing, one that falls right in the middle of the theoretical calculations that we have been using for the last 20 years.
This paper, like Mann’s hockey stick paper, is transformative in that it will illimiate a really big bunch of wrong ideas (called hypothesis, if you are interested).
So maybe you should read the paper before saying dumb things?

Gerald Machnee
February 25, 2015 6:53 pm

**“We see, for the first time in the field, the amplification of the greenhouse effect because there’s more CO2 in the atmosphere to absorb what the Earth emits in response to incoming solar radiation,” says Daniel Feldman, a scientist in Berkeley Lab’s Earth Sciences Division and lead author of the Nature paper.**
To me it sounds like they measured something and it is because there is more CO2. Does not sound like they measured only CO2.

DavidinNYC
February 25, 2015 7:05 pm

I’m waiting for Mosher to show up and lecture us on the settled physics of line by line radiative codes that showed without any doubt that the effect of doubling co2 is 3.71 watts / m2. And anyone that disagreed was a ‘foolish’ skeptic that was outside the conversation.
And lo and behold we have some experimental evidence that the value might in fact be less than 2 watts / m2 if we double co2 to 800 ppm.
This number if shown to be correct completely blows the CAGW argument out of the water even under the most agressive feedback scenario.
If this whole thing was anything but a political power grab the fat lady would be singing and the houselights would be going down.

Reply to  DavidinNYC
February 26, 2015 12:46 am

read the paper.

February 25, 2015 7:05 pm

0.2 w/m2/decade
Assuming an average surface temperature of 15 C = 288K
Plugging into Stefan-Boltzmann Law
P(w/m2)=5.67*10^-8*T^4
Arrives at a temperature increase of 0.037 degrees per decade
Even assuming a linear response, which would be foolish, that’s only 0.37 degrees per century
Even assuming water vapour feedback TRIPLES the effect, that’s only about 1 degree per century.
But, the earth isn’t average so running the same math:
at -30 C + .2 w/m2/decade = 0.06 degrees/decade
at +30 C + .2 w/m2/decade = 0.032 degrees/decade
I’m good with this result. Embrace it. It debunks the alarmism nicely.
On the other hand there is something interesting in the last few years of the graph. CO2 continues to rise, but forcing actually FALLS. Look at the peak in 2011 vs 2010 and 2009. There are other things at play here that are affecting downward IR, else the peaks would continue upward rise with Co2, even if more poorly correlated, but they wouldn’t go DOWN. Regardless what this shows is that surface forcing is so minute that the impact on temperature can barely be measured at all.

Reply to  davidmhoffer
February 25, 2015 7:36 pm

They very clearly truncated their data set at end-2010 to show the effect they needed to be published by the AGW gatekeepers at Nature mag. Had they shown through-2013 data, the decreasing measured IR would have made a mockery of any claim on CO2 forcing. It is clear from the whole SGP data set available that downwelling IR fell significantly from 2011 onward.
The author (first author D.R. Feldman, Lawrence Berkeley National Laboratory, Earth Sciences Division, 1 Cyclotron Road, MS 74R-316C, Berkeley, California 94720, USA. D.R.F. implemented the study design, performed the analysis of all measurements from the ARM sites, and wrote the manuscript.) of the paper at Berkeley cherry-picked the end date to give the desired result.

Reply to  Joel O’Bryan
February 26, 2015 1:04 am

“Although the AERI record extends from 1995 to the present, temporally resolved
estimates of the CO2 concentration profiles from CT201120, which were necessary
for validation of the radiative transfer model (see below), were only available
beginning in 2000 and extending through 2010, resulting in an analysis period
of 11 years. Overall, the AERI is a very robust instrument that inherently produces
continuous, reliable operational data. Quality control for the spectra was achieved
by ensuring that valid sky spectra were being observed by the instrument with the
hatch open, and that unphysical radiance values, anomalously low variances in
brightness temperature across the infrared window band (800–1,200 cm21
) and
scenes with substantial variability in the view of the hot blackbody were removed

Richard M
Reply to  Joel O’Bryan
February 26, 2015 6:06 am

Mosh …. it doesn’t change the fact the study starts at the depths of a La Nina and ends at the peak of a strong El Nino. Why didn’t they wait until they had the profiles to publish complete data? I suspect they really didn’t want them as that would invalidate the wanted results.

Matthew R Marler
Reply to  davidmhoffer
February 25, 2015 7:50 pm

davidmhoffer: I’m good with this result. Embrace it. It debunks the alarmism nicely.
Good for lukewarmers, and likely to be welcomed by all of them, I should think.

Reply to  Matthew R Marler
February 25, 2015 9:06 pm

Yeah, it still keeps the notion that climate sensitivity is something above 0.00 alive …
… for a while longer

Konrad.
Reply to  Matthew R Marler
February 26, 2015 1:37 am

Philincalifornia,
not for too much longer 😉
This study really just detects CO2 in a new way. It tells you nothing about the role of radiative gases in our radiatively cooled atmosphere, nor its effect on near surface temps. The idea of an atmosphereic radiative GHE remains a flawed assumption.
But the Lukewarmers at WUWT clutching at this study tells us plenty. Lukewarmers are now the most desperate to have the AGW hypothesis accepted. The AGW true believers are shameless, they will just move on to the next hoax. And they will get away with it. The Lukewarmers will let them.
Both alarmists and lukewarmers are now working to the same goal “warming, but far less than we thought because blah, blah, blah”. And both groups motivation is now identical. Escaping the shame of saying our radiatively cooled atmosphere was heating the planet.

Reply to  Matthew R Marler
February 26, 2015 2:02 pm

Konrad please don’t spite your allies against CAGW. I am one of those lukewarmers.

Reply to  davidmhoffer
February 28, 2015 7:15 pm

https://www.facebook.com/photo.php?fbid=10203896333144707&set=pcb.10203896335264760&type=1
I’m trying to get my calcs (done in Math Cad) published here. I get more like .7 degrees per century. I think the “emissivity” I use has something to do with that. None the less, the same magnitude as you have Dave.
My conclusion: NONE PROBLEM! This is wonderful work if correct.

Reply to  davidmhoffer
March 1, 2015 4:30 pm

Dave: Look down and find my most recent post. A good, tight analytical work with the calculations all laid out. I think you and I only are off by the emissivity coef. we used.

AJB
February 25, 2015 7:08 pm

So in summary, they’ve upended a couple of spectrometers and measured the seasonal ups and downs of aggregate IR detected at particular frequencies emanating from one side of a turbulent gas mixture, of varying composition with suspended liquids and solids, irradiated from both sides over a varying pressure gradient. Great, diffusion confusion is alive and well.
Where are the magic stationary point sources the spectrometers are pointing at that allows them to draw the conclusions listed?
Energy diffusion by all forms of transfer is integrated and operates in three dimensions simultaneously. You cannot do two-dimensional aggregate spectroscopy like this and expect it to tell you the net effect of changing composition on surface temperature or measure net energy throughput of the entire atmosphere. It makes no sense.
All that this shows is that the CO2 composition has changed. We knew that already.

clipe
February 25, 2015 7:10 pm
Ralph Kramden
February 25, 2015 7:23 pm

I don’t have a real feeling for Watts / M2 – Decade so I did a quick estimate of what is that in temperature rise.
Given (approximate values):
E = 0.2 W/M2
A = 5.10X10^14 M2 = surface area of the earth
Cp = 0.28 W-Hr/Kg-C = specific heat of air
M = 5.15X10^18 Kg = mass of the atmosphere
C = 8760 Hrs / Year = time conversion factor
dT = E * A * C / Cp / M = 0.62 C / Yr
But the temperature data don’t show an increase of anything like this.
Something is wrong here.
Could someone check this?

Arno Arrak
February 25, 2015 7:29 pm

I quote Anthony:
“…The influence of atmospheric CO2 on the balance between incoming energy from the Sun and outgoing heat from the Earth (also called the planet’s energy balance) is well established.”
Nonsense. CO2 has no influence on the energy balance of the earth. If it did we would be subject to uncontrollable temperature swings, even runaway greenhouse effect. From geologic history we know that there never has been a runaway greenhouse effect on earth despite much higher past levels of CO2. . Hansen has threatened us with a runaway greenhouse effect like the one on Venus if we keep burning fossil fuels. This is one more aspect of the greenhouse effect that he gets dead wrong.

Chris
Reply to  Arno Arrak
February 26, 2015 8:02 am

“CO2 is responsible for 80% of the radiative forcing that sustains the earth’s greenhouse effect.” So CO2 does influence the energy balance of the earth.
http://www.nasa.gov/topics/earth/features/co2-temperature.html

milodonharlani
Reply to  Chris
February 26, 2015 8:18 am

Chris,
CACA is GISS´rice bowl. Of course their GIGO model found a disproportionate role for CO2.
Their “experiment” was worse than worthless garbage. In the real world, the GHE of CO2 is negligible, as shown by past ice ages under CO2 concentrations far higher than now, with solar radiance only slightly lower than now.
Even when the strength of the sun was about the same as now, a mere 40 to 55 Ma (less than half a percent weaker), there was no runaway, catastrophic global warming, despite CO2 levels up to ten times higher than now.
Pearson, P. N., 2010: Increased Atmospheric CO2 During the Middle Eocene. Science, 330, 763-764.
(Maybe too many acronyms.)

RWturner
Reply to  Chris
February 26, 2015 8:45 am

They also claim that Earth’s temperature can only remain stable if the outgoing radiation equals the incoming radiation, which is absurdly false.

Chris
Reply to  Chris
February 26, 2015 8:01 pm

Milo,
I went into your paper. Here is a line from the summary paragraph: “On page 819 of this issue, Bijl et al. (1) provide the first direct evidence that very high CO2 levels occurred about 40 million years ago during the Middle Eocene Climatic Optimum (MECO), one of the hottest intervals in Earth’s climate history.”
A bit more detail from the abstract: “Organic molecular paleothermometry indicates a warming of southwest Pacific sea surface temperatures (SSTs) by 3° to 6°C. Reconstructions of pCO2 indicate a concomitant increase by a factor of 2 to 3. The marked consistency between SST and pCO2 trends during the MECO suggests that elevated pCO2 played a major role in global warming during the MECO.”
Thanks for providing me with this, it’s further confirmation of the link between CO2 and temperature!

TomRude
February 25, 2015 7:31 pm

So during the pause the CO2 created more trapping of energy, that is Global warming… Great way to demonstrate cliamte and CO2 are disconnected. Thanks guys!

mkuske
February 25, 2015 7:33 pm

So what happens between 2009 and 2012? There’s a pretty obvious visual downward trend while CO2 was presumably still rising.

clipe
February 25, 2015 7:40 pm

date: Mon, 12 Feb 2007 12:41:57 -0800
from: “Peter H. Gleick”
subject: Integrity of Science testimony at Senate Hearing
to: ???@pacinst.org
Dear Friend and Colleague,
In case you missed it, I submitted written testimony at last Wednesday’s Senate Commerce
Committee
hearing on climate change and the integrity of science:
[1]http://www.pacinst.org/press_center/press_releases/20070207.html.
Follow the links on that page to the actual testimony.
Sincerely,
Peter Gleick
Dr. Peter H. Gleick
MacArthur Fellow
President
Pacific Institute for Studies in Development, Environment, and Security
654 13th Street
Oakland, California 94612
510 251-1600 phone
510 251-2203 fax
20 Years of Research for People and the Planet: 1987-2007
[2]www.worldwater.org (World Water site)
[3]www.pacinst.org (Pacific Institute site)
?</b?
It's an upside down world we live in.

Matthew R Marler
February 25, 2015 7:44 pm

Both series showed the same trend: atmospheric CO2 emitted an increasing amount of infrared energy, to the tune of 0.2 Watts per square meter per decade.
That’s a good start. In no time at all such instrumentation will be established all over the surface of the Earth to confirm or deny or moderate their estimate. Notice that a simple projection (obviously not reliable from such a short series), works out to 2 W/m^2 per century, way below what is forecast for a doubling of CO2 concentration over such a time span. So everyone will be motivated to improve upon this result.

February 25, 2015 7:44 pm

The claim that “the results agree with theoretical predictions” is false. Global warming models do not make predictions. They make “projections.” Predictions are made be scientific models. Projections are made by pseudo-scientific models.

Reply to  Terry Oldberg
February 26, 2015 12:49 am

wrong. they are not talking about climate models
“In principle, CO2 forcing can be predicted from knowledge of the
atmospheric state assuming exact spectroscopy and accurate radiative
transfer. Forcing can then be estimated using radiative transfer calculations
with atmospheric temperature, the concentrations of radiatively
active constituents including water vapour, O3, CH4, N2O, and less prominent
well-mixed greenhouse gases, and changes in CO2. However,
experimental validation of this forcing is needed outside the laboratory
because CO2 spectroscopy is an area of active research10–13. Furthermore,
the fast radiative-transfer algorithms that drive regional and global climate
models approximate spectroscopic absorption line-by-line calculations
with errors of about 0.6 W m22 (ref. 14), an amount comparable
to the forcing by anthropogenic CH4 and N2O.”

Reply to  Steven Mosher
February 26, 2015 7:58 am

I have only been able to read the first page of the study online. But it appears they modeled, rather than measured in situ, CO2 concentrations to get a 22 ppm estimated increase for both locations. This assumption may not be warranted given what we know about actual mixing of the atmosphere, particularly in the general vicinity of two major centers of oil and gas production.
However, the instruments were capable of detecting wavelengths specifically related to CO2. So is there sufficient precision (and accuracy) in these measurements to support the paper’s conclusion (which to a large extent hinges on the exact increase in local CO2 concentrations over time)?

Ralph Kramden
February 25, 2015 7:54 pm

Can I have a do over? E is W/M2-Decade not W/M2
I don’t have a real feeling for Watts / M2 – Decade so I did a quick estimate of what is that in temperature rise.
Given (approximate values):
E = 0.2 W/M2-Decade
A = 5.10X10^14 M2 = surface area of the earth
Cp = 0.28 W/Hr-Kg-C = specific heat of air
M = 5.15X10^18 Kg = mass of the atmosphere
C = 87600 Hrs / Decade = time conversion factor
dT = E * A / C / Cp / M = 0.81X10^-10 C
Could someone check this?
If this is correct I can see why it took so long to detect it, it’s minuscule.
Reply

MikeB
Reply to  Ralph Kramden
February 26, 2015 2:34 am

Ralph,
This is very ambitious, well attempted, but it’s not the way to do it.
The way to do it is given in the 1st IPCC report.
In its simplest form the equation reduces to, surface temperature(dT) =dF/3.3
So a change in forcing of 2 W/square metre would give a temperature change of 0.6 deg. C in the no-feedback case.

Ralph Kramden
Reply to  MikeB
February 26, 2015 5:06 am

Thanks MikeB, I misread the report and blew it. I get dT=dF/3.1 which is pretty close to the IPCC number.
I’ll go with the IPCC on this one.

Ralph Kramden
Reply to  Ralph Kramden
February 26, 2015 4:55 am

Ralph Kramden Feb 25 at 7:54 is incorrect, I miss read the report.
My apologies.

kuhnkat
February 25, 2015 8:08 pm

The fact that they can detect emission of IR from CO2 says NOTHING about how much warming may or may not be occurring.
This is a total waste of bits and bytes.
You getting worried about ending up on the investigations list Anthony??
HAHAHAHAHAHAHAHAHAHAHAHAHAHAHAHAHAHAHAHAHA

Konrad.
Reply to  kuhnkat
February 26, 2015 1:25 am

“The fact that they can detect emission of IR from CO2 says NOTHING about how much warming may or may not be occurring.”
Bingo!
All they have done is find a new IR detection method. This tells them nothing about the effect of our radiatively cooled atmosphere on the solar heated surface of our planet.
The idea that adding radiative gases to our radiatively cooled atmosphere reduces it’s ability to cool our solar heated oceans remains as inane an idea as it ever was.

R. de Haan
February 25, 2015 8:44 pm

Just for the fun of kicking the entire Co2 discussion into an entire different direction (and to express the fact that I am tired and board by the endless recycling of this subject I provide you with the link that deals with a quite relevant question made by Chiefio: Is weahter change on the planets in sync earth?
https://chiefio.wordpress.com/2015/02/25/weather-change-on-planets-in-sync-with-earth/
Have a nice day.

February 25, 2015 9:32 pm

Even the 15 micron band which would be the CO2 sweet spot is overlapped by water absorption. It is simply impossible to separate photons emitted by one molecule from the other. In the words of Thomas Jefferson, “A rude, stinking pile.”

Reply to  gymnosperm
February 26, 2015 5:25 am

Nonsense, it’s called spectroscopy!
Here’s a comparison of the spectra:
http://i302.photobucket.com/albums/nn107/Sprintstar400/H2OCO2.gif

A C Osborn
Reply to  Phil.
February 26, 2015 7:59 am

Would you mind overlaying the spectra and power of the outgoing LIR coming from the surface on those 2 graphs?

Reply to  Phil.
February 26, 2015 9:01 am

Pretty flat around 0.15W/m^2.sr.cm^-1

Reply to  Phil.
March 9, 2015 7:41 pm

Hi Phil, it’s weird I was replying on WUWT and some kind of infarction happened and it was “sorry we can’t post this comment”. Anyway, my point was that within the same wave number it is impossible to distinguish the photons. I had an email conversation with Daniel Feldman posted further down the thread where he explained that their separation approach was to use the linear vs exponential pressure broadening pattern to distinguish CO2 photons. It is not clear to me that this is a valid approach and he did not respond further.

don penman
February 25, 2015 10:09 pm

I agree with the aim of the the experiment and Co2 must have some effect on surface temperature but I am not sure that this study is accurate,I would like to see more studies and know when they took the measurements if the figures given are average 24 hour values or max/min values.

February 25, 2015 10:11 pm

The results agree with theoretical predictions of the greenhouse effect due to human activity. The research also provides further confhttp://wattsupwiththat.com/2015/02/25/almost-30-years-after-hansens-1988-alarm-on-global-warming-a-claim-of-confirmation-on-co2-forcing/#comment-form-load-service:Twitterirmation that the calculations used in today’s climate models are on track when it comes to representing the impact of CO2.
They appear to be correct. Theory is 3.7 w/m2 per doubling (natural log function)
ftp://aftp.cmdl.noaa.gov/products/trends/co2/co2_annmean_mlo.txt
2000 = 369.5 ppm
2010 = 389.9 ppm
Quick calc I get 0.199 w/m2
So that justifies their position on the models getting CO2 forcing right. They just leave out from their statement that the models are still wrong because of a host of other factors. Sort of like getting 5% on a 20 question test and pointing out that well, you got the first question right, just ignore the rest of the test.

Reply to  davidmhoffer
February 25, 2015 10:14 pm

I have NO idea where most of that text in the first paragraph comes from. I hate computers. They always do exactly what I tell them to, it takes me forever to figure out what it is I told them and how I did it.

Reply to  davidmhoffer
February 25, 2015 11:10 pm

AND I got the math wrong.
F=5.35*ln(c2/c1)
F= 0.29 w/m2
OK, so now I confused. Don’t know how computers work and I don’t know how they use this measurement to justify saying that the models get the physics right.
Oh wait, that’s the formula for RF (radiative forcing) which IPCC AR4 said was not equal to SF (surface forcing). I don’t feel like grubbing through AR4 trying to find the exact section, but I do recall them saying that SF would be less than RF.

February 25, 2015 10:29 pm

“The influence of atmospheric CO2 on the balance between incoming energy from the Sun and outgoing heat from the Earth (also called the planet’s energy balance) is well established.” What complete nonsense. Look at Trenberth’s diagram and weep for physics.

Richard111
February 26, 2015 12:34 am

I’m not a scientist so maybe someone out there can explain my woolly thinking. If you make an IR source that only radiates over the 15 micron band (okay, 13 to 17 microns), and direct this radiation at a blackbody, I claim the blackbody CANNOT warm up above -30C over any timescale longer than the initial warm up time.

Reply to  Richard111
February 26, 2015 12:51 am

I’m not a scientist ,,,,, I claim the blackbody CANNOT warm up above -30C over any timescale longer than the initial warm up time.
lovin it

Konrad.
Reply to  Steven Mosher
February 26, 2015 1:47 am

Lovin’ it were we Mosh?
Are our oceans a “near blackbody” or an extreme SW selective surface? Care to hazard an answer my petulant little warmulonian.
Be a shame if all of climastrology were based on the inane assumption that our SW translucent, IR opaque oceans were a “near blackbody” now wouldn’t it? That would mean the net effect of our radiatively cooled atmosphere was actually surface cooling not warming.
Say Mosh, Nice socialist UN you got there. Be a shame if something happened to it…

MikeB
Reply to  Richard111
February 26, 2015 2:39 am

Where did you get that figure from Richard, just out of interest? And what does “any timescale longer than the initial warm up time” mean, just out of bemusement?
(The final temperature achieved will, of course, depend on the intensity of the source)

Richard111
Reply to  MikeB
February 26, 2015 5:23 am

MikeB, Wien’s Law tells us there is a peak emission level for any given temperature. Also a large blackbody cannot heat up a smaller blackbody above it’s own emission temperature.

MikeB
Reply to  MikeB
February 26, 2015 6:22 am

Richard, what you say now is right, but your earlier conclusion doesn’t follow.
The peak emission only tells you the wavelength where most radiation will be emitted. It doesn’t tell you how much. This is unlimited; it only depends on the power of the emitting source.
The blackbody will absorb all the radiation falling on it (this is what blackbodies do). Its temperature will rise until it emits as much power as it is receiving. If it receives, say, 100 watts at wavelengths around 15 micron then it will emit 100 watts, but the emission will be spread over all wavelengths in a Planck distribution (this is what blackbodies do).
The steady state temperature, when the body emits as much as it receives, depends entirely on how much power it receives. The final temperature is given by the Stephan-Boltzmann Law which states that power emitted is proportional to the 4th power of temperature.
P = 5.67 * 10⁻⁸ * T⁴
….so I can get any temperature, just by increasing P

Reply to  Richard111
February 26, 2015 5:39 am

I suggest you go back to the books, I can use a mid-IR source at 10.6 microns to cut steel!

Brandon Gates
Reply to  Phil.
February 26, 2015 8:43 am

That’s impossible. Everyone knows steel is IR opaque.

KevinK
Reply to  Phil.
February 26, 2015 4:38 pm

Yes a mid-IR LASER source at 10.6 microns can cut steel. Might want to check a book about lasers. They do not behave as a blackbody source, undergraduate level knowledge my boy.

Brandon Gates
Reply to  Phil.
February 26, 2015 9:25 pm

KevinK,
Heat a large piece of plate steel up to just below glowing and stand two meters away from it. Despite being opaque to IR, you will get plenty warm when all those non-coherent photons strike your clothing and skin.

Reply to  Phil.
February 28, 2015 6:16 am

KevinK February 26, 2015 at 4:38 pm
Yes a mid-IR LASER source at 10.6 microns can cut steel. Might want to check a book about lasers. They do not behave as a blackbody source,

Having run a laser lab for thirty years I don’t need a book kid!
In the post that I responded to where do you find a blackbody source referred to?
” If you make an IR source that only radiates over the 15 micron band (okay, 13 to 17 microns), and direct this radiation at a blackbody, I claim the blackbody CANNOT warm up above -30C over any timescale longer than the initial warm up time.
Clearly ‘an IR source that only radiates over the 15 micron band’ is not a bb source.
So Richard’s premise is incorrect.

AndyG55
February 26, 2015 12:58 am

Notice that the so-called “forcing” does not match the RSS/UAH temperatures values.
Natural variation FAR FAR out-weighs ANY pseudo-warming effect of CO2

February 26, 2015 12:59 am

for people who hope that the data will be made availble..
here is a hint.
Read the abstract first.
Then skip the paper and goto methods
The methodology for this investigation focused on analysing time series of downwelling
infrared spectra to determine the effects of CO2 on these measurements
and thereby to estimate its surface radiative forcing. The analysis also used temporally
coincident measurements of atmospheric temperature and water vapour,
retrievals of cloud occurrence, and assimilation estimates of CO2 to construct
simulated counterfactual measurements where CO2 is held fixed.
Code and data availability. The measurement data sets used for this analysis are
freely available through the ARM data repository (http://www.arm.gov). The radiative
transfer codes are also freely available at http://rtweb.aer.com. CarbonTracker
results were provided by NOAA/ESRL (http://carbontracker.noaa.gov). CarbonTrackerCH4
results were provided by NOAA/ESRL (http://www.esrl.noaa.gov/gmd/ccgg/
carbontracker-ch4/). The MERRA data used in this analysis are freely available
for download at ftp://goldsmr3.sci.gsfc.nasa.gov/data/s4pa/MERRA/MAI3CPASM.
5.2.0/. The Broadband Heating Rate Profile (BBHRP) data files, used to assess fairweather
bias, are freely available on the ARM BBHRP web page at http://www.arm.
gov/data/eval/24 under http://dx.doi.org/10.5439/1163296 for the time-varying data
stream and http://dx.doi.org/10.5439/1163285 for the fixed CO2 data stream. The
computer routines used in this analysis will be made available upon request.

A C Osborn
Reply to  Steven Mosher
February 26, 2015 8:04 am

Mosher CO2 went up in 2002, the Radiative forcing went down.
CO2 went up in 2009, the Radiative forcing went down.
Falsified. 2 out of 10 years 20% went DOWN while CO2 went UP.

A C Osborn
Reply to  A C Osborn
February 26, 2015 8:05 am

To be precise the annual Average Radiative Forcing went down.

Matthew R Marler
Reply to  Steven Mosher
February 26, 2015 11:07 am

Thank you for the details.
Are you not impressed by the small size of the increase in DWLWIR in that time span? Is there anyone who predicted both that it would increase AND that the increase would be so slight?

Reply to  Steven Mosher
February 26, 2015 11:43 am

Anthony asked about the data. I found it in two seconds.

AndyG55
February 26, 2015 1:00 am

OK, sorry about the double similar post, I expected the post to appear at the bottom, but its a few posts up.
Something is stuffed up .

steverichards1984
February 26, 2015 1:19 am

The nature preview is here: http://www.nature.com/nature/journal/vaop/ncurrent/full/nature14240.html
Unfortunately the physical equipment is not listed nor its accuracy.
The statistical uncertainties are here:
The time series both show statistically significant trends of 0.2 W m−2 per decade (with respective uncertainties of ±0.06 W m−2 per decade and ±0.07 W m−2 per decade) and have seasonal ranges of 0.1–0.2 W m−2.
It is interesting that while this upwards force in temperatures has been measured’ the measured temperature has flat lined…..

A C Osborn
Reply to  steverichards1984
February 26, 2015 8:08 am

They have used the Actual downward changes in annual average forcings as their Uncertainties.

Science Counts
February 26, 2015 2:05 am

The authors exhibit lack of understanding basic physics and have become victims of the BIG BLUFF, as described by Professor Claes Johnson here:
http://claesjohnson.blogspot.nl/2015/02/klimatupplysningen-2-big-dlrback.html
While it is possible to measure the presence of a down-welling electromagnetic wave spectrum, energy transfer from the (colder) atmosphere to the (warmer) surface is not possible. “Back radiation” does therefore not exist.

Reply to  Science Counts
February 26, 2015 8:11 am

Accepted explanation is that increasing CO2 slightly raises the effective radiative altitude where an IR photon becomes likely to radiate to space. Because of the adiabatic lapse rate, this means that emission occurs at a lower T. This shifts the surface T higher to maintain energy flux equilibrium.

Brandon Gates
Reply to  Science Counts
February 26, 2015 9:04 am

Science Counts,

… energy transfer from the (colder) atmosphere to the (warmer) surface is not possible …

You exhibit a lack of understanding basic physics. Net flux will always be in the direction of the cooler body. So long as the cooler body is above absolute zero it can, and will, transfer energy to the warmer body, it will simply do so at a lower rate than the warmer one until such time as thermal equilibrium is achieved.
Were it not so, you would feel just as toasty warm standing outside in a New England blizzard stark naked as you would bundled up in a hat, parka and heavy gloves. For that matter, you would not feel warmer going back inside to your 26° C living room, a temperature which would feel especially toasty after a brisk -10° C winter day even though your core body temperature is a comparatively whopping 37° C.
The warmer living room reduces the rate of heat loss from your body surface relative to the much cooler outside winter environment. So it is with downwelling LWR, which IS “back radiation”, and it does exist as you yourself note — it’s possible to measure it.

Pethefin
February 26, 2015 2:12 am

Has anyone found out why they attribute the observed trend to the changes in CO2? I hope it Is not due to them being unable to think of “any other explanation” than the hypothesis/theory that they were supposed to test.

AndyG55
February 26, 2015 2:32 am

Poor Mosh,
All this tiny forcing , yet the global and tropospheric temperature is dead flat, and the minor deviations don’t match these so-called forcings at all.
Must be very hard for you to keep up the salesman act !!
But do keep trying, your employment depends on it, and its funny to watch. 🙂

Chris
Reply to  AndyG55
February 26, 2015 8:09 am

Let’s see, on the “AGW is happening” side we have the vast majority of national governments, the same for scientific organizations, the same for large companies, and even the same for the oil majors (Exxon, Shell, BP). I very much doubt Mosh’ job is at risk.

Reply to  Chris
February 26, 2015 8:18 am

Massive levels of green energy, carbon trades, and science funding and reputations are at risk if Gaia doesn’t bend to the consensus science. Not to mention the environmentalists who oppose economic development of any kind that requires a hole to be dug, or a tree to be cut.
Richard Feynman called that malpractice “pseudoscience.”

Chris
Reply to  Chris
February 26, 2015 9:17 am

Yes, and if Gaia does “bend to the consensus science”, massive levels of funding in the fossil fuel industry are at risk.

AndyG55
Reply to  Chris
February 26, 2015 11:56 am

“I very much doubt Mosh’ job is at risk.”
its just that he is a woeful salesman.
Plenty of Dodgy Bros car yards about though.

Espen
February 26, 2015 3:10 am

The lack of trend after 2007 is puzzling!

Reply to  Espen
February 26, 2015 8:30 am

Your observation of their plotted data is correct.
It’s called cherry picking to confirm the hypothesis.
The AERI data to 2014 shows a decreasing forcing trend (measured downwelling IR). Meanwhile pCO2 has marched ever upward (as evidenced by thousands of published CO2 world-wide measurements from 2010 to 2014). Global temp anomalies have remained flat during time with small ups and downs related to the Pacific and ENSO cycles.
In total, this paper, beyond its attempt to confirm CO2 GHE theory, the 2 W/sm/decade and the temp hiatus provide a very inconvenient, uncomfortable message to the CAGW faithful.

xyzzy11
February 26, 2015 3:13 am

I think Tony Heller (AKA Steven Goddard) makes a good point about this paper over at Real Science, linked here:
https://stevengoddard.wordpress.com/2015/02/26/junk-science-award-for-the-evening/
His point is that the start and end dates for the project

The authors started in the 2000 La Nina, and ended at the 2010 El Nino – when troposphere temperatures were half a degree warmer.

Which could account for the extra DWLWIR. Just sayin …

B Kindseth
February 26, 2015 4:10 am

An earlier paper, also with Jonathan Gero as one of the authors, used 800,000 readings taken every 10 minutes over 12 years, found a downward trend. The paper is Long-Term Trends in Downwelling Spectral Infrared Radiance over the U.S. Southern Great Plains. http://journals.ametsoc.org/doi/abs/10.1175/2011JCLI4210.1

Reply to  B Kindseth
February 26, 2015 10:31 am

Southern Great Plains is the same Oklahoma site used in the current study. It appears to be in southeastern Grant County which, by Oklahoma standards, has fairly sparsely distributed oil and gas fields. Here is a link to a map showing Oklahoma oil and gas fields (which typically emit CO2 and CH4 into the local atmosphere). http://www.ogs.ou.edu/fossilfuels/MAPS/GM-36.pdf
I did not investigate whether the closest fields were currently active but there is no question that many such fields exist in Oklahoma and Kansas and could potentially contribute to local GHG measurements. Given that the authors adopted a model estimate of 22 ppm increase in CO2 over the period of their study, I wonder if any potential error (otherwise unaccounted for) could have been introduced by local and regional emissions?

Chris Wright
February 26, 2015 4:53 am

Those graphs are a little bit suspicious. They both suggest that the trend reversed right at the end of the graph. So, did they stop making measurements at the end of 2010? Or were the measurements from 2011 onwards a bit – shall we say – inconvenient?
If the data after 2010 shows a fall in the ‘forcing’ and the scientists withheld the data, then it’s a case of scientific fraud.
So: why did the data stop at the end of 2010?

Chris Wright
Reply to  Chris Wright
February 26, 2015 5:55 am

Another thought just occurred.
The only peak that is smaller than the previous one is the very last one. It does suggest that the trend was starting to reverse.
Let’s suppose that it is actually a sawtooth curve. The ascending part is 11 years long, so the period of the sawtooth would be 22 years. Does this ring any bells? Is it possible that solar activity could have a part to play in this?
I hope the authors will be seriously questioned as to why the data apparently ends four years ago. As the data seemed to strongly support their beliefs, it’s difficult to believe they simply lost interest and stopped taking measurements. Also, as it seemed to support AGW, it’s unlikely they lost their funding. And, if they stopped taking data for whatever reason, why did they wait four years before publishing? Were they hoping to see the positive trend return?
Unless there is an innocent explanation – however unlikely – then it looks as if the trend reversed at the end of 2010, they waited for several years assuming and hoping that the trend would return. But they couldn’t wait too long. If the trend stayed negative, the longer they waited, the bigger the gap and the more suspicious it would seem. So, they published in 2015 and simply left out the data that disproved their theory.
Unfortunately this kind of fraudulent practice is common in climate science. The ‘adjustments’ recently discussed here are a good example.
There may be an innocent explanation as to why the data ends four years ago. Maybe their pet dogs ate the data. But, in the absence of an innocent and provable explanation, this looks extremely suspicious.

A C Osborn
Reply to  Chris Wright
February 26, 2015 8:12 am

Plot the Annual Average Forcings and their Differences and you get this.
1999 2000 2001 2002 2003 2004 2005 2006 2007 2008 2009 2010 2011
0 0.02583908 0.033586957 0.026244275 0.077522523 0.094078431 0.101633238 0.145447661 0.165984305 0.220432314 0.213569405 0.229509494 0.265666667
0.007747876 -0.007342682 0.051278248 0.016555909 0.007554806 0.043814424 0.020536643 0.054448009 -0.006862909 0.015940089
I am not sure how the formatting will come out as it is from Excel.

A C Osborn
Reply to  Chris Wright
February 26, 2015 8:13 am

Damn, that is crap.

kramer
February 26, 2015 5:01 am

I’d like to see a similar graph of water vapor and forcing so both of them could be compared.

Pete Ross
February 26, 2015 5:42 am

Considering that for the whole duration of this experiment (2000-2011) the planet did not experience any warming whatsoever, it would be pertinent for the scientists to tell us WHY the increased forcing as measured in one cold place (Alaska) and a less cold place (Oklahoma) along these years failed to result in an increased global temperature.
It must be noted that the experiment has measured the first order effect of an energised CO2 molecule , but what about explaining what happens afterwards to that retained energy? For how long does it stay in the atmosphere? All energy is ultimately ejected to space; that’s how the planet keeps its equilibrium. In my book, the measured increased forcing at two spots on the surface of the planet has resulted in ZERO effect on the climate.
This proves that increasing atmospheric CO2 levels have no resultant increased forcing on the energy retained inside the atmosphere. It’s the scientific principle: If nature/observation does not support the theory, then that theory is wrong, no matter who says it.
Alarmist climate scientists now need to explain why the observed increased forcing failed to result in an observed increased temperature.
I’m waiting with baited breath.

Richard M
Reply to  Pete Ross
February 26, 2015 6:19 am

Not quite true. Look at the satellite data.
http://www.woodfortrees.org/plot/rss/from:2000/plot/rss/from:2000/to:2011/trend
It is simply a matter of cherry picked end points. That is likely the entire reason they found any increase.

whiten
Reply to  Pete Ross
February 27, 2015 8:46 am

Exactly, that’s why it gets funnier …:-)

whiten
Reply to  whiten
February 27, 2015 8:48 am

My above reply is to Pete Ross…:-)

February 26, 2015 7:35 am

https://quantpalaeo.wordpress.com/2014/08/17/holocene-forcing-trends-and-conundrums/
The data shows through out the Holocene CO2 is increasing while the temperature is not.
CO2 is a product of the climate(oceans), environment (forestation) and biological activity.
CO2 is in response to the above.
Of the total concentrations of greenhouse gasses human contribution is 0.28%!

Mark
February 26, 2015 7:37 am

I would like an explanation of why the radiative trend is different between the two sites in Fig 2 and reverses over the yearly cycle at SGP. Their data suggests that increasing C02 cools the back radiation in winter at SGP so how is that to be explained? I wonder how well they actually solved the clear sky problem… I suspect the necessary corrections to extract this tiny signal from the large and variable IR background is very problematic.

Kasuha
February 26, 2015 7:56 am

There is no way this research could stop “Slayers”. They are already too deep in their own universe to accept it and will have no problems inventing reasons why this result is wrong. Nothing is impossible in the land of fantasy physics.
It, however, comes out as a surprise to me that this fairly basic and predictable research result is given such publicity. There is nothing special on it: no surprise, no breakthrough, no controversy. Definitely no first page material under normal conditions. It rather feels like the “climate establishment” just needs to pat itself on the back to feel more secure in suppressing the real opposition of intelligent and studied people who have no problems with basic physics but are asking inconvenient questions or even giving inconvenient answers.

Bengt Abelsson
February 26, 2015 8:11 am

As a sceptic, I do hope that this paper will stand up to all tests and questions, as it puts an end to all Catastrophe tales.
First 0,2 W/m2, decade is energy, not temperature.
In one hundred years, the forcing will increase with 2 W/m2, from 396 today to 398, if Trenberth is to be trusted.
The Stefan-Bolzman law says that energy is proportionat to absolute temp T^4 power.
Let T = future temperature in 100 years from now.
Energy increase 398/396 = T^4 / 288^4
My pocket calculator says T=288,36 or 0,36 warmer than today
Game, set and match over.

February 26, 2015 8:19 am

http://www.euanmearns.com/wp-content/uploads/2013/12/bond_updated.png
The above graph is an excellent representation showing CO2 concentrations have no relationship to the climate.

February 26, 2015 8:58 am

The CO2/Forcing graph runs from the 2000 La Nina to the 2010 El Nino.( Surprise)
It is of interest to compare this with the RSS temperature data in order to see what it tells us about climate sensitivity to CO2.
http://www.woodfortrees.org/graph/rss/from:1980.1/plot/rss/from:1980.1/to:2003.6/trend/plot/rss/from:2003.6/trend
First it is obvious from the RSS data any calculation from 2000 – 2010 will come up with a high sensitivity lambda probably close to the modelers 5.35
Second – this time frame crosses the temperature peak in the 1000 year millennial solar ,cycle seen at 2003 in the RSS data.
Later than that ,if you believe that CO2 is the main driver it must obviously be acting as a coolant.
This conclusion would be strengthened by the CEREs data which also shows the change in trend from warming to cooling at about 2003- see the earlier comment and data provided by Kristian 2/25/1:28pm
http://wattsupwiththat.com/2015/02/25/almost-30-years-after-hansens-1988-alarm-on-global-warming-a-claim-of-confirmation-on-co2-forcing/#comment-1869015
The fact is that ,like the IPCC, we don’t know what the CO2 sensitivity is, yet it is the key factor in making CO2 emission control policy and the basis for the WG2 and 3 sections of AR5. By AR5 – WG1 the IPCC itself is saying: (Section 9.7.3.3)
“The assessed literature suggests that the range of climate sensitivities and transient responses covered by CMIP3/5 cannot be narrowed significantly by constraining the models with observations of the mean climate and variability, consistent with the difficulty of constraining the cloud feedbacks from observations ”
In plain English, this means that the IPCC modelers have no idea what the climate sensitivity is. Therefore, there is no credible basis for the WG 2 and 3 reports and the SPM and the Government policy makers have no empirical scientific basis for the entire UNFCCC process and their economically destructive climate and energy policies.
Climate sensitivity to CO2 ( and especially anthropogenic CO2) is certainly small enough that it can safely be ignored when making climate forecasts .
We must move to another forecasting paradigm based on the natural solar cycle periodicities seen in the temperature and driver data. For forecasts of the timing and extent of the coming cooling based on these natural cycles see.
http://climatesense-norpag.blogspot.com/2014/07/climate-forecasting-methods-and-cooling.html

February 26, 2015 9:32 am

It is almost like talking to a brick wall when trying to show how clearly the data refutes AGW theory and yet this nonsense keeps going on and on. Data does not matter to them only the scam ,they are trying to keep alive.comment image
More data which shows since the Holocene Optimum from around 8000BC , through the present day Modern Warm Period( which ended in 1998) the temperature trend throughout this time in the Holocene, has been in a slow gradual down trend(despite an overall increase in CO2, my first chart ), punctuated with periods of warmth. Each successive warm period being a little less warm then the one proceeding it.
My reasoning for the data showing this gradual cooling trend during the Holocene ,is Milankovitch Cycles were highly favorable for warming 10000 years ago or 8000 BC, and have since been in a cooling cycle. Superimposed on this gradual cooling cycle has been solar variability which has worked sometimes in concert and sometimes in opposition to the overall gradual cooling trend , Milankovitch Cycles have been promoting.
Then again this is only data which AGW enthusiast ignore, if it does not fit into their scheme of things.
http://www.murdoconline.net/wordpress/wp-content/uploads/2011/01/gisp2-ice-core-temperatures.jpg

Reply to  Salvatore Del Prete
February 26, 2015 12:32 pm

Salvatore
Comparing Arctic paleo-magnetic and Greenland Gisp2 ice cores data, a good match is obtained
http://www.vukcevic.talktalk.net/HRec.gif
However there is a major problem, time lines do not agree by a large margin
– Ice core data annual count is too short (missing about 20% of years, evenly spread between 5000 and 500 years BP)
or
– Paleo-magnetic samples have been dated to be older by similar number of years evenly spaced.
Although either is likely, I suspect the paleo-magnetic data.

Janice Moore
February 26, 2015 9:47 am

If you, too, could use a good laugh after reading some of the comments above, here is the grand daddy of all climate l1ars (he isn’t that stupid):
James “Planetary Emergency” Hansen Doubling Down
on His Failed 1988 Prophecies
(youtube)

{at :45} “We have already reached a tipping point. We are going to lose all the sea ice in the Arctic in the summer season.” James Hansen, 2008.
Arctic Sea Ice
http://www.ijis.iarc.uaf.edu/seaice/extent/Sea_Ice_Extent_v2.png

February 26, 2015 11:10 am

The North Slope of Alaska (Point Barrow) instruments may have stopped reporting data in 2010?http://www.arm.gov/sites/nsa
And the Southern Great Plains facility is located near cattle farms and oil/gas fields:

The heart of the SGP site is the heavily instrumented central facility located on 160 acres of cattle pasture and wheat fields southeast of Lamont, Oklahoma.

I wonder whether the declining radiative curve in the study’s later years is in any way related to changes in local emissions (CO2 and CH4) due to the varying fortunes of the cattle industry and the oil & gas industry?

JamesD
February 26, 2015 12:44 pm

Looks like both “forcing” and CO2 are highly correlated to summer/winter. Since they are measuring 0.1 changes in “forcing”, I wonder how much error is introduced from temperature changes? Does their instrument drift depending on whether it is 15F in Oklahoma or 105F?

JamesD
February 26, 2015 12:48 pm

How come the data ends at 2011? Why is the forcing dropping as CO2 increases?

Aphan
Reply to  JamesD
February 26, 2015 2:53 pm

“How come the data ends at 2011?”
I’m going to guess that if they took it all the way through 2014, the plateau becomes embarrassing and obvious…..

accordionsrule
February 26, 2015 6:14 pm

GLOBAL WARMING IS REEAAALLLL….
…….llly small.

February 26, 2015 8:05 pm

In a reply to Steven Mosher above, I wondered whether they had direct in situ measurements demonstrating precisely 22 ppm increases in CO2 during their study period. The SGP site did, indeed, have a CO2 measuring capability. See http://www.arm.gov/instruments/pgs for further information. The ARM site states that:

This precision gas system (PGS) makes high-accuracy, high-precision measurements of CO2 mixing ratio (ppmv dry air) in air sampled at 2, 4, 25, and 60 m above the ground.

In addition, the SGP site had a CO2 flux measurement system (http://www.arm.gov/instruments/co2flx) and airborne flask sampling near the facility.
Nevertheless, the impressively exact values described in the paper are derived from model calculations against the measurements, rather than direct observations at each of the two sites. In addition, I was befuddled by their Extended Data Figure 3 (b) which appears to show that the fossil fuel component of their Carbon Tracker’s CO2 concentrations rose from 0 ppm in year 2000 to approximately 40 ppm by 2011. I must be reading their graph incorrectly. http://www.nature.com/nature/journal/vaop/ncurrent/fig_tab/nature14240_SF3.html

February 26, 2015 10:12 pm

Dear Dr. Feldman,
I was very interested in the media reports of your recent paper “Observational Determination of Surface Radiative Forcing by CO2 from 2000 to 2010”. Unfortunately, the media reporting seems unsupported by even an abstract in Google Scholar or similar engines. I am a subscriber to “Nature News Alerts” and the most recent had no mention either.
It is my understanding that there are no earth spectral bands in which CO2 resonates that water does not also resonate. It is my understanding that there is a unique CO2 band in the near IR incoming solar spectrum which seems lunch money in total intensity.
My specific question is that since you “measure thermal infrared energy”, and “Other instruments at the two locations detect the unique signatures of phenomena that can also emit infrared energy, such as clouds and water vapor “ exactly which bands do you use to distinguish photons emitted by the molecules H20 and CO2?
Regards,
Gordon

richard verney
February 26, 2015 11:03 pm

I have a question:
When using a radio telescope, is not the back radiation characteristics of the atmosphere rather like light polution when using an optical telescope?
If that is so, is there any data as to how changes in the Earth’s atmosphere has impacted upon radio telescopes these past 50 or so years?
Do radio telescopes have to be tuned/calibrated to ‘block out’ the effects of Earth’s atmosphere? If so, this tuning/calibration data could give a useful insight into changes.
Anyone got any thoughts

DCE
Reply to  richard verney
February 27, 2015 1:13 pm

I believe radio telescopes are characterized to eliminate or reduce the effects of local radio sources as well as white noise generated by the electronics themselves. Whether there is also a means of characterizing any RF effects of Earth’s atmosphere is likely, but I am not sure how that would be done. Local sources would be more likely to have a greater negative effect on the sensitivity of a radio telescope than noise generated by the atmosphere. On the other hand any auroral activity could create RF noise across a wide spectrum.

TonyN
February 27, 2015 1:49 am

That massive annual sawtooth on the CO2 graph seems really significant to me. I don’t think that it can all be explained by spring plant growth. We know that CO2 is absorbed and emitted by H2O, so does the sawtooth track with the amount of water in the atmosphere?

Reply to  TonyN
February 27, 2015 5:06 am

TonyN:
The sawtooth graph does reflect seasonal uptake (and release) of CO2 by plants, largely driven by temperate zones rather than tropical. The secular trend (slope) of the sawtooth also appropriately reflects gradual increases in global CO2 from (largely) human activities. I have no idea what you mean when you say “We know that CO2 is absorbed and emitted by H2O….”
I actually have no problems with the basic physics being explored by these authors. My questions arise from their assertion of remarkable precision via actual observations. And if their results are truly a near-perfect image of CO2 forcing, why does the slope of the forcing signal go down in the last years even as the CO2 ppmv value continues its steady increase?
Does the physics change (???) or is there some unexplained source of data contamination at work?

TonyN
Reply to  opluso
February 28, 2015 3:12 am

@ opluso; thanks for your reply,
I am interested in the issue, because I just don’t buy the world-wide annnual CO2 flux ‘sawtooth’ being attributed just to leaf-growth in the northern hemisphere temperate zone. To me, the rates appear too high, and the timings look ‘off’. I speculate that there may be another mechanism at work
I should have said that we know that CO2 is absorbed and released by water … Henry’s law tells us that there will be around 50x more CO2 in the water than there will be in the atmosphere, so it does not take much of a change in atmospheric pressure, or sea surface temperature, to cause a lot of outgassing and indeed reabsorbtion. Now, IF Henry’s law also applies to airborne moisture, i.e. that CO2 is absorbed and released by water vapour via small changes in atmospheric or temperature changes ….. then we could have another mechanism to account for the extraordinary annual flux of atmospheric CO2. A possible indicator could be the amount of CO2 absorbed within the average cloud, and how that would change with changes in temperature and pressure ( i.e. convection).
To speculate even further, could CO2 diffusion via cloud convection be a major mechanism to explain the apparent ‘well-mixed’ claim for atmospheric CO2?

Stephen Wilde
February 27, 2015 5:38 am

Looking at that sawtooth pattern I notice something interesting about the timing of the peaks and troughs.
The peaks are around March when the southern oceans are at their warmest whereas the troughs are around September when the northern oceans are at their warmest.
Since there is far more ocean in the southern hemisphere that is exactly what one would expect to see if the sawtooth pattern is produced by sunlight driving CO2 out of sun warmed ocean surfaces first in one hemisphere and then in the other hemisphere.
As for the background upward trend it would then be logical that multidecadal changes in global cloudiness would be the cause.
The conventional assumption that the fall in CO2 at the end of the northern hemisphere summer is a result of summer take up of CO2 by the northern biosphere may not be correct.
The biosphere suggestion does not allow for multidecadal changes in CO2 but the cloudiness suggestion does when one realises that the climate zones shift to and fro latitudinally over multidecadal timescales in response to changes in solar activity across multiple solar cycles.
Poleward shifting when the sun is active reduces global cloudness whereas equatorward shifting when the sun is quiet increases global cloudiness.

Stephen Wilde
Reply to  Stephen Wilde
February 27, 2015 5:47 am

Northern hemisphere biosphere activity peaks around July since by that date the leaf growth starts to slow in favour of seed production. If the biosphere were causing the sawtooth I would not expect the peaks to be in March and the troughs in September. Rather it would be January and July respectively. By September, northern hemisphere biosphere activity is already well past its peak.
I think a serious error has occurred with the assumption that the biosphere causes the sawtooth pattern.
Sunlight on water could well be the real cause.

February 27, 2015 8:06 am

Hi Gordon.
Thanks for your interest in my paper.
As you probably know, H2O is the most important greenhouse gas following by CO2. Around wavelengths of 15 um, CO2 has extremely strong absorption features associated with the fundamental bending mode of that molecule (sometimes spectroscopists refer to it as the nu-2 band). H2O has relatively weak absorption around 15 um, which is why CO2 is as important a greenhouse gas as it is. Since there are a large number of lines associated with the CO2 bending mode, due to rotational transitions , referred to as the P- and R-branches, which are weaker than the fundamental and thus change more quickly with rising CO2, adding 22 ppm to the atmosphere in a decade leads to a change in transmission in those features and thus an increased greenhouse effect.
The overlap of H2O and CO2 features is important and something that we consider, but I should note that even if features overlap, that can both contribute to a greenhouse effect. Where lines are unsaturated, the effect is approximately linear, and where they are saturated, the effect is approximately logarithmic. If you have a chance, check out Goody and Yung 1989 … it’s pretty mathematical but it does describe the basics of how this all fits together.
Cheers,
Dan

February 27, 2015 9:28 am

Isn’t it interesting how a mechanism that can increase the Earth’s average surface temperature by 33C can be so difficult to isolate and measure?

InMD
February 27, 2015 1:00 pm

“0.2 Watts per square meter per decade”
What was the IPCC AR5 prediction of Watts per square meter per decade?

February 27, 2015 8:34 pm

Using the standard Radiation = Sigma(S/B Constant) *Epsilon(about .5)*Temp^4 (Temp =300 K, for start) I find a needed 0.7 degree C (K) upward shift to put out 2 more watts per meter^2, i.e. 100 years down the line.
NOT SOMETHING TO WORRY ABOUT!

February 28, 2015 12:14 am

This is a very nice result but it measures rather less forcing than predicted by radiative transfer models. Fits to a range of these models show (Mehr et al.) that radiative forcing as CO2 concentration rises from a value C0 to a final value C should be
forcing = 5.3*in(C/C0)
putting the numbers in we would expect 5.3*ln (395/368) = 0.35 W/m2
Whereas the measured value is 0.2 W/m2 or 40% less than expected.

Mervyn
February 28, 2015 5:52 am

People should not readily jump to conclusions about the validity of this ‘confirmation on CO2 forcing’.
Look at it this way. If CO2 creates more warming, think about the following situation. If CO2 emissions is steadily rising around the globe, then how come temperatures bobs up and down so much and quite significantly? In places like Alice Springs, in the middle of the year, temperature during a June day can vary between early morning and midday by 20 degrees centigrade without any influence from CO2, then cool again in the afternoon? Clearly, CO2, which is not a meteorological parameter, cannot have much effect on temperature.
The sun is the primary source of energy. What CO2 may do is absorb some energy and emit it but not add anymore heat to that which exists.
CO2 acts like this. Imagine a manufacturing company (the Sun) manufactures widgets (heat). A wholesaler (CO2) purchases 500 widgets (absorbed energy). The wholesaler actually receives 600 widgets instead. So the wholesaler returns to the manufacturer the extra 100 widgets (emitted energy). The manufacturer takes back the 100 widgets. Has the manufacturer increased production (created more heat) because it receives back the 100 widgets? Of course not. No extra widgets were produced.
The first and second laws of thermodynamics are laws of nature. Also, temperature is related to atmospheric mass, gravity and pressure, which explain the atmospheric temperature profiles of Earth, from the surface to the top of the atmosphere. And it has nothing to do with CO2 or that IPCC fraudulent term “back-radiation”.

Aphan
Reply to  Mervyn
February 28, 2015 9:54 am

It’s time to create an automatic ( and viral) response every time someone says that additional CO2 causes warming. That response should be “No, CO2 does not, and cannot create heat, it just slows down cooling. “

Shawn Marshall
Reply to  Mervyn
March 4, 2015 6:39 am

I’m not too bright so I try to think simply. I grew up in a chilly attic room with steam a radiator. So the input was steam from the oil burner down in the basement. It heated the room poorly because all the heat went straight up, convection, there wasn’t any conduction unless I sat and leaned my back against the radiator, if I sat nearby instead I could get a little infrared warming. The convection currents had cooled by the time they were pushed around the room and back to the bottom of the radiator. So I have learned from climate science that if I had placed another radiator in the room a few feet away that, without connecting steam to it, it would be heated by infrared, helping to warm the room, and it would make the original heater hotter by reflecting infrared back to it as well. If I put enough disconnected radiators in the room it would get too hot. Is that right?

kuhnkat
Reply to  Shawn Marshall
March 4, 2015 8:50 am

“If I put enough disconnected radiators in the room it would get too hot. Is that right?”
Don’t forget you need plenty of open water sources in the room to get the water vapor feedback the IPCC depends upon in their models…
8>)

Aphan
Reply to  Shawn Marshall
March 4, 2015 8:54 am

No silly. You had two problems.
1. You needed to throw a blanket over your roof to create a greenhouse that would keep all the heat from your room from escaping to space.
2. You would have to strap all the disconnected radiators to your ceiling so that the absorbed and re radiated infared was directed back down into your room.
3. You’d have to stop breathing on your room, because all of that additional CO2 would eventually raise the temp so high, your room would spontaneously combust, leaving a giant pingo.
/sarc

March 1, 2015 11:13 am

https://www.scribd.com/doc/257319806/Assesment-of-Atomospheric-Radiation-Measurement-Results-Published-Feb-25-2015-Nature-NASA-NOAH-12-year-Project
Got it! You can download my write up (with nice MathCAD math format, like a text book) on ScribD

Ron C.
March 1, 2015 1:53 pm

The media is agog over the Lawrence Lab paper, saying that it measures the warming effect of CO2 in the atmosphere, and is proof of the greenhouse gas effect.
This paper claims to prove rising CO2 in the atmosphere increases downwelling infra-red radiation (DWIR), thereby warming the earth’s surface. The claim is based on observations from 2 sites, in Alaska and Oklahoma. Let’s examine the case made.
Observation: In Alaska and Oklahoma CO2 and DWIR are both increasing.
Claim: Additional CO2 is due to fossil fuel emissions.
Claim: Higher DWIR is due to higher CO2 levels.
Claim: Global DWIR is rising.
Claim: Global surface temperatures are rising.
Conclusion: Fossil fuel emissions are causing Global surface temperatures to rise
Issue: What is the source of rising CO2?
Response: Natural sources of CO2 overwhelm human sources.
The sawtooth pattern of seasonal CO2 concentrations is consistent with release of CO2 from the oceans. Peaks are in March when SH oceans are warmest (60% of world oceans), and valleys are in September when NH oceans are warmest. In contrast biosphere activities peak in January in SH and July in NH.
CO2 content of the oceans is 10 times that of the atmosphere, resulting in the sawtooth extremes. Human emissions are ~5 to 7 Gigatons compared to ~150 Gigatons from natural sources.
Issue: What is the effect of H2O and CO2 on DWIR?
Response: H2O provides 90% of IR activity in the atmosphere.
The long term increase in DWIR can be explained by increasing cloudiness, deriving from evaporation when the sunlight heats the oceans. A slight change in H2O vapor overwhelms the effect of CO2 activity, and H2O varies greatly from place to place, while the global average is fairly constant.
Issue: What is the global trend of DWIR?
Response: According CERES satellites, DWIR has decreased globally since 2000, resulting in an increasing net IR loss upward from the surface.
Globally, Earth’s surface has strongly strengthened its ability to cool radiatively from 2000 to 2014 (by about 1.5 W/m2 or ~1 W/m2 per decade) according to CERES. The increased upward heat loss from the surface is matched by decreasing trend of DWIR globally. And this is in spite of significantly increasing atmospheric content of both CO2 and H2O (WV & clouds) + allegedly rising temps since 2000.
Conclusion:
The rise in CO2 is almost all from natural sources, not fossil fuel emissions.
IR activity is almost all from H2O, not from CO2.
Global DWIR is lower this century, and the surface heat loss is less impeded than before.
Global surface temperatures are not rising with rising fossil fuel emissions.

March 2, 2015 8:08 am

Guys: Look at my paper. I don’t care if it is real, the numbers as small enough to be insignificant over 100 years. If “we” (civilization) are not looking down from the “Starship Enterprise” and checking the status of the “matter/antimatter” converters (for energy)…then we haven’t advanced enough!
Max

March 4, 2015 4:21 pm

In case anyone is wondering, I’m aware of Dr. Spencer’s critique of this work, in terms of it’s over all significance. I’m also aware of Dr. Spencer’s statement “you can’t correlate IR numbers with temperature in any direct way..” (in varience to my, admitted, simplistic Stephan Boltzmann analysis…) However, I stand by my analysis (and will point out that, yes, the atmosphere is a “gray gas”, yes, it needs a “layered approach” to try and figure out the NET “radiation” balance effect on TROPOSPHERIC temperatures, and (hat tip to Willis) we don’t REALLY have a decent way of modeling the “heat pump” work of thundestorms, which could have as much as a 10% effect on the energy balance, if the peak numbers observed per season, continuously appeared) is deliberately simplistic. I’d also suggest this experiment: Take a square meter box…put 213 one watt LED flashlights on the top..make it closed. Put themocouples in it. See where it balances in the long run (with a constant ambient temperature on the outside of the box). Add two MORE 1 watt LED flashlights. Note the difference… I’m willing to bet, it cannot be observed. It’s a NEAT physical model to help “get a grip” on the magnitudes involved here. At some point one has to be able to draw the line and say, TRIVIAL!!!