From the “this ought to shut up the “Skydragon slayers” department. Despite sophomoric claims that I’m a “denier”, I’ve never disputed that CO2 has a role in warming via retardation of IR transfer from the surface to the top of the atmosphere. What is really the issue related to AGW claims are the posited/modeled but not observed feedbacks and the logarithmic (not linear) saturation curve response of CO2. Along those lines, eyeballing the graph presented from the north slope of Alaska, it appears there might be a bit of a slowdown or “pause” in the rate of forcing from about 2007 onward. Hopefully, LBL will release the data for independent analysis.

First direct observation of carbon dioxide’s increasing greenhouse effect at the Earth’s surface
Berkeley Lab researchers link rising CO2 levels from fossil fuels to an upward trend in radiative forcing at two locations
Scientists have observed an increase in carbon dioxide’s greenhouse effect at the Earth’s surface for the first time. The researchers, led by scientists from the US Department of Energy’s Lawrence Berkeley National Laboratory (Berkeley Lab), measured atmospheric carbon dioxide’s increasing capacity to absorb thermal radiation emitted from the Earth’s surface over an eleven-year period at two locations in North America. They attributed this upward trend to rising CO2 levels from fossil fuel emissions.
The influence of atmospheric CO2 on the balance between incoming energy from the Sun and outgoing heat from the Earth (also called the planet’s energy balance) is well established. But this effect has not been experimentally confirmed outside the laboratory until now. The research is reported Wednesday, Feb. 25, in the advance online publication of the journal Nature.
The results agree with theoretical predictions of the greenhouse effect due to human activity. The research also provides further confirmation that the calculations used in today’s climate models are on track when it comes to representing the impact of CO2.
The scientists measured atmospheric carbon dioxide’s contribution to radiative forcing at two sites, one in Oklahoma and one on the North Slope of Alaska, from 2000 to the end of 2010. Radiative forcing is a measure of how much the planet’s energy balance is perturbed by atmospheric changes. Positive radiative forcing occurs when the Earth absorbs more energy from solar radiation than it emits as thermal radiation back to space. It can be measured at the Earth’s surface or high in the atmosphere. In this research, the scientists focused on the surface.

They found that CO2 was responsible for a significant uptick in radiative forcing at both locations, about two-tenths of a Watt per square meter per decade. They linked this trend to the 22 parts-per-million increase in atmospheric CO2 between 2000 and 2010. Much of this CO2 is from the burning of fossil fuels, according to a modeling system that tracks CO2 sources around the world.
“We see, for the first time in the field, the amplification of the greenhouse effect because there’s more CO2 in the atmosphere to absorb what the Earth emits in response to incoming solar radiation,” says Daniel Feldman, a scientist in Berkeley Lab’s Earth Sciences Division and lead author of the Nature paper.
“Numerous studies show rising atmospheric CO2 concentrations, but our study provides the critical link between those concentrations and the addition of energy to the system, or the greenhouse effect,” Feldman adds.
He conducted the research with fellow Berkeley Lab scientists Bill Collins and Margaret Torn, as well as Jonathan Gero of the University of Wisconsin-Madison, Timothy Shippert of Pacific Northwest National Laboratory, and Eli Mlawer of Atmospheric and Environmental Research.
The scientists used incredibly precise spectroscopic instruments operated by the Atmospheric Radiation Measurement (ARM) Climate Research Facility, a DOE Office of Science User Facility. These instruments, located at ARM research sites in Oklahoma and Alaska, measure thermal infrared energy that travels down through the atmosphere to the surface. They can detect the unique spectral signature of infrared energy from CO2.
Other instruments at the two locations detect the unique signatures of phenomena that can also emit infrared energy, such as clouds and water vapor. The combination of these measurements enabled the scientists to isolate the signals attributed solely to CO2.
“We measured radiation in the form of infrared energy. Then we controlled for other factors that would impact our measurements, such as a weather system moving through the area,” says Feldman.
The result is two time-series from two very different locations. Each series spans from 2000 to the end of 2010, and includes 3300 measurements from Alaska and 8300 measurements from Oklahoma obtained on a near-daily basis.
Both series showed the same trend: atmospheric CO2 emitted an increasing amount of infrared energy, to the tune of 0.2 Watts per square meter per decade. This increase is about ten percent of the trend from all sources of infrared energy such as clouds and water vapor.
Based on an analysis of data from the National Oceanic and Atmospheric Administration’s CarbonTracker system, the scientists linked this upswing in CO2 -attributed radiative forcing to fossil fuel emissions and fires.
The measurements also enabled the scientists to detect, for the first time, the influence of photosynthesis on the balance of energy at the surface. They found that CO2 -attributed radiative forcing dipped in the spring as flourishing photosynthetic activity pulled more of the greenhouse gas from the air.
###
The scientists used the National Energy Research Scientific Computing Center (NERSC), a DOE Office of Science User Facility located at Berkeley Lab, to conduct some of the research.
The research was supported by the Department of Energy’s Office of Science.
Am I understanding this correctly?
Comparing 200ppm to 400ppm CO2.
Roughly speaking, 200 extra parts per million CO2 has to absorb enough energy to raise the other 999800 parts per million of the atmosphere by 1°C, very roughly from15°C to 16°C which is approximately about a 5 watts per square metre change.
200 is 1/5000 of 1 million therefore 200 parts of CO2 has to absorb 5,000 times the energy to raise the temperature of the other 999800 parts.
To raise 1 square metre of atmosphere by 5 watts, CO2 would have to absorb 25000 watts?
Well spotted.
It also needs to stop any of this extra energy escaping into space.
Very good Kelvin…………
“This increase is about ten percent of the trend from all sources of infrared energy such as clouds and water vapor.” So, the other 90% might not overwhelm the 10%? And the outgassing of CO2 from the oceans due to the warming over the past 12, 000 years of interglacial warming might not be the source of the CO2? And still two decades of no warming. Trade those models in on a Victoria’s Secret model and ask her. Irrespective of her answer it would be a great trade.
“Both series showed the same trend: atmospheric CO2 emitted an increasing amount of infrared energy, to the tune of 0.2 Watts per square meter per decade.”
I’m confused. Wasn’t the idea behind the CO2 greenhouse effect that at surface pressures, absorption of IR in the band of CO2 , by a CO2 molecule, is way more likely than (re-)emission? And that therefore, thermalization of IR heats up the (low) atmosphere? And would this not also apply to an IR photon coming from above, i.e. a downwelling radiation, assuming the scientists have pointed their sensor upward.
SO, if CO2 is a net absorber at surface pressure, should they not have measured a decrease of IR photons in that band?
…because, if the concentration of the absorbing element rises, more absorption should happen.
We must remember that in the case of CO2 it is not a linear relationship, meaning that if you double the concentration in the atmosphere it does not mean twice the amount of IR radiation will absorbed. There has been some speculation that we are approaching the saturation point where further increases in concentration will have little effect on IR absorption.
tty:
Good point. More wv===>more convection ===>more cooling. Positive feedback is absurd. Increase wv, you simply increase cooling of the atmosphere. In fact, water vapor represents cooling of the surface.
“””””…..
DCE
February 25, 2015 at 1:12 pm
………………………………………
There has been some speculation that we are approaching the saturation point where further increases in concentration will have little effect on IR absorption.
Not so.
That picture is based on the assumption that the captured photons stay dead; which is a requirement of the Beer-Lambert model.
But the don’t stay dead. because of thermal collisions the excited states are terminated and the photon re-emitted at some line broadened wavelength, so it stumbles on uintil another CO2 moleculse somewhere else re-captures it.
So there isn’t any saturation process. It’s almost as if the CO2 is acting as a catalyst, modifying the photon behavior but without changing the photon (much).
George
However when the co2 emits the photon it “Cools” so the net result is that no matter how much ir radiation there is the co2 once warmed never again can add to the energy balance. in essance it can only slow the rate transfer once.
The absorbed energy is all re-radiated and eventually leaves the Earth. The presence of CO2 causes this heat loss to slow down a little as the energy bounces around in all directions for longer. Eventually, there is a new equilibrium at a higher temperature.
I saw that nicely demonstrated by some schoolkids in a You Tube video using sealed boxes with different concentrations of CO2. The question is–what happens in the real atmosphere with no seals, plenty of convection and unknown feedbacks?
I don’t think it even reaches a new equilibrium at a higher temperature. It’s NOT CO2 that drives temperature, it’s more a function of atmospheric pressure.
Water vapor is lighter than air, and will rise to whatever altitude it takes before radiating enough heat to condense and fall back. The absolute most change that CO2 levels CAN make is to change the altitude of that change. Heat will never build up significantly, it will always be radiated as required.
This is THE fundamental flaw in the whole “greenhouse” hypothesis, and the reason I simply laugh at anyone who thinks CO2 drives climate. It has never done so historically, and it never will.
ladylifegrows
February 25, 2015 at 1:05 pm
“The absorbed energy is all re-radiated and eventually leaves the Earth. The presence of CO2 causes this heat loss to slow down a little as the energy bounces around in all directions for longer.”
According to warmists’ explanations at surface pressure a CO2 that catches an IR photon, with a high probability, collides with another molecule faster than it would take to re-radiate the photon. Situation is reverse in the stratosphere- where re-radiation is more likely.
So, IR is net thermalized near the surface (where they measured) and net de-thermalized higher up (the energy is obviously transported upwards mostly by convection).
BUT this would mean that there should be FEWER free IR photons (what they measure) near the surface if there’s more CO2.
I don’t understand their logic a bit.
And, people on this blog, warmists, and lukewarmers, and generally everyone except the slayers, have lambasted me for not understanding the difference between high and low atmospheric pressure and the according absorption/emission probabilities (I claimed that at every height every absorbed IR photon is net re.radiated – which seems to be false).
Now, these scientists detect MORE IR photons when there’s MORE net-absorbing CO2? Can someone get Tamino and Eli Rabbett to call them nitwits? Or bend themselves into a pretzel while explaining the obvious contradiction away?
So Ladylife, You watched some u-tube kids do a CO2 radiation absorption experiment.
So what was it that they used as their source of 10.1 micron peak spectral wavelength LWIR radiation at 390 W/m^2 like the earth’s surface puts out.
Was it a bottle of water chilled to about +15 deg. C (288K) or was it a 3,000 K 100 Watt light bulb that is 10,000 times as bright as the bottle of water, and 100,000 times as bright (spectrally) at the peak wavelength; which incidently gives photons having 10 times the photon energy of the earth’s photons or the water bottle’s photons.
Oh that light bulb is 1/16th as bright as the sun’s surface.
So yeah that’s a great experiment to prove that heat conducts through box walls and heats the air inside.
“””””…..
DirkH
February 25, 2015 at 2:33 pm
ladylifegrows
February 25, 2015 at 1:05 pm…..””””
So Dirk,
Your near surface CO2 molecule at 288 K Temperature, captures a 15.0 micron Photon which is about 86.7 meV energy, and it starts doing the elbow bend oscillation, while still running around consistent with its 288 K Temperature environment, to which the elbow bend oscillation is totally oblivious.
If they leave it alone like up in the stratosphere, it will eventually reradiate about the same 86.7 meV photon, and quit flexing its muscles.
But instead, another nitrogen molecule collides with it, and upsets its timing so it prematurely ejects the photon. But it is still a nearly 86.7 meV photon, except the Heisenberg uncertainty, will change the energy a bit since dE.dt > h’2pi and the unperturbed lifetime of the excited state got perturbed.
So the CO2 molecule and the N2 molecule exchanged some billiard ball kinetic energy and each went off in some other direction, but the CO2 molecules emitted photon is still at about 86.7 mev just slightly line broadened because of the collision.
So just where in this process, did the photon’s energy get “Thermalized” ??
I can’t see it.
Sodium atoms in a sodium lamp absorb and emit 589.0 and 589.6 nano-meter yellow lines.
They also bang into each other, which results in broadening those emission lines. But they never move far from that 589.3 mean wavelength.
The idea that somehow the 86.7 meV energy of a CO2 elbow photon gets cut and divided up and distributed to a bunch of nitrogen, or oxygen or argon molecules, seems pretty phony to me.
The 15 micron dip (13.5 to 16.5 microns) in the as seen from space earth extra-terrestrial spectrum, is not because some of the surface emitted captured photons got thermalized away as some other critters. It is because the emission is isotropic, and only about half of them head in the direction of outer space, leaving a deficit in that 15 micron band as seen from space.
This not peer reviewed research was financed in part by a grant from the Government of New Zealand (circa 1954-57). Just too early to be included in the IGY researches.
llg: people who say that should realise that the delay is in millionths of a second, and does not take account of negative feedbacks. Nor do they seem to consider that we are dealing with emissions, not absorptions. Brett
Thanks, George.
ladylifegrows @ur momisugly February 25, 2015 at 1:05 pm
“I saw that nicely demonstrated by some schoolkids in a You Tube video using sealed boxes with different concentrations of CO2. “
You may have seen a claim of that, but it would be impossible to demonstrate it that way. CO2 in sealed boxes does not experience pressure and Doppler and other broadening, and would intercept an utterly negligible amount of outgoing IR. Experiment debunked throughly here.
Do we just “eyeball” their charts and “see” their correlation?
I have to assume that radiative forcing doesn’t go up much during the summer, either, because plants are still growing. That means the greatest increase of CO2-attributed radiative forcing must be occurring during fall and winter months. Oh no, an increase of 0.02 watts/m^2 each cold-weather season is going to doom us all!
“The direct sunlight at the earth’s surface when the sun is at the zenith is about 1050 W/m2, but the total amount (direct and indirect from the atmosphere) hitting the ground is around 1120 W/m2”
So my take on their claim of “two-tenths of a Watt per square meter per decade” is the following equation:
MWRD= 0.2W/Decade=Noise
Note: MWRD = More wasted Reseach Dollars
And they assume a linear increase but all the data I have seen shows everything occurs in cycles. The trend reverses about 2011 and temps moderate and sea ice increases.
Ian H said ……………
“OK – if they have the instruments to do this for CO2 then please hurry up and do it also for H2O. The H2O contribution needs to be going up at around 3 times or more the rate of the CO2 contribution if the positive feedback assumption (on which the whole CAGW edifice is constructed) is to be correct. If it isn’t then CAGW is a busted flush. They mention that separating out the contribution from water vapour was obviously a problem for them, so they must surely be able to measure it.”
Much more difficult to measure H2O increase as it varies enormously in time/space. indeed the measurements have to be taken in clear skies.
The paper does show radiosonde measurements though of H2O profile averages – showing an increase in lower tropospheric H2O, especially at the Alaska site in summer.
Remember we have a snapshot of just 2 locations for the globe here.
BTW: WV must increase if the temp is rising, such that the absolute humidity goes up while the rel humidity stays constant (given a water molecule’s stay of around 10 days in the atmosphere). The Earth’s surface is ~70% water and can’t help but evaporate to saturate any warming. It’s empirical physics.
Take a look at the Satellite CO2 data, it is not well mixed as advertised.
“WV must increase if the temp is rising, such that the absolute humidity goes up while the rel humidity stays constant (given a water molecule’s stay of around 10 days in the atmosphere).”
There is no physical law that says that rel, humiditry has to stay constant. And note that convective heat transport to the tropopause increases linearly with the amount of water evaporated.
tty:
Good point. More wv===>more convection ===>more cooling. Positive feedback is absurd. Increase wv, you simply increase cooling of the atmosphere. In fact, water vapor represents cooling of the surface.
So what evidence do you have that some specific water molecule has stayed in the atmosphere for ten days.
Only Mother Gaia can read the serial numbers on water molecules to tell them apart, and she won’t tell us which is which.
Water vapor is a PERMANENT component of the earth’s atmosphere. In recorded history, there has never been a time with no water vapor in the atmosphere.
Well there was when Peter Humbug took them all out on his Play Station just to watch the planet fry.
Trouble is they all came back within three months.
It will be interesting to see what bona fide evidence they have for their grand claims. Meanwhile, mere eyeball correlation with little evident phase lag does not causation make.
Weren’t there a couple of large volcanic eruptions between 2000 & 2010 and wouldn’t they show on the CO2 graph??
Are they claiming that overall forcing increased at a rate of 2 W/m²/decade between 2000 and 2010? If they do, this claim is plainly contradicted by both OHC (Ocean Heat Content) and CERES satellite radiation flux measurements at ToA (Top of Atmosphere).
Not much increase in any alleged radiative imbalance at the TOA over the last 14+ years: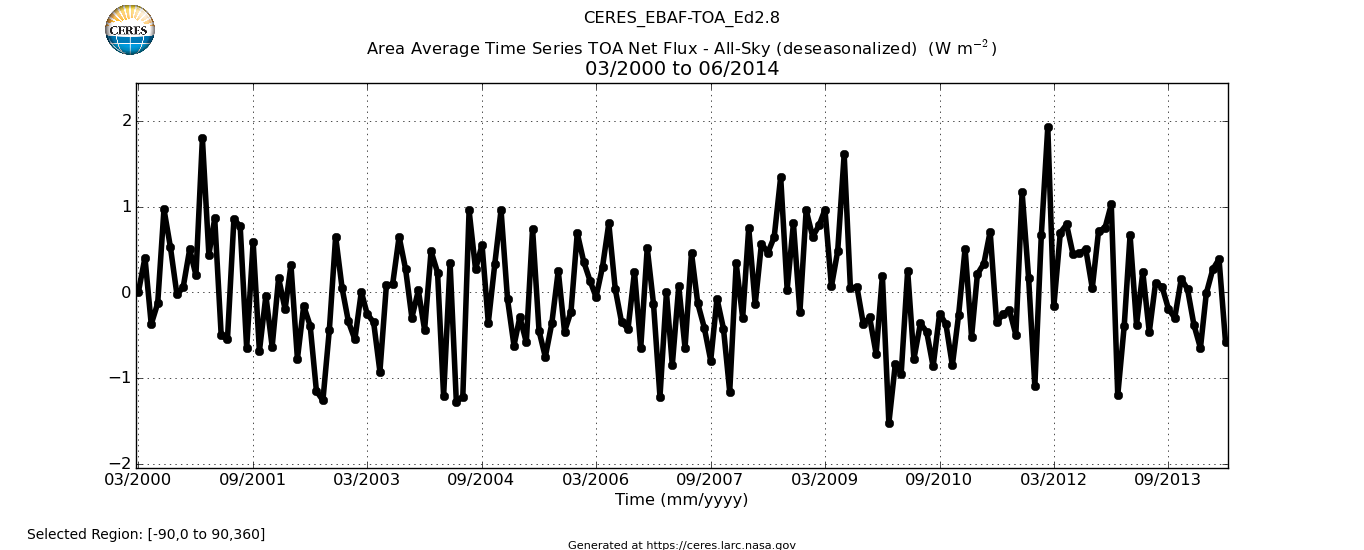
Any upward trend to discern? (CERES, March 2000 – June 2014.)
“Any upward trend to discern?”
Sure, start the graph in 2001 and stop at the end of 2009 and you have a nice scary picture that ought to be worth some grant money.
RH, there data has a nice rising trend in line with overall CO2 data, but the ceres data does nothing from 2001 to 2008 and then jumps up 1 Unit.
So the Atmosphere stores up there steady input and then sends it out in one package over 12 months. Really clever.
Damn, wish they had either a spell checker or Edit facility.
For there please read their.
Can some one do the math – what would the 0.22 watts per m^2 per decade equate to in terms of climate sensitivity , deg C per doubling ?
TIA
I just checked NOAA- atmospheric CO2 was 369.92 ppm in 2000, increased to 389.85 ppm in 2010- 10 years. the natualr log of 389,85/369.92 is about 0.052475.
The natural log of 2 is 0.693147.
.693147/0.052475 is 13.2 If CO2 continues to double at the 2000-2010 rate, It’ll take 13.2 decades for a doubling, at which point the wattage increase would be 0.02 watts/year * 132 years = 2.64 watts for a doubling of CO2, only about 2/3 the IPCC figure of 3.97 watts increase for a doubling of CO2..
Dude! I’m sittin’ next to you next pop quiz!
Mike said………..
“The direct sunlight at the earth’s surface when the sun is at the zenith is about 1050 W/m2, but the total amount (direct and indirect from the atmosphere) hitting the ground is around 1120 W/m2″
So my take on their claim of “two-tenths of a Watt per square meter per decade” is the following equation:
MWRD= 0.2W/Decade=Noise
The measurements were made at night, at which time only back-radiated IR impinges the Earth’s surface.
The measurements are “spectral” and so can attribute the IR frequencies out to the molecules that are re-radiating them. A basic IR thermometer can do it for you.
Roy Spencer explains how…….
http://www.drroyspencer.com/2010/08/help-back-radiation-has-invaded-my-backyard/
There is nothing of “noise” at all here. If that were the case what do you say of satellites measuring planets and stars millions of light years away?
To be picky, Alpha Centauri is only about 4.3 light years away, Sirius is 8 light years away, the super giant Betelgeuse about 300 light years away. The Andromeda Galaxy is about 2.5 million light years away, and satellites CANNOT detect individual stars at that distance, unless they’re supernovae.
From http://apod.nasa.gov/apod/ap150106.html
“What stars compose the Andromeda galaxy? To better understand, a group of researchers studied the nearby spiral by composing the largest image ever taken with the Hubble Space Telescope. The result, called the Panchromatic Hubble Andromeda Treasury (PHAT), involved thousands of observations, hundreds of fields, spanned about a third of the galaxy, and resolved over 100 million stars. “
Maybe that’s 100 million supernovae? 😉
I think relatively modest telescopes can resolve some stars in Andromeda.
Don’t know if I could with my Questar, but I suspect some serious photographers have tried.
I am pretty sure I have seen the Andromeda Galaxy with my naked eye, and that without being on top of some high mountain.
I spotted the Andromeda Galaxy with binoculars- it was a fuzzy blur. I later had the opportunity to see the galaxy through a friend’s Dobson telescope. Through the telescope it was a BIG fuzzy blur.
Leif says:
…a group of researchers studied the nearby spiral by composing the largest image ever taken with the Hubble Space Telescope…
This is the image of Andromeda. The bright stars around the image are actually stars in our own galaxy. They are bright because they’re close.
Amazing. Astonishing. And it’s only one of trillions of galaxies…
Thanks for that video, D. B. . Now, THAT is incredible.
Hubble observed individual variable stars in Andromeda in the 1920’s enough to know what they were and roughly calculate their distance.
DB,
Hundreds of billions of galaxies, not trillions. Estimates used to range from 100 to 200 billion, but Hubble ST observations suggest that there might be as many as 500 billion.
But the number varies with time. In four billion years Andromeda & the Milky Way will merge. Later still the entire Local Group will combine.
I think you have Btu/ft^2. The popular heat balances I have seen have annuals of about 342 W/m^2 ToA and 168 absorbed by surface, 390 surface radiation. 0.2 per decade or .02 per year. Yah, it’s still just noise.
I’m struggling to see whats new here, haven’t all they’ve done is devise a complicated way of measuring the (change) in CO2 concentration in the atmsophere?
Likewise with neilszoo above, so what about a few watts per square metre? A cool object is not going to heat an object thats already warmer – entropy is not running backwards. The power level in my microwave oven is many thousands of watts per square metre, but a glass/ceramic/metal bowl containing anything other than water is not going to get warmed by it. Is this DWIR heating things via dielectric heating because if its not, it cannot do any heating.
Here’s a nit-pick hopefully for us all’s benefit but – As I was taught and came to understand, a ‘linear’ thing is something fully described by ‘an equation’ It matters not that said equation contains exponents, logs, powers to the power n (as per Stefans Law for example)- it is still linear.
Non linear things contain singularities, places where a division by zero is attempted and or the differential of the eqaution heads off to infinity. Such example might be the old joke about falling off a tall building or aeroplane i.e. its not the fall that kills you, its the sudden stop at the end of it, namely where your velocity goes from something to nothing in zero time.
To my knowledge, the only place where Mother Nature gets away with division by zero is at the event horizons of black holes. Folks, especially warmists who claim ‘coupled non-linear blah blahs’ control climate are like folks who claim to understand quantum mechanics, doing so only serves to demonstrate your complete non-understanding of the subject.
That is a different definition of linear.
Yes, by one definition of linear, you have a linear graph if the line is continuous with no singularities. When scientists are discussing the way to variables relate, “linear” means a straight line on regular graph paper and an equation of the form y = mx +c. If there is a logarithmic component, you will get a curve on normal graph paper. If the equation is of the type y = x^2 +b then you get a straight line on log scale graph paper.
It is also possible to have “higher-order polynomials,” which gets more complicated to pick out.
Actually, linear means y = mx, full stop. Strictly speaking, y = mx +c is affine, but such a map is often referred to as linear.
Anything which does not move in a straight line is nonlinear. Nonlinear functions are generally much harder to deal with than linear functions, but fortunately, nonlinear equations can often be linearized in a particular domain to a designated degree of accuracy.
Peta in Cumbria: I’m struggling to see whats new here, haven’t all they’ve done is devise a complicated way of measuring the (change) in CO2 concentration in the atmsophere?
Say for the sake of argument that you accepted the basic GHG theory: extra CO2 absorbs extra LWIR, raises temperature of troposphere, and increases downward radiation of LWIR. For you, this would then be the first time that a measured increase of DWLWIR, which you assumed all along was there, had been reported. Two things are important about it:
1. It confirms a part of the hypothesized mechanism.
2. The increase is too small to cause much warming.
Basic problems are (a) there are only 2 locations that have been recorded, for what is supposed to be a global phenomenon, so more measurements are needed; (b) the time series record is short, being only about 10 years, in a system that is quite complex and likely chaotic.
Dumb question, but how would weather (as in high/low pressure systems) affect those readings?
Infrared energy? Per second? Per minute? Per Hour? Totaled per day?
When comparing radiation over a time period is the CO2 also measured over the same time period and kept synchronous to the radiation measurements?
Was there any attempt to measure corresponding temperature impacts?
Why control for weather systems? Did they change the CO2 levels? Earth has many weather systems and all contribute directly to climate.
I smell fudge factors.
Did a polar bear eat one while the other got dumped on by cattle in 2010? So, in 2015, there is no attempt to update? A very strong Manniacal influence here.
What’s with the graph lines getting fatter over time? Is this stolen from the graph of Napolean’s Russian invasion or is there some reason for the asymmetrical lines? Which just happen to skew any ability to look for direct CO2 / IR correlations. Even fattened up, there is only general similarity to graph lines.
Trend? Just how do the researchers define trend?
Offhand, the eyeball effect shows an approximate max to max difference of .2 watts.
Again, was there any attempt to directly measure the effect of .2 watts back radiation on temperature? If not, why not!?
Say what? Anal derived consensus party line assumptions mark this research as false!
Again, Anal derived consensus party line assumptions mark this research as false!
Hopefully, the data collectors and the data will be open to analysis. Honest research could instigate some genuine findings; cough cough, after obtaining additional requisite observations and hopefully in more locations.
I am a technical lukewarmer; but getting 0.04% of a trace gas to be such a manifold radiation multiplier is a long reach in my mind.
Why should any Dragonslayer care about this? Nobody denies ir radiation. Its the automatic asumption that this ir will be convertet to heat at the bottom of the atmosphere the slayers dont accept.
Anyhow an increase in co2 will not generate heat simply because co2 radiates in any direction and every co2 molecule will have at least 6 directions to radiate where at least 5 of them will not be back to earths surface!
You mean the RF phobic slayers…:-)
cheers
The opening statement in the report, seems to be the reporter trying to make a statement unsupported by the source he sites, which seems de rigueur for many summaries for policy makers. From the reporter in promoting this article “The influence of atmospheric CO2 on the balance between incoming energy from the Sun and outgoing heat from the Earth (also called the planet’s energy balance) is well established. But this effect has not been experimentally confirmed outside the laboratory until now.”. From the abstract, “However, despite widespread scientific discussion and modelling of the climate impacts of well-mixed greenhouse gases, there is little direct observational evidence of the radiative impact of increasing atmospheric CO2” http://www.nature.com/nature/journal/vaop/ncurrent/full/nature14240.html
Nice “out of context quote” of a poorly written statement. Taken in the context of the sentence following, the sentence should read, “… “however, despite widespread scientific discussion and modelling of the climate impacts of well-mixed greenhouse gases, there has been here-to-fore little direct observational evidence of the radiative impact of increasing atmospheric CO2″ The verb “is” should have been changed to “has been here-to-fore” to be clearer in the intent of the sentence, i.e., that previously there was little in terms of direct observation. The following sentence says essentially “we now provide that evidence”, which puts the previous sentence in context.
The press release says the study period ended in 2010. The graph ends in 2011. This is 2015. Does anyone know why the discrepancy in their two dates and why the results aren’t carrried forward to present time?
Water vapor has 9 times the impact of CO2.
Development in Earth Science Volume 2, 2014 http://www.seipub.org/des 31
The Greenhouse Effect and the Infrared Radiative Structure of the Earth’s Atmosphere
Ferenc Mark Miskolczi
Geodetic and Geophysical Institute, Hungarian Academy of Sciences, Csatkai Endre u. 6-8, 9400 Sopron, Hungary
fmiskolczi@cox.net
“The stability and natural fluctuations of the global average surface temperature of the heterogeneous system are ultimately determined by the phase changes of water. Many authors have proposed a greenhouse effect due to anthropogenic carbon dioxide emissions. The present analysis shows that such an effect is impossible.”
“One of the most elusive problems of climate science is the correct handling of the radiative effects of the global average cloud cover. After decades of struggle with the cloud forcing parameter and other mixed physical quantities, the role of clouds in the climate system remains hidden.”
“In our view the greenhouse phenomenon, as it was postulated by J. Fourier (1824), estimated by S. Arrhenius (1906), first quantified by S. Manabe and R. Wetherald (1967), explained by R. Lindzen (2007), and endorsed by the National Academy of Science and the Royal Society (2014), simple does not exist.”
Clouds always make it cooler in the cloud shadow zone. I have never observed it to get warmer when a cloud passes between me and the sun; no exceptions.
Clouds keep the desert warm at night.
No silly! Clouds are the atmosphere’s PILLOWS at night, it’s the CO2 “blanket” that keeps the desert warm at night.
/sarc
Long before man produced any measurable amounts of CO2 from combustion, the CO2 centration in Earth’s atmosphere varied from ~ 200ppm to 7,000ppm. All of these fluctuations were natural, not man made. Analysis of ice cores from various locations around the globe tell us that Earth’s atmospheric CO2 concentrations always LAG changes in Earth’s “mean” temperature. This LAG is from 200 to 800 years when the “mean” is increasing and ~ 600 to 2,000 years when the “mean” is decreasing (ie: out of and in to ice ages).
The analysis shows it ALWAYS LAGS! Not 50%, not 75% but 100% of the time that Earth’s “mean” temperature changes. Yes, there is correlation, and yes, there is causality: CO2 concentrations increase when the Earth’s oceans warm and decrease slowly as Earth’s oceans cool. CO2 is not a forcing, it is a RESULTANT! Changes in Earth’s “mean” temperature CAUSE CO2 concentration changes! Thie entire theory that atmospheric CO2 concentration is a dominant forcing is totally bogus!!!! Just ask any engineer (process, electrical, etc) that understands process control. A parameter that lags the primary variable is not a driver, it is a resultant. It’s like saying that the speed of your car is the primary driver of your gas usage. No, you and the cars accelerator are what drives the flow rate of gas and that results in your cars speed, with impacts from drag, terrain, etc! You can do 60 mph coasting down a steep incline while your cars engine is in idle, using minimal gas. Gas usage drives car speed! Car speed is a resultant, not a primary driver.
Bill
Bill 1:11pm: “Earth’s atmospheric CO2 concentrations always LAG changes in Earth’s “mean” temperature….CO2 is not a forcing”
By Bill’s logic, the CO2 emitted by my gas furnace TODAY must then cause a temperature increase effective YESTERDAY. So to comply with Bill’s logic that CO2 increase always lags the temperature increase. Bill will want to rethink cause and effect in this example.
Trick. You aren’t fooling anyone here but yourself.
CO2 has never been proven to be the cause of ANY temperature forcing in the system we call “earth.”
Wow. Either you read backwards or write backwards, or just like exposing your incredible lack of logic, but you in no way used Bill’s logic accurately.
First-your house is not representative of Earth’s climate/atmospheric system.
Second-YOU are using the CO2 emitted by your furnace today as a retroactive forcing, and you’re quote clearly shows that Bill does not consider Co2 to be a forcing AT ALL.
Third-using YOUR logic, the CO2 that your gas furnace emits today, will cause the temperature in your house to increase TOMORROW.
And most importantly-Your gas furnace DOES NOT USE CO2 to heat your house! ROFL
Janice 2:01pm: That doesn’t change cause is still ALWAYS before effect in nature. So far as we know anyways, universe entropy ALWAYS increases. Relentlessly. There were some who proposed that universe entropy could be decreased by a black hole, but even that fell victim to the 2nd law.
Bin sniffin’ yo gas too much, hommie.
Aphan 2:14pm: First – My house is subject to the same basic physics as earth’s climate. Second – I commented on Bill rethinking cause and effect; CO2 forcing is more complex. Try to separate the points. Third – Doesn’t make any sense. Surely my furnace turning on causes a later effect in my house. Most importantly – let me clarify, my furnace uses nat. gas. which is primarily methane CH4.
Trick: “CO2 forcing is more complex”
Truth: CO2 forcing outside a highly controlled laboratory setting has never been proven to exist.
That wasn’t for you, Trick. It’s so you don’t trick anyone else.
Janice 2:36pm: So….you admit CO2 forcing exists in a highly controlled lab. Curious – what truth allows you to then write CO2 forcing doesn’t exist outside?
Trick
Janice Moore wrote saying to you
and I write to refute some of your nonsense for the same reason she did and in support of her.
You say
I answer your question as one of all the many rational people who understand the subject.
The answer to your question results from a basic scientific principle; viz. the Null Hypothesis.
The Null Hypothesis says it must be assumed a system has not experienced a change unless there is evidence of a change.
The Null Hypothesis is a fundamental scientific principle and forms the basis of all scientific understanding, investigation and interpretation. Indeed, it is the basic principle of experimental procedure where an input to a system is altered to discern a change: if the system is not observed to respond to the alteration then it has to be assumed the system did not respond to the alteration.
In the case of climate science there is a hypothesis that increased greenhouse gases (GHGs, notably CO2) in the air will increase global temperature. There are good reasons to suppose this hypothesis may be true, but the Null Hypothesis says it must be assumed the GHG changes have no effect unless and until increased GHGs are observed to increase global temperature. That is what the scientific method decrees. It does not matter how certain some people may be that the hypothesis is right because observation of reality (i.e. empiricism) trumps all opinions.
Please note that the Null Hypothesis is a hypothesis which exists to be refuted by empirical observation. It is a rejection of the scientific method to assert that one can “choose” any subjective Null Hypothesis one likes. There is only one Null Hypothesis: i.e. it has to be assumed a system has not changed unless it is observed that the system has changed.
However, deciding a method which would discern a change may require a detailed statistical specification.
In the case of global climate in the Holocene, no recent climate behaviours are observed to be unprecedented so the Null Hypothesis decrees that the climate system has not changed.
Importantly, an effect may be real but not overcome the Null Hypothesis because it is too trivial for the effect to be observable. Human activities have some effect on global temperature for several reasons. An example of an anthropogenic effect on global temperature is the urban heat island (UHI). Cities are warmer than the land around them, so cities cause some warming. But the temperature rise from cities is too small to be detected when averaged over the entire surface of the planet, although this global warming from cities can be estimated by measuring the warming of all cities and their areas.
Clearly, the Null Hypothesis decrees that UHI is not affecting global temperature although there are good reasons to think UHI has some effect. Similarly, it is very probable that AGW from GHG emissions are too trivial to have observable effects.
The feedbacks in the climate system are negative and, therefore, any effect of increased CO2 will be probably too small to discern because natural climate variability is much, much larger. This concurs with the empirically determined values of low climate sensitivity.
Empirical – n.b. not model-derived – determinations indicate climate sensitivity is less than 1.0°C for a doubling of atmospheric CO2 equivalent. This is indicated by the studies of
Idso from surface measurements
http://www.warwickhughes.com/papers/Idso_CR_1998.pdf
and Lindzen & Choi from ERBE satellite data
http://www.drroyspencer.com/Lindzen-and-Choi-GRL-2009.pdf
and Gregory from balloon radiosonde data
http://www.friendsofscience.org/assets/documents/OLR&NGF_June2011.pdf
Indeed, because climate sensitivity is less than 1.0°C for a doubling of CO2 equivalent, it is physically impossible for the man-made global warming to be large enough to be detected (just as the global warming from UHI is too small to be detected). If something exists but is too small to be detected then it only has an abstract existence; it does not have a discernible existence that has effects (observation of the effects would be its detection).
To date there are no discernible effects of AGW. Hence, the Null Hypothesis decrees that AGW does not affect global climate to a discernible degree. That is the ONLY scientific conclusion possible at present, and the finding reported in the above article does not change it.
Richard
Richard 10:57pm: “..the Null Hypothesis says it must be assumed…Hence, the Null Hypothesis decrees..”
Richard – Your logic though verbose fails inherently. The null hypothesis isn’t useful at all to assume something then decree the something must exist. No, we need to use the full on scientific method here. My nat. gas furnace emitting CO2 today CANNOT affect temperatures yesterday.
“I write….in support of (Janice).”
So….Richard supports CO2 forcing exists in a highly controlled lab. Curious – what truth allows Richard to then support CO2 forcing doesn’t exist outside the lab?
@ur momisugly Trick — Truth: The laboratory and the earth “system” differ vastly.
I didn’t bother to dignify your nonsense about that with a response, but, once again, NOT FOR YOU FOR THOSE YOU MAY FOOL, I write.
*******************
Thanks Richard! So glad that you are feeling well enough to write here. Trick will not understand (or, just to be a jerk, not admit he or she understands) the null hypothesis or anything else. Trick is obviously sick (or w1cked). No sane, decent, person would write as Trick does.
I’m going to just ignore him/her. Lol, I don’t think there is much danger of Trick fooling anyone anymore here.
Trick
You proclaim you have inadequate reading comprehension skill.
There is no lack of logic in my post which is not verbose.
Do try to read my post again again because you need to understand it if you are to overcome your prejudiced acceptance of the false AGW-scare.
Richard
PS
Onlookers may care to note that the anonymous troll posting as Trick does understand my post but has attempted to trash it because he/she/they have no answer to it.
Janice
Thankyou
Richard
Richard 9:37am – Your post lacks application of the scientific method (as does Janice’ post) so the logic in it easily fails as you do not support your logic with science either inside the lab or outside the lab. The top post paper being discussed writes there is a “discernible” (RSC term) CO2 effect (just see the title – observational!). Your logic thus fails. To improve logic, just add the scientific method to your comments.
——
More for the brave:
“..you need to understand it if you are to overcome your prejudiced acceptance of the false AGW-scare.”
Huh? Where is that from, did you just make that up? No, I accept the scientific method logic which is evident in the abstract paper being discussed, not evident in your post.
See your own cite in Idso using science: “Although the evidence I have presented suggests that a doubling of the air’s CO2 content could raise Earth’s mean surface air temperature by only about 0.4°C, there are a number of reasons to question whether even this minor warming will ever occur.” No kidding. There are many forcing factors besides CO2, infinite time periods for observations, the paper being discussed top post is singularly CO2 forcing being observed with as much data as then available.
See L&C using science: “We instantaneously double CO2. This will cause the characteristic emission level to rise to a colder level with an associated diminution of outgoing longwave radiation (OLR)…The actual amount of warming associated with equilibration as well as the response time will depend on the climate feedbacks in the system.” No kidding.
Gregory calculated from test “radiosonde data from 1960 to date” using scientific method: “Climate sensitivity at doubled CO2 concentration was calculated to be 0.26C…..As global warming may be caused by factors unrelated to greenhouse gases” – no kidding.
Thus absent of science this RSC logic fails: “To date there are no discernible effects of AGW.”
Do you even read & comprehend your own ref.s? If so, use some clips to support your assertions so readers can easily verify context.
The chain of events was:
1) heat applied to fuel increases temperature of the fuel
2) fuel decomposes into molecules including CO2, further releasing energy and raising temperature
If your furnace operated by releasing CO2, and CO2 then increased your home temperature, you would have a point. It doesn’t, and you don’t. Even here, the initial temperature increase preceded the CO2 release.
I have looked at those ice core graphs, for whatever they are really worth. They show some correlation between alleged temperature and carbon dioxide level. Sometimes the alleged temperature is leading and sometimes the carbon dioxide is leading. More oten the CO2, but it is not 100%.
Since I do not know how the temperature was measured, I am skeptical of the whole thing.
The Vostok ice core plot is in the WUWT reference page with links to the Nature article which is freely accessible to the general public.
As William Yarber says there is an initial lag according to Petit et al , but the the temperature rise is then accelerated by the forcing effect of the CO2 released from the ocean . There are other studies from other cores on the Antarctic icedome showing similar characteristics , but your post allows me to ask an obvious and simple question which I have not seen discussed.
Why does the temp increase peak always stop at approx 2K above the benchmark temperature .
Is this because that is the point when no more CO2 is expelled from the oceans – but if so the quantity existing in the atmosphere should just continue the heating effect . Is that not one of the principal concerns of the AGW camp , that stopping the CO2 rise is not enough to prevent continued global warming. .
Bill,
Two errors in your reasoning:
1. The CO2 levels in general lag the temperature changes with a variable amount of time over the past 800,000 years and even for the past 55 years for short time variations (seasons, El Niño, Pinatubo). But CO2 levels lead temperature since about 1850: at the current temperature the equilibrium CO2 level would be 290 ppmv, not 400 ppmv.
2. That temperature leads CO2 doesn’t exclude a small influence of CO2 on temperature, as long as the combined fortifying factor is less than 1, see following graph for CO2 and temperature with and without feedback from CO2 on temperature:
http://www.ferdinand-engelbeen.be/klimaat/klim_img/feedback.jpg
All what happens is that with a (small) feedback, temperature and CO2 and slightly higher. How much, that depends of the total factor. For the temperature-CO2 relationship, the influence of temperature on CO2 is modest: some 8 ppmv/°C and the influence of CO2 on temperature is very small: theoretically (based on absorption spectra) some 1°C/2xCO2, without feedbacks of other elements in nature.
Or an initial increase of 1°C in temperature would get to 1.03°C and the initial 290 ppmv would end around 298.3 ppmv instead of 298 ppmv if there was no feedback from CO2 on temperature.
That simply means that all stories that CO2 fortifies the initial increase in temperature and ultimately produces 30% of the warming during a deglaciation (Hansen, 2003) are exaggerated, except if you include huge feedbacks from water vapor etc., which are proven wrong…
Ferdinand Engelbeen
February 26, 2015 at 8:20 am
But CO2 levels lead temperature since about 1850: at the current temperature the equilibrium CO2 level would be 290 ppmv, not 400 ppmv.
—————————-
Very wrong Ferd.
In the most extensive increment of the CO2 emissions period, the CO2 totally lags temp, does not follow or lead temps…….the latest period, the last 20 years, for not saying more.
Yes in the AGW handicap approach it seems like the CO2 has lead the temps for most of the time from 1850.
But when considering that the warming for that period especially at the first part of that period, is not due to CO2 emissions, and while also considering the previous warming period from LIA trought to 1850, then you clearly see that CO2 does not lead but actually follows temps for this period in question, and totally lags at the very moment that it should lead, contrary to what expected by AGWers.
Besides you have a problem that confuses you I think.
The 290 ppmv is not the CO2 equilibrium, is just the CO2 natural variation mean.
The CO2 equilibrium is the the amount of variation of CO2 per temp variation in a accordance with time length.
The lag means no equilibrium, regardless of the actual amount of CO2,. A lag at 290 ppmv meas no equilibrium at 290ppmv.
A transient climate, climate not in equilibrium means no CO2 equilibrium, no matter what amount of CO2.
Since the early stage of LIA till now we are in a Transient climate period, climate not in equilibrium, meaning that a reference to any actual CO2 amount as it being the equilibrium in accordance with temps is actually irrelevant for the period in question.
cheers
Janice 7:43am: Physics principles are the same in the lab as outside the lab – that’s why science calls them principles.
Trick
Your response to Janice demonstrates that you really, really don’t understand science.
Principles are constant. Their effects vary with circumstances.
For example, addition of a cold material to a warmer material cools it.
So, add some ice-cream to a bowl and the bowl always gets colder.
But, add some ice-cream to a healthy child and the child’s temperature does not change.
Richard
Trick
You again proclaim your lack of reading comprehension skills.
My post at 9:37am is here. It is an explanation of a basic scientific principle and the application of the principle to the AGW hypothesis. But you write
That response is surreal. And it falsely claims I did not “support {my} logic with science either inside the lab or outside the lab” when I cited three different pieces of published research!
Then you add
That is another demonstration that you cannot understand what you read.
My explanation says
What is your evidence that the “effect” in the above article is unprecedented in the Holocene?
And my explanation uses the word “discernible” when it says
Clearly, the word “discernible” refers to “man-made global warming” and not radiative forcing. There was no global temperature trend discernible as being different from zero at 95% confidence (i.e. there was no discernible global warming or global cooling) over the period assessed in the above article. There cannot have been any effects of the global warming which did not exist.
In reality the AGW is purported to be an effect of the radiative forcing change which the above article claims to have detected. This is the opposite of your assertion that the radiative forcing change is an effect of AGW.
Trick, your inability to read is not any lack of logic and/or scientific prowess on my part.
And you contradict your self when you claim I did not “support {my} logic with science either inside the lab or outside the lab” when you say you don’t like the findings in my references although you clearly don’t understand them (no surprise there!) and assert no fault in them.
I commend all onlookers to read them especially the paper by Idso which is written with the clarity of Darwin so is comprehensible to anyone with reasonable intelligence. To aid that I remind that I wrote
Richard
Trick
This is a PS for onlookers.
The self contradiction in the recent post to me from Trick is a strong suggestion that the anonymous troll posting at Trick is more than one person.
One version of Trick claims I “do not support {my} logic with science either inside the lab or outside the lab”.
Another version of Trick reads and fails in attempt to find fault with the scientific research papers I linked in “support of {my} logic”.
The responses of both versions of Trick are collated to form the recent post to me from Trick.
Professional trolls obtain payments for providing disruptive posts and often consist of teams.
Richard
I’m just addressing something that might be missing in these posts.
As soon as I remember I went ” Oh look at that, how beautiful is that ? ”
I look at the complexity of all the things around me and I went
” Oh look at that, how beautiful is that ? “
Light snow falling on a weather weary Chicagoan, but damn if it ain’t beautiful.
Aw, U.K. — that’s the first happy thing I’ve seen you write in a long time. That’s great. Make some hot chocolate and toast and just….. smile.
#(:))
Some slightly different data here.
http://www.carbonbrief.org/blog/2015/02/new-study-directly-measures-greenhouse-effect-at-earths-surface/?utm_source=feedburner&utm_medium=feed&utm_campaign=Feed%3A+carbonbrief+%28The+Carbon+Brief%29
For instance there is reference to the IPCC AR5 report which this nicely matches.
How convenient.
From A C Osborn’s link-
“The study finds that rising carbon dioxide concentrations are responsible for emitting around 0.2 Watts per square metre (W/m2) of energy per decade. This is slightly below the global average of 0.27 W/m2 over the last decade estimated by the Intergovernmental Panel on Climate Change (IPCC) in its latest report.”
“This difference highlights how specific on-the-ground studies can be to their location, Prof Richard Allan, a climate scientist at the University of Reading, tells Carbon Brief:
“The results of the study are not applicable globally, since two relatively dry locations are considered. It is doubtful that a detectable signal would be present at the surface in the wet tropics where there is copious water vapour and cloud.”
So “around 0.2 W/m2″…means what? In the neighborhood? Close to? Kind of like? “Estimated by the IPCC”…estimates are not precise by definition.
Yet two “specific on the ground” locations at different latitudes produced the exact same results?
So the CO2 effect is stronger in dry places. Which means the global effect is 《2.5W/m2 doubling from 280 ppm????
http://jennifermarohasy.com/2013/12/agw-falsified-noaa-long-wave-radiation-data-incompatible-with-the-theory-of-anthropogenic-global-warming-2/
The news is CO2 has had zero warming effect on the climate and I can show through the data that this is indeed the case.
The above is one of many recent studies that shows the amounts out going long wave radiation from earth being emitted to space has increased. The exact opposite of what AGW theory predicts.
.
Next point is yes a greenhouse gas effect does exist but it does not govern the climate , rather the GHG effect is in response to the climate. A warmer climate causing a greater GHG effect and vice versa.
This can be shown to be true due to the fact CO2 always follows the temperature never leads it and secondly the warmer the oceans are the less CO2 they can hold.
Next the data of recent past temperature trends which I will send shows each warm period in the Holocene starting with the Holocene Optimum and going to the Minoan, Roman, Medieval ,to the Modern Warm Period has been cooler then the one that proceeded it and this despite lower CO2 concentrations during those earlier warmer periods.
MikeB
Yes, you are right. Sorry.
But that does not affect my point; i.e. irrelevant trivia is a distraction.
Richard
http://www.murdoconline.net/wordpress/wp-content/uploads/2011/01/gisp2-ice-core-temperatures.jpg
You should correct the graph, it should be Years before Present (1950 AD)
Phil.
Technically you are correct; i.e. “Present” should be cited as 1950 AD and not 2000 AD.
However, for the sake of onlookers who may not know, I write to point out that your pedantic nit pick does not affect the arguments (whatever they are worth) from Salvatore Del Prete. This is because the x-axis of the graph clearly states it ends at 1950, and the ice core data has a temporal resolution of ~80 years at best.
Richard
Salvatore,
You do realise that this graph, like all ice-core graphs, says nothing about modern day temperatures?
Richard,
One of us needs to go to specsavers. The x-axis says nothing about 1950.
The last data point of that graph was from 1855.
MikeB
My response to you is in the wrong place. It is here. Sorry.
Richard
I find the very small variance of ~0.5°C in the most recent 700 years of that chart most unconvincing.
Atmospheric absorption of IR from the surface does not an increase in temperature make, simply because “heat rises” in the troposphere. (That is how easy the real physics is.) It just falls “down” the temperature gradient (the temperature lapse rate of -6.5K/km), even as much of it is lost horizontally, to wind and “weather”–and it is that (stable) temperature gradient that predominates over all other climate variables, on the global scale. See my 2010 Venus/Earth temperatures comparison (which precisely confirmed the Standard Atmosphere, which in turn is based upon the stable temperature lapse rate as the fundamental, governing reality). “Radiative forcing” from the planetary surface is irrelevant, immaterial, and incompetent, on the global scale.
harry 1:25pm: “.which precisely confirmed the Standard Atmosphere..”
Earth standard atmosphere (avg. LR 6.5K/km) was determined by a committee vote.
“was determined by a committee vote”
So is the Earth’s temperature. !
A very stacked committee with one agenda.