Guest essay by Martin Hovland, Geophysiscist and Professor Emeritus, Center for Geobiology, University of Bergen, Norway
The newly released satellite OCO2-data indicates that there is CO2 input in tectonically active oceanic areas. This becomes evident by pairing seafloor topography and tectonic data with the recently published OCO2-results. Thus, in the released OCO2 dataset, showing the average atmospheric concentration of CO2 over a period of about 6 weeks late in 2014, there are three curious, relatively week, but distinct CO2-hotspots over oceanic regions:
1) The Timor CO2-hotspot
2) the Fiji CO2-hotspot, and
3) the Emperor CO2-hotspot, see Fig. 1.

Using the Smithsonian Volcano database, it is seen that these CO2-hotspots occur above seafloor features which are suspected to issue CO2, CH4 and occasionally large amounts of heat (especially for FH and EH). Here, it can be seen that the TH occurs over a deep-water accretionary subduction wedge. This is a collision zone, where huge amounts of oceanic sediments pile up before they sink into and are swallowed up beneath the island masses to the north (Fig. 2). In such settings, it is well-known that continuous seepage of methane occurs out of the seafloor. Therefore, it is here speculated that the underwater and aerial oxidation of this excess methane gas provides the regional CO2-anomaly detected by OCO2.
The seafloor beneath the FH is also highly tectonized (Fig. 3), but in a completely different fashion to that of the TH. At Fiji, there are both colliding plates and rifting zones. The whole region is highly contorted and there are lots of seepage, both hot vents and cold, methane-dominated vents. Transmittal of methane and CO2 to the atmosphere is likely also here.


Because of the highly tectonized seafloor also underlying the Emperor CO2-hotspot, it is speculated that there is excess CO2 given off by the ocean also in this area. The effect of excess heat and gases seeping out of the seafloor hotspots, was illustrated already in 1988, in Fig. 10.4, by Hovland and Judd (in the book: “Seabed Pockmarks and Seepages: Impact on Geology, Biology and the Marine Environment”). A modified version of this conceptual idea is provided in Fig. 5.

As pointed out before in recent WUWT posts, NASA’s diagram shows a vast colour spectrum differentiation – but of only 15.5 ppm* (between dark blue and dark red). As this is such an infinitely microscopic amount, maybe we should avoid making any early assumptions. I think someone remarked that the whole map may as well be coloured orange.
*For ‘Village Idiot’ (if you’re still about), enter 1M into your calculator (that’s a one and six zeros) then divide by 15.5. Answer: 1/64,516th of the atmosphere. Not a lot then.
…The newly released satellite OCO2-data indicates that there is CO2 input in tectonically active oceanic areas. …
This is a Major Issue! We must legislate against earthquakes immediately!
I propose an Earthquake Tax on all white middle class families living in western countries – the funds to be spent on creating an international committee under the auspices of the UN, which will be tasked with presenting the scientific evidence about how western life-styles are contributing to increased tectonic activity.
Do we have any more well-connected railway engineers looking for a job?
Willis post earlier this week about PH levels doesn’t indicate low PH levels at these co2 spots, so if this is correct co2 is not a cause of ocean acidification.
No, because of the bicarbonate continuation of the reaction increases pH. This is a well known part of Oceanography ocean chemistry documented in text books.
Waters pumped from the divergent ocean ridges is at a pH of around 4.5 but soon reduces to the surface norm.
What is the pH over these areas? The CO2 distribution also underscores that the old pH data set, flawed as it is, is superior to arrogantly naive models based on supposed knowledge of what is happening out there! Trolls and skeptics alike shredded the thread on old pH data and favored the models. Ferd Engelbeem, whom I respect immensely, too, should take note that what he knows about CO2’s real story on earth should not be engraved in granite yet. Dig out the old data, sort it and see if its valuable, don’t go on about glass electrodes and other peripheral indictments of the data. I’ve actually seen similar types of sneering at Sir Isaac Newton by Luddites.
We know a lot about CO2 unfortunately it does not fit with the alarmism.
Why would you expect to be able to see Man’s miniscule addition to all the other sources of CO2?
If CO2 is increasing by 10% per year and it is supposedely all our contribution then how would you see 10% spread out all over the Industrialised nations after subtracting all the Burning etc that goes on in the non industrialised nations?
Agree, not sure this proves or disproves anything about man’s contribution.
Martin Hovland – thanks for a very interesting post. Would you be able to calculate the quantities involved, so as to establish whether the volcanic sources really are a possible cause of the observed pattern? You say the hotspots are relatively weak, but given the relatively slow(?) rate of conversion of methane into CO2, and the relatively quick movement and mixing of the atmosphere, the rate of creation of CO2 at the three places would have to be quite substantial??
Not sure if it’s sarc or not.
seems evident .
the burning of fossil fuels causes increased volcanic activity .
However , Small eruptions now cause a small drop in temperature .
Where is the European hotspot, and the USA hotspot, and the Australian hotspot?
I thought those industrial areas were the places where all the extra CO2 was/is coming from…
Based on this new info/data, what is the cause of the rise in CO2 to 400 ppm in the last century?
“Where is the European hotspot, and the USA hotspot, and the Australian hotspot?”
I realize you’re being ironic, but it’s worth exploring the question. They were assumed, then the voodoo “science” that is economics wove fantastic equations that calculated just how massive the emissions were and how either a carbon tax or cap-and-trade system was required; and all based on a single datapoint (Mauna Loa).
Real data has a nasty habit of blowing up highly theoretical models like that one.
Based on surface station measurements, the European hotspot should show up in December, January, and February when nearly all the Arctic sinks are frozen. Many European sites report monthly averages during these months that exceed 400 ppm. The Arctic is not a source, The high CO2 measurements there during these months is being delivered from the tropics in the upper atmosphere.
The 8-ball says “Too early to tell, try again later”. That’s because a lot of the CO2 is in play in a dynamical oscillation between sources and sinks around a slowly varying (and possibly anthropogenically influenced) dynamical equilibrium, with plants and soils absorbing it and giving it up on a diurnal cycle and seasonal cycle and ocean turnover cycle. Then there is “new” CO_2 being dumped into this oscillator, and “old” CO2 being damped out of this oscillator. Not so easy to attribute or determine what fractions are going where, but there is little doubt that humans have contributed additional CO_2 to add to the system by burning large amounts of carbon. What is at issue is to what extent this extra source is buffered by the sources and sinks in play, and just how long it takes for the extra carbon added to effectively be “sequestered” in the sinks. That, in turn, requires us to have a far better understanding of the biosphere and geosphere than we have, although I think there are those that pretend otherwise.
But data helps! Bring on more data!
rgb
It’s mostly caused by humanity. The volcanic emissions have random variations, but human emissions are increasing steadily. Given the shape of the Mauna Loa curve about half of what is put out by humanity stays in the atmosphere. I suppose we could argue the natural emissions have increased concentration in the past, but the issue always comes down to the debate over what exactly does CO2 do to temperature.
My opinion is that CO2 causes a greenhouse effect, the question in my mind remains over exactly how strong it can be. I suspect it’s not as strong as the IPCC says. I also believe we are running out of fossil fuels anyway. This makes this whole argument a bit useless. Neither India nor China will cut emissions, what other countries do is inconsequential, and if we need to fix the problem it sure looks like geoengineering to sequester carbon in the ocean is more practical. In 20 years oil will be much more expensive and the whole issue will disappear on its own. It’s bs.
Were 500 years listening to what is right or wrong . End of game
Live in peace with delicate wind turbines. Molded with special epoxy resins catalyzed with special hardeners . With special combinations of rare earths…..
@Fernando
“delicate wind turbines?” What if the Chinese decide they are not going to put up with this level of pollution and degradation just to create wind turbines for us? Scroll down and look at what our thirst for rare earth turbine magnets has done to a lake and the local people beside where the rare earths are processed.
Don’t think that just anyone can make rare earths. The process is four-fold from the ore to the end. The fourth stage can only be done by people who know the art of it. The US was #1 in 1984 until Clinton killed off the business in the early 90s by refusing to protect the industry and subsidize it. Now we have to buy most of our rare earths from China because we’ve lost the technology. Your view and understanding of wind turbines is romantic and naive.
“The volcanic emissions have random variations, but human emissions are increasing steadily.”
A) You don’t know how random or systematic they are
B) “Random” does not mean zero mean, or even rapidly varying. Such randomness is only a subset of all possible random processes.
“Given the shape of the Mauna Loa curve about half of what is put out by humanity stays in the atmosphere.”
It does not follow. If sinks are very active, and by the observations they are, then they can take out anything humans attempt to put in quite rapidly. What is left is then necessarily a result of natural forces attempting to equilibrate.
You are basically reiterating the horrifically flawed “mass balance” argument, which many of the naive and inexperienced proffer, and which is an attempt to use algebra to solve a calculus problem.
I dont see the mass balance to be that horrific. It sure makes sense to me. We are the latecomer in the emissions picture, therefore I don’t have a problem attributing the increase to humanity. I’m not into playing shell games with gas molecules.
I also saw the comment that I didn’t know about the level emissions from volcanic sources. That’s true. So what? We know they are variable (I don’t see Siberian traps being formed, therefore it’s safe to say we have a hell of a lot of variability).
Bart – The mass-balance calculation would be absolutely relevant if we could do one. Its problem is not of algebra vs calculus, but with lack of data. We don’t know enough about the sources and sinks of CO2 and how they behave, in order to do a meaningful mass-balance calc. And BTW I doubt that Earth can distinguish between a man-made CO2 molecule and a natural one, so the argument about sinks taking out man-made CO2 and “what is left” is, um, dubious.
The “mass balance” argument is really stupid. It goes like this: the change C in atmospheric concentration is equal to the anthropogenic inputs A and natural inputs N, minus the natural sinks S:
C = A + N – S
We observe that accumulated C is approximately 1/2 of A
C = 0.5*A = A + N – S
implying
N – S = -0.5*A
This is negative, therefore N is less than S, and nature is a net sink, QED.
Gee, that was easy. Rather too easy, in fact. Here is the problem: this is a dynamic system. Although S represents natural sinks, those sinks are elastic, and they expand in response to forcing from both N and from A. In this sense, the sinks are not wholly natural, as a portion of them would not exist if it were not for the anthropogenic forcing A. Thus, we can say that
S = resp(A) + resp(N)
where “resp” designates the dynamic response to A and to N.
Thus, we have
N – resp(N) = resp(A) – 0.5*A
Nature is only truly a net sink if the two sides to this equation are negative. However, there is no guarantee that is the case. The sinks can be very active, such that resp(A) is very nearly all of A, leading to
N – resp(N) := 0.5*A
which is greater than zero, and nature becomes a net source.
All of this is really elementary in the realm of feedback systems. It is a very untutored perspective which leads to acceptance of the pseudo-mass balance argument.
Mike – it is calculus because the response of the sinks depends on the magnitude of forcing, and thus requires solution of dynamic equations.
There is nothing “dubious” about taking out the portion due to anthropogenic forcing. It is not an argument that the sinks treat the sources differently. It is, rather, and argument that the anthropogenic sources are known and finite, while the natural forcing is largely unknown.
Thus, if the sinks are powerful enough, they can take out equally large proportions of human and natural production. Beyond a particular proportion, anthropogenic sources can no longer explain the amount by which observed CO2 has risen, but natural sources, being unknown, can assume whatever quantity is needed to make up the difference.
Bart there is an error in your logic
…
You define C as ….. ” change C in atmospheric concentration :
…
Then you say A, N and S are inputs….
…
You therefore cannot equate a “change” to the sum of inputs and outputs.
Addendum……
…
Units analysis
…
The “change” in atmospheric concentration is in units of ppmv
The inputs A, N and S, are in gigatons
…
You cannot equate ppmv to gigatons.
There is no error in my logic, David.
There isn’t enough space on earth to put up enough windmills to provide the energy we need. Nor the vaulted nuclear option.
Vaunted. You are right about the windmills. Nuclear power could fulfill our energy needs, but it does not appear likely the public would embrace that option, so it is rather moot.
Bart – I thought you were referring to the mass balance concept and saying it was flawed, when you were it seems referring to a particular stupid mass balance argument. I was referring to a full and proper mass balance, which can’t be done because we don’t know how everything works, and saying that if we could do it it would be valuable. In such a calculation, nothing would “take out” anything else, there would be have to be enough understanding to start with of the various sources and sinks and various behaviours, and we would then add further understanding. As climate science stands right now, it ain’t gonna happen.
Mike – you seem to be trying to argue an academic point. If you want to run that way, OK. I gave the “mass balance” argument as it is commonly proffered, as it is provided on the SkS site and elsewhere. My intent was simply to show why it is a dumb argument. And, it is. Just plain dumber than rocks.
Philip,
As rgb already said, that is 6 weeks of data while there is a huge seasonal component in the CO2 levels. Please wait a year and look at the average result over all seasons…
Ferdinand,
Seasonal component? Anthropogenic CO2 is seasonal? Best rethink that one.
There is no reason to imagine that more data will change the picture in regard to that.
It will change. Anthropogenic contribution does change in some areas, and natural contribution changes a lot. Therefore we need a lot of data to try to understand what goes on. It should also impact climate models and the way they estimate greenhouse effect. That science is in its infancy, a lot more data will eventually help.
Fernando:
It is not a question of more data. Anthropogenic CO2 is NOT seasonal.It does does not show now, nor will it show come spring, summer, or fall nor in one, two, or five years. Repeat, anthropogenic CO2 is a NO-SHOW and never will.
Anthropogenic CO2 is too insignificant to register against the background of natural sources.
Nothing.
Hi res image at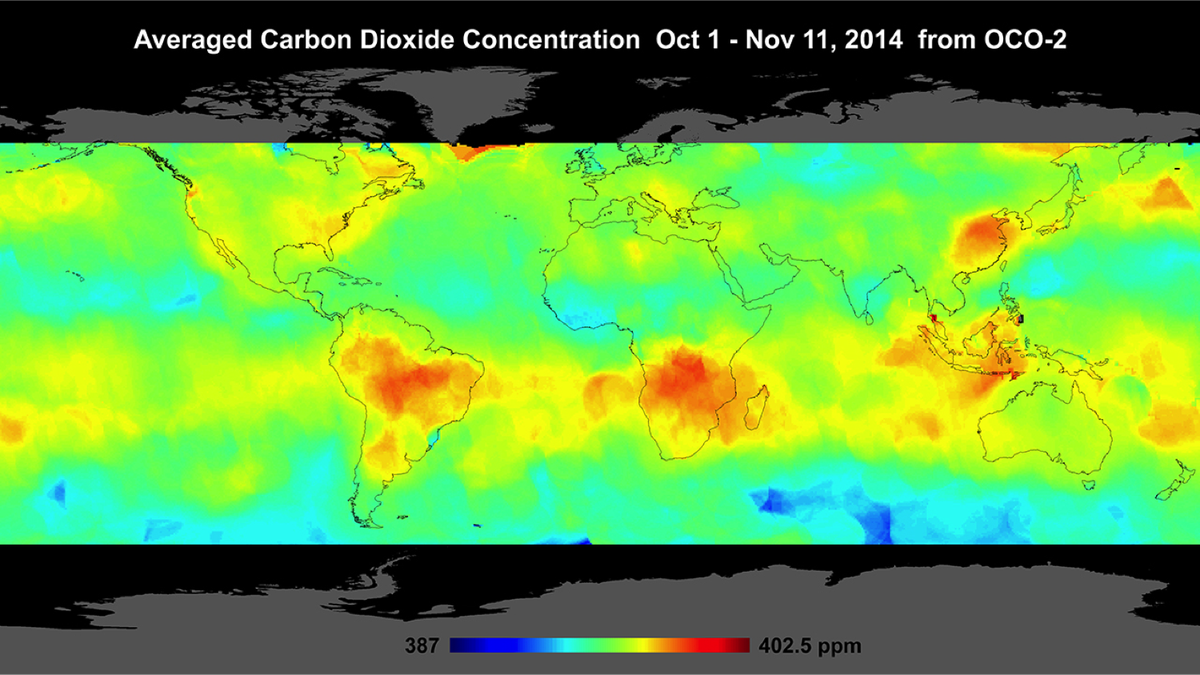
The globalised CO2 concentration is supposed to be 399-400 parts per million & the levels of highest concentrations (red) are only 2.5 parts per million higher. The green tones are half way between 387 & 402.5 ppm, so if it’s a linear scale the CO2 concentration over the UK is 394.75 ppm, by my reckoning.
What’s the problem? The answer must be statistics, more statistics & damn lies. Bring out the tumbrils. Allons enfants de la patrie.
Guys get your pitchforks and scythes ready!!!
(I also know couple of windows in Paris good for defenestrations.)
If this geological CO2 source theory proves to be right we should be ready for a small revolution.
Allons enfants de la patrie!!!!
Sure – while we throw ’em out of the window, will you guard the door?
I think that’s Mauna Loa readings that’s around 400.
Mauna Loa is volcano near an active volcano. Is still say volcanoes produce CO2.
And why are there areas in deep blue , corresponding to the bottom of the displayed range and significantly below the seasonal minima on the Mauna Low CO2 graph provided by Brandon Gates in a post below this .
Do the results reveal oceanic regions of CO2 sequestration or are they just temporary statistical “blips” ( as our politicians assure us whenever we fall into another massive monthly deficit)? Too early to say I suppose.
Martin and all
,pls let me know if ch4 is also measured?
Just a suggestion here: we are looking at these as though they were sources. What if there are processes that reconcentrate the co2 which overwhelm the signal from the sources?
It’s a pretty small range of concentrations so it wouldn’t take much.
Except for china of course. 😉
This will give Monckton something to crow about. Neither side gave his speculation on the importance of undersea CO2 much credit.
rogerknights
You say
Say what!?
For more than a decade I have repeatedly argued in many places including on WUWT that undersea volcanism could be the entire cause of the observed recent rise in atmospheric CO2 as measured e.g. at Mauna Loa. The possible cause is dissolved sulphur and not direct CO2 emission.
This is a link to one explanation of the matter I have provided on WUWT, although it needed me to publish this correction to a typographical error.
Richard
Richard,
What you expect is contradicted by the observations:
– a lowering of the pH by stronger acids expels CO2 out of the ocean surface, which should be reflected in a decrease of total inorganic carbon (DIC) and results in an increase of CO2 in the atmosphere.
– an increase of CO2 in the atmosphere results in an increase of DIC in the ocean surface and a lowering of the pH.
What is observed is an increase in DIC at all ocean points where DIC is measured in the same season over many years (DIC is much easier and more accurate to measure than pH). Thus the net CO2 flux was from the atmosphere into the oceans, not reverse.
Ferdinand
You say
Please show the data for DIC changes at the regions notated TH, FH and EH in the above article which are the subject of this thread.
And a reduction to “net CO2 flux” “into the oceans” would raise atmospheric CO2 concentration if – and they would not be – all other things were unchanged.
Richard
Yes, Ferdinand, please provide the data that Richard asks for.
Richard,
There is a new volcano budding on the sea floor just off of Hawaii.
mpainter
You say to me
Yes, the Hawaiian islands result from a series of volcanoes and the next is forming below the sea near the Big Island.
But Hawaii is a bit extreme: the ocean turns yellow as a result of the sulphur released from the lava stream flowing into the sea from Kilauea.
Richard
Is it just wild eyed prevarication to state the obvious that the NH has become warmer than the SH over the last ~25 years despite the NH appearing to have a lower CO2 concentration than the SH? (i.e. another nail in the coffin for CAGW’s fundamental assumption that CO2 drives temperature?)
http://www.woodfortrees.org/plot/hadcrut4nh/from:1980/plot/hadcrut4sh/from:1980
Typo Patrol notes: “relatively week”.
Egregious comment: Lacking accurate data on the amount of “natural” CO2 emissions, how is it possible to accurately determine the persistence of CO2 in the atmosphere? Assuming we “know” how much atmospheric carbon dioxide is anthropogenic (because we know how much fuel is burned), then if another significant source of atmospheric CO2 is discovered, that would seem to imply less heating/less persistence due to human activity than the models assume, n’est-ce pas?
The drought in South America and Africa show up very clear (drought causes CO2 to rise)…
…There’s a caveat for Indonesia though….Indonesia produced over 5 million tons of cement that year and it’s the darkest red right over the cement plants
Is not consistent
http://www.inmet.gov.br/mapas_agro/2014/11/DI208_bol-m_desvio-prec_201411.png
http://www.inmet.gov.br/mapas_agro/2014/12/DI208_bol-m_desvio-prec_201412.png
As many of you know, there is an excellent database of atmospheric CO2 and its δ13C content available online thanks to the Scripps Institute of Oceanography and its CO2 program (http://scrippsco2.ucsd.edu/data/atmospheric_co2.html). The CO2 data are summarised here: http://scrippsco2.ucsd.edu/images/graphics_gallery/original/co2_sta_records.pdf and all the data can be downloaded and analysed. (Station code names are as follows: PTB = Point Barrow, LJO = La Jolla, MLO = Mauna Loa Observatory, CHR = Christmas Island, SAM = Samoa, and SPO = South Pole.) Other than the differences in the impact of the seasonal cycle, these data show a remarkably consistent pattern in long term CO2 growth (i.e. it is well-mixed) from north to south, with only minor offsets between stations.
We hear (including here on WUWT) that these increasing levels of atmospheric CO2 are due entirely, or almost entirely, to anthropogenic emissions and the steadily decreasing values of δ13C in atmospheric CO2 (currently around -8 per mil) are “consistent with” the increase in CO2 being from anthropogenic sources (having a δ13C of circa -28 per mil).
However, if I apply the so-called Keeling equation to the Scripps data that have been adjusted to remove the seasonal cycle, and hence reflect only the underlying long term trend of increasing CO2 levels, I get an average δ13C of the incremental CO2 of -13 per mil as shown by the intercept values in these example plots for the South Pole (where only a small adjustment is required to remove the impact of the seasonal cycle) and for Point Barrow:
In addition, the data also appear to indicate that the average δ13C content of the incremental CO2 is not changing with time, given the lack of any apparent long term curvature trend in the data.
So my question is: how is this consistent with all (or even most) of the increase in CO2 concentrations being from anthropogenic sources … or … what have I done wrong in the analysis?
The point is that the human (low 13C and zero 14C) is distributed over the other reservoirs. Much is returned by rotting vegetation and seasonal exchanges with the ocean surface over the next years, but none is returned from the deep oceans (not until over ~1000 years). Thus while 13C-poor CO2 goes into the deep oceans near the poles, 13C rich CO2 comes back into the atmosphere from the deep oceans at the upwelling zones near the equator…
Same story for the 14C isotope.
The “dilution” of the human “fingerprint” can be used to estimate the deep ocean – atmosphere exchanges:
http://www.ferdinand-engelbeen.be/klimaat/klim_img/deep_ocean_air_zero.jpg
which gives some 40 GtC/year exchange rate. That was confirmed by the 14C decrease from the 1950’s atmospheric nuclear tests.
The discrepancy in the earlier years is probably from vegetation, which was a slight source of low 13C before 1990, since then a slight sink…
Jim Ross
You ask
There is nothing “wrong” in your analysis which – as you say – indicates that δ13C is NOT “consistent with all (or even most) of the increase in CO2 concentrations being from anthropogenic sources”. Everybody who assesses the isotope data reaches the same conclusion as you.
However, the analysis of isotope changes is not conclusive evidence for a natural cause of the increase in CO2 concentrations because (as e.g. Ferdinand Engelbeen says) the isotope ratio changes may have been diluted.
Simply, the isotope changes suggest a natural cause of the recent rise in atmospheric CO2 concentration but this suggestion may be misleading.
Richard
Richard
Thanks very much for your response (and Ferdinand too). I can see that the isotope ratio of the CO2 growth is not consistent with natural sources alone and that dilution is the most likely cause. But this would suggest that a substantial portion of the increase in CO2 concentration that we see in the atmosphere is not anthropogenic, wouldn’t it? Also, I find explanations that require variations in isotope ratio with latitude a bit hard to swallow, since the data show the same average ratio over time (-13 per mil) at Barrow and the South Pole (as well as at Mauna Loa). The fact that there does not appear to be any change in this average isotope ratio over time seems a bit odd too, since it would presumably require a consistent proportional mixing between anthropogenic and natural sources regardless of the increasing level of anthropogenic emissions. Call me suspicious!
Jim
Jim Ross
I don’t think I have anything to add except to say that we seem to have similar opinions.
Let us be grateful for the new satellite because – at last – we can hope to obtain CO2 data obtained from around the globe by means of consistent equipment and method.
Richard
Richard,
Yes, indeed, I am very interested in seeing further data from the satellite. As a geophysicist myself, I find the gist of the original post of great interest. I guess I am a little disappointed (as a beginner) that the incredible dataset already available at Scripps is largely ignored (or has not been reviewed) by many of the commenters. I do appreciate your comments and, like you, I look forward to the next installment.
Jim
Mod – please delete post as figures did not appear. Looked OK on preview mode.
EH and FH are certainly interesting as they’re not near significant land masses or population centers. TH is another matter entirely as the Lesser Sundas contain a notably dense urban area in Jakarta, and significant agricultural activity — which includes much field burning — throughout Java, Bali, Lombok, Sumbawa, etcwa. There are of course a number of active surface volcanoes throughout Indonesia’s archipelago, with Kelut and especially Merapi on Java being the two most boisterous out of about 130 total active. And this time of year, one decade on, who can miss the similar blotch of CO2 hovering over northwest Sumatra in the Aceh region of late tectonic fame?
Thing is, this region has been tectonically active for a very long time even in geological terms. For at least the past million years it, and other worldwide tectonically active regions, have not managed to produce enough CO2 to raise atmospheric concentrations above 300 ppmv. And yet uncritical respondents to Dr. Hovland’s essay — someone who really should know better — would have themselves and others believe that the Pacific Ring of Fire suddenly woke up at the dawn of the Industrial Revolution and caused a significant portion of the measured 33% increase since then.
Anyone tempted to write “Tambora” or “Krakatau” might first wish to look at the even denser blotch over mainland China. Lotsa volcanoes there you say? Ok, what about sub-Saharan Africa? What is it with Brazil?
You’re still not buying the agricultural burning argument?
https://firms.modaps.eosdis.nasa.gov/firemap/?x=0&y=0&z=2&g=g&v=2&r=0&i=n&l=ad,ct&s=2014-10-01&e=2014-11-11
The attentive reader will note the date range is exactly the same as that of the OCO-2 plot in this post. Those with incurable tunnel vision, well, who knows what might sneak in through the periphery.
Brandon Gates
You assert
The stomata data refute your unfounded assertion which – I assume – is based on misunderstanding of ice core data.
Richard
richardscourtney,
Ok, for starters, show me a CO2 proxy reconstruction for the Holocene you trust. Or we can just go with the instrumental CO2 record. For the “volcanoes is wot dunnit” argument to be not unfounded, I’ll be needing to see some peer-reviewed literature showing a comparable uptick in such activity. As in, not just pretty maps of the Sunda Trench showing hotspots that have been there since before we were even a species. Quantified estimates based on observation are needed here. And they’d better be really good because the bleedin’ obvious source of the observed increase comes down to the basic grade school chemistry regarding the reaction products of hydrocarbon combustion.
Holy cow you lot do enjoy clutching at straws.
Brandon
How do you explain higher CO2 measurement over the South Atlantic Ocean than over USA or Europe? Europe has almost the lowest level on earth.
Need to look at the data for several years before reaching conclusions. It could be something as simple as the water warming up as summer hits the warmest months (January and February are relatively warmest). On the other hand I could be completely off the mark.
Phologiston,
Flux out of the oceans is estimated at 70.6 GtC/yr, human contributions are an order of magnitude less at 6.4:
http://meteora.ucsd.edu/~jnorris/sio117/ipcc_figs/IPCC_7.3small.bmp
Considering also that land sources constitute 119.6 GtC/yr and some of that must waft over the oceans it would be folly to ingore it. So we have the planet itself pushing out ~30x as much CO2 per annum as we do. Given that these are annual mean figures, it’s not too big a stretch to realize that observed seasonal fluctuations over the major natural sinks/sources will easily dominate regional CO2 concentrations and effectively mask human output except in regions with extremely high human population densities and industrial activities. Like East Asia.
Anyone already familiar with the several-years’ old cartoon I posted would not be surprised or confused by 6-weeks of direct satellite observational data. Thus far these data are entirely consistent with expectations.
WordPress doesn’t like .bmp images, same cartoon as a .png:
http://d32ogoqmya1dw8.cloudfront.net/images/earthandmind/posts/anthropogenic_carbon_cycle.png
Slight math fail, I neglected to tack on the 22.2 GtC/yr oceanic flux marked by the red arrow, indicating the estimated increased output since preindustrial times.
Make that 20, not 22.2. I might want to drink more coffee, or just stop posting for today …..
I’ve put this elsewhere but it beats repeating:
There is NO seasonal component to anthropogenic CO2. No sense in speculating that this will show up in later data.
mpainter,
There is, however, a seasonal component to overall flux as this image makes abundantly clear:
http://www.zeeburgnieuws.nl/nieuws/images3/mlo_two_years_2014_march_18.jpg
Notice that the swing is just shy of 10 ppmv. Review the image Dr. Hovland provided at the top of his post, and notice that the range of the color scale is 15.5 ppmv, or 55% greater than the expected annual range. Now go to the carbon budget cartoon and note that natural CO2 fluxes are 33 times greater than anthropogenic.
Nobody who is numerate, sane, honest and actually familiar with the data would expect to see anything much more than 1 in 33 pixels on the CO2 map showing up as a clear anthropogenic flux except maybe where people are crammed into the real estate like sardines. Nor would such a thinking and well-informed person jump to conclusions based on 6 weeks of data knowing darn well that there are regional and global fluctuations on the orders of tens of CO2 ppmv on a seasonal basis, all dominated by natural sinks and sources, which aren’t represented in that plot.
Finally, anyone with even a passing familiarity with historical CO2 proxy data and geology would read this post and the comment thread, look at the following chart courtesy of Ferdinand Engelbeen and say, “That’s a lotta’ darn volcanoes, you’d think someone would have noticed!”:
http://www.ferdinand-engelbeen.be/klimaat/klim_img/antarctic_cores_001kyr.jpg
But most people of average intelligence and a healthy amount of intellectual honesty would notice the similar shape of these curves to what’s showing up in the CO2 records, and being rational would say to themselves, “Self, I think we have the obvious answer.”:
http://cdiac.ornl.gov/trends/emis/graphics/global.total.jpg
YMMV.
It’s in the data we’ve already GOT, there’s no need to speculate. The map you’re beating senseless here does not, will not ever, show you what it is you’re looking for as you are interpreting it. From prior work already done, nobody with proper understanding is expecting or predicting OCO-2 to show red only over Houston and green over the central Pacific.
Brandon
Thanks, in a way I’m relieved by your explanation. So anthropogenic input even though a small fraction of natural fluxes, can elevate atmospheric CO2. The Pleistocene has experienced periods of CO2 starvation, and the evolution of C4 plants attests to low CO2 stress. And you will be familiar with the paper by Franck predicting eventual biosphere extinction by CO2 starvation due to geological weathering. Thus our survival and the health of the biosphere may well depend on our ability to maintain a life- supporting CO2 level. Indeed it is already clear that the health and vitality of the photosphere is currently being boosted by increasing atmospheric CO2.
However if the small relative flux of anthropogenic CO2 was so well known and these satellite results so “expected” then why was the simulated CO2 levels in this German study:
http://wattsupwiththat.com/2014/11/18/who-needs-an-orbiting-carbon-observatory-when-you-can-model-of-carbon-dioxide/
So totally at odds with the OCO results. We’re these predictions simulated but not “expected”?
B Gates.
Then we agree that anthropogenic CO2 does not vary seasonally and that the grand, orbiting carbon detector (that our wonderful gummint has so thoughtfully provided) cannot detect anthropogenic CO2 above the background of natural CO2.
“Ye shall know the truth and the truth shall make you free”
Phlogiston,
Not exactly breaking news but yes.
I assume the ones that weren’t in the freeze zones when insolation dropped at high northern latitudes, followed by CO2 down to 180 ppmv.
Never read it. Sounds somewhat alarmist.
On what sort of time frame come these dire predictions of doom?
Some like it hot, no doubt about it.
All models are always wrong. Best practice is to go out and measure. Why are you setting me up to deliver YOUR lines for you? I mean, I’m happy to fill in the blanks with sound scientific practice, but it seems an odd rhetorical strategy for you to just lay them out there like that.
mpainter,
I haven’t looked, but actually I’d be surprised if there wasn’t a seasonal variability. Cooling, heating and whatnot. It’s just not terribly important for purposes of this conversation.
We definitely don’t agree on that. I don’t know what that bird is going to be capable of doing, I wouldn’t make decisions on the first data release and I’m content to wait and see before making a fool out of myself blathering on and on about stuff I don’t know much about.
What I do know is we didn’t need that sat to tell us that human activity is responsible for the rise of CO2, that’s been in the literature for decades. This mission, as I presently understand it, is more about understanding sources and sinks so that we can better estimate the effects of future increases. You know, real world data to feed the models and/or validate them. Otherwise known as good science.
“For at least the past million years it, and other worldwide tectonically active regions, have not managed to produce enough CO2 to raise atmospheric concentrations above 300 ppmv.”
Who says this is a stationary process?
Bart, I never said stationary, but if you guys are trying to explain the Keeling curve with volcanoes it sure as heckfire is pretty regular and well above the baseline volcanic activity prior to the 19th century. Our resident geologist has gone dark on us so, well, I guess it’s up to you guys to pick up the slack.
You are implicitly relying on stationarity to imply that you believe it should not be influential now as, you assert, it was not influential before.
I find your childish games tiresome, Brandon.
Bart,
Nope. Try dealing with the words I write, not the ones you want me to be writing. This is the signal we’re looking at:
http://climexp.knmi.nl/data/ico2_monthly.png
Your end of the argument is to provide evidence that volcanoes are responsible for the rise from 280 to nearly 400 ppmv in a period of about 200 years. Or conversely provide evidence that the CO2 record is not accurate and is more consistent with some measurable volcanic activity. Either way, you need to pony up the evidence linking volcanic activity to CO2 levels.
I think your playground perspective goes a long way toward explaining why neither you, nor richardscourtney, nor mpainter have been able to provide a lick of additional evidence that what comes out the tailpipe of my car is not more responsible for CO2 levels than undersea vents.
Whoosh!
Bart, you said it.
Brandon Gates
You reply to my accurate statement that your assertion is wrong by saying
OK. That response fails to mention the fact that YOUR ASSERTION IS PLAIN WRONG but attempts to change the subject to two other – and irrelevant – matters.
Holy cow you warmunists do enjoy clutching at straws when shown to be wrong.
Richard
richardscourtney, That word “assertion” you keep using, I do not think it means what you think it means. Come on now, pony up the true CO2 level from pre-industrial times, and show me the tectonic research required to explain any rise in CO2 since then.
Brandon Gates
I see you are still arm-waving in attempt to avoid admitting your untrue assertion was not true and is not true.
I recap.
At January 2, 2015 at 6:56 am I replied to you saying in total
At January 2, 2015 at 8:06 am you replied by saying in total
That daft attempt at evasion was accompanied by your snowing this sub-thread by much irrelevant – although correct – data which you copied & pasted from elsewhere.
Your method of evading admitting your error may work elsewhere, but here on WUWT we are familiar with spotting it because another professional troll (who posts as Phil.) has been using the same method for years on WUWT.
You made an untrue assertion. Admit it and we can move on.
Richard
richardscourtney, I know that when you start using the word daft that you’re pretty much out of anything substantive to say. Thanks once again for demonstrating that you think your own failure to support your own arguments is anyone’s fault but your very own. Ta.
Brandon Gates
Your daft assertion was wrong and is wrong.
As I said, it is refuted by the stomata data.
Your evasions, your insults, your irrelevant twaddle, and your bluster demonstrate to all that you know your daft assertion was wrong and is wrong.
Admit your error and we can move on.
Richard
richardscourtney,
Don’t tell me I’m in error, show me where I’m in error. Do that and we can move on.
Brandon Gates
Excuse! Excuses!
You wrongly asserted
I replied
Following your posting an incredible amount of absolute bollocks which attempted to pretend your assertion is not plain wrong, you now say
OK. I will accept that you are as ignorant as you now claim to be because your claim concurs with your failure to yet demonstrate you know and understand anything about climate change.
As introduction to the subject, I suggest you read this WUWT article, then search for papers on stomata as proxies by Wagner.
In the link I have provided please note the graph which compares atmospheric CO2 concentration over the period from 1800AD to 2009AD as indicated by Law Dome ice core, stomata data, and direct chemical analyses (as collated by Beck).
That graph alone indicates your assertion is wrong for the reason I stated.
Now, you could claim that you were saying the high CO2 indications were from something other than volcanism, but nobody knows what caused the high indications so that would be merely a compounding of your error.
Admit your error and we can move on.
Richard
Brandon:
“Assertion” means baseless opinion; something you assert to be a fact, but which is usually highly debatable. Your gang depends on assertions to support your arguments. See the problem?
And re: rising CO2, you seem to be operating under the mistaken belief that more CO2 is a bad thing. That’s just another baseless assumption. By all the available evidence, more CO2 is a net benefit to the biosphere. There is no observed downside.
If the alarmist crowd would accept that one fact, and the lack of any global harm resulting from more of that beneficial trace gas, we would all be on the same page.
But you cannot agree to that, for one simple reason: if you did, your entire ‘carbon’ scare would have taken about 4 – 5 torpedoes; it would go down fast.
Since your overly sensitive egos are the real reason you argue, and not due to any observed evidence, skeptics will never be able to change your minds. Enough time will have to pass for the True Believers in CAGW to die out, leaving a more rational group of scientists to point out that CO2 is entirely harmless, at current and projected concentrations.
You cannot accept that. But where is your evidence of any global harm?
richardscourtney,
Thank you for the citation, see that wasn’t hard at all. Here’s Wagner et al. (1999): http://www.sciencemag.org/content/284/5422/1971.full
Abstract
The inverse relation between atmospheric carbon dioxide concentration and stomatal frequency in tree leaves provides an accurate method for detecting and quantifying century-scale carbon dioxide fluctuations. Stomatal frequency signatures of fossil birch leaves reflect an abrupt carbon dioxide increase at the beginning of the Holocene. A succeeding carbon dioxide decline matches the Preboreal Oscillation, a 150-year cooling pulse that occurred about 300 years after the onset of the Holocene. In contrast to conventional ice core estimates of 270 to 280 parts per million by volume (ppmv), the stomatal frequency signal suggests that early Holocene carbon dioxide concentrations were well above 300 ppmv.
The concluding paragraph of the paper reads: Our results falsify the concept of relatively stabilized Holocene CO2 concentrations of 270 to 280 ppmv until the industrial revolution. SI-based CO2 reconstructions may even suggest that, during the early Holocene, atmospheric CO2concentrations that were >300 ppmv could have been the rule rather than the exception (23).
Could have been the rule, not definitely were the rule. Quite confident that there were deviations above 300 ppmv during the Holocene as shown by the proxy method, not confident that those elevated concentrations were stable at that level.
Now a later paper, Wagner et al. (2002): http://www.pnas.org/content/99/19/12011.full Essentially the same conclusions as the 1999 work, but with this interesting passage: Our CO2 reconstructions reflect rapid changes with a significantly greater magnitude than the smooth and modest atmospheric CO2 decline to values 260 ppmv inferred from the low-resolution Taylor Dome ice-core record (Fig. 2). The data also confirm the regular occurrence of early Holocene atmospheric CO2 concentrations well above 300 ppmv, unknown from Antarctic ice cores but common in leaf-based time series (9, 14). These apparent controversies between leaf-based and ice-based CO2 data have not been resolved yet (ref. 35; see text at http://www.sciencemag.org/content/286/5446/1815.full). It should be noted that early Holocene records from Greenland ice cores have repeatedly indicated rapidly fluctuating CO2 levels including values 300 ppmv (36, 37). At present, the Antarctic record is usually considered to be reliable, so that discrepancies are ascribed to CO2 enrichment within the Greenland ice (38, 39). However, there is evidence that in polar ice also postdepositional CO2 depletion could occur, but underlying chemical processes of this potential source of error have not yet been investigated in detail (38, 39)
Following the link to ref. 35, we read: Ice-core CO2 measurements are direct measurements on air that has been enclosed in bubbles. The occurrence of artefacts in earlier ice core records mainly from Greenland drill sites [enrichment of CO2 due to chemical reactions in the ice; depletion of CO2 due to fractionation during clathrate formation (5)] can be avoided by careful sample selection. In the Taylor Dome ice core we found no indications of chemical reactions producing additional CO2, and no clathrates occur (3). This record clearly shows that an atmospheric CO2 concentration from 260 to 280 ppmv was the rule during the preindustrial Holocene, including the early Holocene. We do not want to question the SI method, but we notice that there is a fundamental discrepancy between the record of Wagner et al. and the stomata density–based CO2 record of Beerlinget al. (6), who report largely scattering proxy CO2 values from 225 to 310 ppmv between 9940 and 960014C-yr.
Wagner et al. claim that the concept of relatively stable Holocene CO2 concentrations of 270 to 280 ppmv until the Industrial Revolution is falsified by their results. We believe that this conclusion is not justified.
Suddenly this is not sounding so cut and dried as you would have us believe, and Wagner himself says as much. But he’s not done: http://www.geocraft.com/WVFossils/Reference_Docs/Holocene_CO2_stomata_Wagner_etal_2004.pdf
Abstract
The majority ofthe stomatal frequency-based estimates ofCO2 for the Holocene do not support the widely accepted concept of comparably stable CO2 concentrations throughout the past 11,500 years. To address the critique that these stomatal frequency variations result from local environmental change or methodological insufficiencies, multiple stomatal frequency records were compared for three climatic key periods during the Holocene, namely the Preboreal oscillation, the 8.2 kyr cooling event and the Little Ice Age. The highly comparable fluctuations in the palaeo-atmospheric CO2 records, which were obtained from different continents and plant species (deciduous angiosperms as well as conifers) using varying calibration approaches, provide strong evidence for the integrity of leaf-based CO2 quantification.
Skipping down to the conclusion:
3.Conclusions
The successful replication of stomatal frequency records in terms of timing and duration in the seven compared records provides strong evidence for the integrity of the leaf-based proxy for atmospheric CO2 concentrations. The general coherence ofthe reconstructed amplitudes ofatmospheric CO2 fluctuations corroborates the assumption that a wide range of terrestrial plants shows a common response to this environmental factor independent of geographical setting, habitat conditions or taxonomy. The agreement between stomatal frequency records from the Atlantic realm and sites located in the Pacific Northwest ofthe USA indicates that the observed stomatal parameter shifts are not restricted to the circum North Atlantic sector, but are at least Northern Hemispheric in nature. The demonstrated ability of stomatal frequency analysis to generate independent but highly comparable proxy records clearly meets the requirements for a palaeo-proxy in the field of global atmospheric CO2 dynamics.
Gone is the language in the 1999 paper about falsification of a relatively stable Holocene, replaced with “we think our results are robust enough to show that stomatal frequencies are useful CO2 proxies.” I also can’t help but note that all these papers read like a treemometer study in terms of language and general modeling technique, so I’m a little surprised that, I don’t know, directly measuring CO2 trapped in ice core bubbles isn’t considered the more reliable technique.
It is interesting research however, I thank you for pointing me toward it.
Now, for sake of argument let’s assume Wagner is correct. He does not mention volcanoes as causal, but talks about meltwater pulses and other things. I’m still looking for some geology work which shows CO2 levels at present being driven by volcanic activity. Even better would be for some significant portion of the Holocene. This is the intitial issue I’ve raised, and while all this other stuff is interesting, it still does not directly address the main question I have been asking.
dbstealey,
Plant leaf stomatal frequency vs. ice core analysis for CO2 is a point of debate. That is why I asked for and insisted that Richard provide citations.
I’m asking you guys to substantiate your controversial musings that undersea volcanic vents have caused the significant rises in CO2 we’ve seen since the beginning of the industrial revolution. Suddenly, you are trying to change the subject. One wonders why that might be the case.
Brandon Gates
You write to dbstealey
NO! HOW DARE YOU!
You “insisted” on no such thing. As anybody can see, you went to extremes to avoid the issue of the stomata data which I raised, and I proffered the information and fed it to you when – eventually – I forced you to consider the issue.
There is no “debate” – none, zilch, nada – that the stomata data provide indications of past values of atmospheric CO2 concentration greater than the 300 ppmv which you wrongly asserted did not exist. There is “debate” about reasons for the differences between the ice core proxies and stomata proxies .
You made an untrue assertion. Your assertion having been shown to be wrong, you still try to bluster because you cannot bring yourself to admit your error and to learn. That indicates you really are a sad act.
Richard
richardscourtney,
Ok, there’s that tender spot …
No “debate”? Ok sure, “controversy” is more like it. And I requote from above, straight from the horse’s mouth: http://www.pnas.org/content/99/19/12011.full
These apparent controversies between leaf-based and ice-based CO2 data have not been resolved yet (ref. 35; see text at http://www.sciencemag.org/content/286/5446/1815.full).
Second link goes to the peer-reviewed rebuttal which basically says, “Wagner’s approach isn’t something we think is complete bunk, but falsification of Holocene CO2 stability is a mite bit too strong a word.”
I’d be cranky too having painted myself into such a corner. What’s the next move? Wait for it to dry and wander off pretending it didn’t happen, build a stone wall, or come clean that this isn’t such a clear cut issue as you would have me believe?
Brandon Gates
Yes, I do have a “tender spot” at trolls telling blatant lies.
You lied that you had “insisted” I provide references when – in reality – you went to extremes to avoid the subject and I proffered references although you had not asked for any.
There are two possible reasons for your having tried to avoid the issue; viz.
you had never heard of the stomata data
or
you knew I was right that the stomata data refuted your untrue assertion.
Personally, I think you had never heard of the stomata data because your many posts have yet to demonstrate you know and understand anything about climate change. However, I accept the possibility that you were trying to avoid your assertion about past atmospheric CO2 concentration being revealed as a lie.
Now, having been shown to have lied about your “insisting” on references, you try to deflect from your lies by providing quotes out of context as a method to misrepresent the data issues.
Clearly, I was incorrect when I suggested you are a sad act; I should have said you are a sad and a nasty act.
Apologise for your lies and we can move on.
Richard
The whole world map including USA is at the earlier Ron Voisin post:
http://wattsupwiththat.com/2014/12/29/three-scenarios-for-the-future-of-nasas-orbiting-carbon-observatory/
Did they cut off the USA out of embarassment at so little CO2 over the great satan of pollution and consumption?
Since most skeptics believe that the dramatic rise from 300 ppm to 400 ppm of CO2 in the last 100 years has caused no dramatic global warming, no increase in droughts, no decrease in global sea ice, no significant decrease in global land ice, no significant sea level rise, no decrease in fall/winter snow cover extent, no significant change in ocean pH, no increase in cyclonic activity/energy, no increase in extreme weather events, etc.
What then is your/their hypothesis/theory as to what might change due to this CO2 increase? Is there something measurable and alarming which will be caused by this dramatic increase in CO2 concentration? – Something that can really alarm us? Any good theories from you scientists?
(We do know that it helps plants grow – does that have any down side?)
I do wonder about the droughts. That sure seems like it’s grabbed out of thin air. A warmer surface implies more rain. Now you have to argue it’s quite selective in where it falls. Once I have seen precipitation data taken for real by a party I can trust we can discuss the issue and what we ought to do about it.
Ice cores have a lot of dust during cold periods. The simplest explanation is that a cooling leads to a desertification.
Is there something measurable and alarming which will be caused by this dramatic increase in CO2 concentration?
==============
a lot of democratic politicians lost office because of the lack of it.
If there indeed was no increase in any probable disaster, why do people who call themselves “skeptics” don’t accept the obvious evidence that humans are responsible for the increase of CO2 in the atmosphere?
Including drawing firm conclusions from plots of 6 weeks of CO2 data, while one need 1-3 full years before a human signal can be filtered out of the huge seasonal noise?
It is like looking at one week of tidal data after full moon and conclude that the sea level is dramatically falling…
We tend to reject bad science. Period. These preliminary OCO data contradict “scientific” models beyond a preliminary doubt.
Because it was once “obvious” that the planets moved in circles about the Earth, or that “bad air” caused disease, or a host of other mistaken beliefs.
Because, when you look deeper into the data, it becomes quickly apparent that the “obvious” answer is wrong.
Ferdinand, there are degrees of skepticism. What happens is that we have a huge war going on, and there’s a lot of garbage flying to smear skepticism. There seems to be a nearly religious and dogmatic approach by some (for example the SKS site) to carry on a heavy smear against anybody who dares deviate from the accepted revelations brought to humanity by Saint Michael, Saint James, Saint Christiana, and the prophets who run the IPCC, may Ban Ki Moon bless them.
Yes, Ferdinand,
I for one suspect that your desire to “filter” out the “human signal” will lead to more data fabrication.
We have all of the data we need to reach the obvious conclusion.
However much you might hope, anthropogenic CO2 cannot be detected by this satellite.
Ferdinand,
Most skeptics do accept that human activity is the cause of rising CO2.
But until verifiable evidence of global harm from that rise is presented, it is simply a non-event.
CO2 is a tiny trace gas at 300 ppm — and it is a tiny trace gas at 400 ppm. Neither concentration has caused any global harm.
So what’s the problem?
As a long time climate skeptic from Bergen, Norway, it’s a god damn pleassure to see real science being done around these parts. Because the bigger narrative is doom science funding, and climate change intervowen with political correctness, enought to make any healty human puke.
Bergen is one of the prettiest towns in the world. If I had to pick a place to invade and take over it would be near the top of my list. As the new Bergen overlord I would move into that spectacular castle, and from there look over my fleet, anchored at the foot of the cliff.
No army could invade this place. The viking secret is that we agrue all the time but band together when som foreigner comes along. The movie 13th warrior http://www.imdb.com/title/tt0120657/?ref_=fn_al_tt_1 is a fictional movie based on a real arab writer that followed the vikings around on their invading trips, amazed by that very sentiment. Now that is bullshit in daily life but really good when you need it.
Ha, Bryggen and Edvard Grieg’s house. Marvelous town (be it with lots of rain…). But alcohol far too expensive…
Too expensive? Then that’s a deal-killer right there…
For those who still believe that hydrocarbons are fossils, read “The Deep, Hot Biosphere” by
Thomas Gold to help you understand the source of the massive amount of CO2 rising from these
hot zones.
I also agree with richardscoourtney. Ice core readings of CH4 are useless. stomata data is a
much better indicator.
Stomata data are proxies, ice core data are direct atmospheric measurements, be it from a mix of several (10-600) years, depending of the snow accumulation rate.
Stomata data are calibrated against ice cores…
Ice core data thus may miss the fast changes in CO2, which may be captured by stomata data, but averaged data doesn’t change the average over the period of resolution. If stomata data show a different average CO2 level over the same time frame, then the stomata data are certainly wrong…
Ice core data are proxies – they do not contain thermometers, for example. Very little is known about a diffusion over millennia. I agree with you, they are still extremely useful,
Jerry Henson, Thomas Gold plagiarized Dr. JF Kenney’s work: http://www.gasresources.net/plagiarism%28overview%29.htm/
You can use the side panels here to read Dr. Kenney, et al, work.
http://www.gasresources.net/introduction.htm/
I consider Thomas Gold a crank. Hydrocarbons WE produce are fossil fuels. I laughed my behind off when I read his proposal to go look for oil at Syljan (warning: I worked in the oil business for almost four decades).
Fernando — current state-of-the-art in “Birth of the Solar System Modelling” doesn’t allow for water or methane in the inner solar system — hence all of our carbon, hydrogen and lot of our oxygen is presumed to come from asteroid collisions and cometary impacts after the earth had formed
If that is the case why can’t we have a carbon – rich relatively large body impact igneous rock on the earth’s surface leading to:
1) fracturing and pulverization of both th the igneous earth rock and the astro rock
2) injecting carbon-rich material deep into the earth’s crust
3) bacteria? presumably processing the material leading to a deposit of CH4 and CO2
4) seepage through the shattered rock leads to these gases becoming dissolved in ground water
5) several reports of “Burning water” in wells in Sweden
I think something like the above was part of the “Gold” geo-model for Methane
Fernado…..
How does Gold account for the bio-markers in petroleum ?
Specifically pristane, phytane, steranes, triterpanes and porphyrin.
Westhighlander:
Do yourself a favor and forget about all of that phantasmagoria.
Should read CH4 and CO2 not reliable in ice cores.
None, NONE, of this would be surprising to a person grounded in Plate Tectonics, Seafloor Spreading, or Subduction. This, the most ignored or misunderstood aspect of the carbon cycle, dealing in amounts that make mankind’s contribution less than trivial. And to sit and watch as the alarmist buffoons flail away at reason and sanity, while millions of black smokers inject all manner of nutrients into the oceans, as vast tracts of formerly marine limestones get converted to marble, or as carbonatite lava sloshes out of East African Rift volcanoes… It is all one can do to quietly facepalm as yet another plebe with zero life experience and even less knowledge of earth history utters another tome on how some bug or lichen or sea slug is going bye-bye because of global warming caused by virtually zero CO₂.
NASA is going to have a cow and an aneurism over this orbiting theory-wrecking eye in the sky.
+1… They wouldn’t have launched this thing if they knew. Something was wrong with the numbers. They supposedly could tell which co2 was which by the ratio of co2 isotopes. It’d be a surprise if the co2 being released in the oceans has the same or near ratio balance as fossil fuel. Now NASA says with they can’t tell which co2 is which, natural or man made. I think if the earth is releasing more co2, we need to know why, and not more conjecture by the AGW crowd. By the same crowd of people, tropical forests are thriving, taking up much more, 30% more. In fact it surpasses all of the northern forests combined. Which they thought was the reverse.
BTW, somebody in NASA isn’t going to have a cow … LOL. prior to this particular argument, the LIA and MWP were big topics. Some people went out and drilled in a lake in China, and off the coast of Peru. I don’t recall of them, however it was AGW position that both the LIA and MWP were local and not world wide. In every single drill it confirmed not only those two events but others as well. CAGW should have died a slow death then. It is zombie like and has acquired a life of its own through belief. Those 2 events are close enough and documented that the comparison of the hockey stick chart, showing the relation of co2 with temperature couldn’t possibly be right.