“…startling data omission that he told me: “eclipses even the so-called climategate event.””
Willis Eschenbach tips me to a story by Marita Noon, titled:
What if Obama’s climate change policies are based on pHraud?
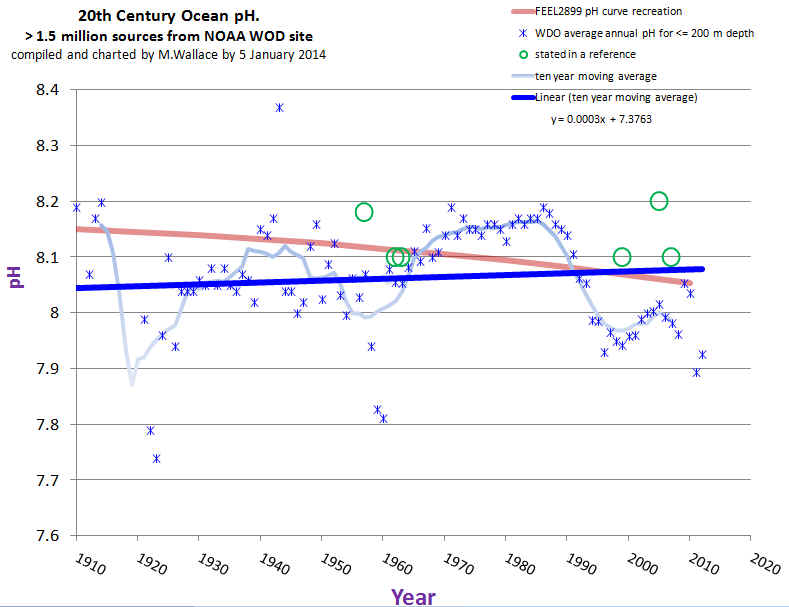
I’ve reproduced portions of it here, with a link to the full article. The graph with ALL the data is compelling.
“Ocean acidification” (OA) is receiving growing attention. While someone who doesn’t follow climate change science might think OA is a stomach condition resulting from eating bad seafood, OA is claimed to be a phenomenon that will destroy ocean life—all due to mankind’s use of fossil fuels. It is a foundational theory upon which the global warming/climate change narrative is built.
The science and engineering website Quest, recently posted: “Since the Industrial Revolution in the late 1700s, we have been mining and burning coal, oil and natural gas for energy and transportation. These processes release carbon dioxide (CO2) into the atmosphere. It is well established that the rising level of CO2 in our atmosphere is a major cause of global warming. However, the increase in CO2 is also causing changes to the chemistry of the ocean. The ocean absorbs some of the excess atmospheric CO2, which causes what scientists call ocean acidification. And ocean acidification could have major impacts on marine life.”
Within the Quest text is a link to a chart by Dr. Richard A. Feely, who is a senior scientist with the Pacific Marine Environmental Laboratory (PMEL)—which is part of the National Oceanic and Atmospheric Administration (NOAA). Feely’s climate-crisis views are widely used to support the narrative.

Feely’s four-page report: Carbon Dioxide and Our Ocean Legacy, offered on the NOAA website, contains a similar chart. This chart, titled “Historical & Projected pH & Dissolved Co2,” begins at 1850. Feely testified before Congress in 2010—using the same data that shows a decline in seawater pH (making it more acidic) that appears to coincide with increasing atmospheric carbon dioxide.
…
The December edition of the scientific journal Nature Climate Change features commentary titled: “Lessons learned from ocean acidification research.”
However, an inquisitive graduate student presented me with a very different “lesson” on OA research.
Mike Wallace is a hydrologist with nearly 30 years’ experience, who is now working on his Ph.D. in nanogeosciences at the University of New Mexico. In the course of his studies, he uncovered a startling data omission that he told me: “eclipses even the so-called climategate event.” Feely’s work is based on computer models that don’t line up with real-world data—which Feely acknowledged in email communications with Wallace (which I have read). And, as Wallace determined, there is real world data. Feely, and his coauthor Dr. Christopher L. Sabine, PMEL Director, omitted 80 years of data, which incorporate more than 2 million records of ocean pH levels.
Feely’s chart, first mentioned, begins in 1988—which is surprising as instrumental ocean pH data has been measured for more than 100 years since the invention of the glass electrode pH (GEPH) meter. As a hydrologist, Wallace was aware of GEPH’s history and found it odd that the Feely/Sabine work omitted it. He went to the source. The NOAA paper with the chart beginning in 1850 lists Dave Bard, with Pew Charitable Trust, as the contact.
Wallace sent Bard an email: “I’m looking in fact for the source references for the red curve in their plot which was labeled ‘Historical & Projected pH & Dissolved Co2.’ This plot is at the top of the second page. It covers the period of my interest.” Bard responded and suggested that Wallace communicate with Feely and Sabine—which he did over a period of several months. Wallace asked again for the “time series data (NOT MODELING) of ocean pH for 20th century.” Sabine responded by saying that it was inappropriate for Wallace to question their “motives or quality of our science,” adding that if he continued in this manner, “you will not last long in your career.” He then included a few links to websites that Wallace, after spending hours reviewing them, called “blind alleys.” Sabine concludes the email with: “I hope you will refrain from contacting me again.” But communications did continue for several more exchanges.
In an effort to obtain access to the records Feely/Sabine didn’t want to provide, Wallace filed a Freedom of Information Act (FOIA) request.
In a May 25, 2013 email, Wallace offers some statements, which he asks Feely/Sabine to confirm:
“…it is possible that Dr. Sabine WAS partially responsive to my request. That could only be possible however, if only data from 1989 and later was used to develop the 20th century portion of the subject curve.”
“…it’s possible that Dr. Feely also WAS partially responsive to my request. Yet again, this could not be possible unless the measurement data used to define 20th century ocean pH for their curve, came exclusively from 1989 and later (thereby omitting 80 previous years of ocean pH 20th century measurement data, which is the very data I’m hoping to find).”
Sabine writes: “Your statements in italics are essentially correct.” He adds: “The rest of the curve you are trying to reproduce is from a modeling study that Dr. Feely has already provided and referenced in the publication.”
In his last email exchange, Wallace offers to close out the FOIA because the email string “clarified that your subject paper (and especially the ‘History’ segment of the associated time series pH curve) did not rely upon either data or other contemporary representations for global ocean pH over the period of time between the first decade of 1900 (when the pH metric was first devised, and ocean pH values likely were first instrumentally measured and recorded) through and up to just before 1988.” Wallace received no reply, but the FOIA was closed in July 2013 with a “no document found” response.
Interestingly, in this same general timeframe, NOAA reissued its World Ocean Database. Wallace was then able to extract the instrumental records he sought and turned the GEPH data into a meaningful time series chart, which reveals that the oceans are not acidifying. (For another day, Wallace found that the levels coincide with the Pacific Decadal Oscillation.) As Wallace emphasized: “there is no global acidification trend.”

Regarding the chart in question, Wallace concludes: “Ocean acidification may seem like a minor issue to some, but besides being wrong, it is a crucial leg to the entire narrative of ‘human-influenced climate change.’ By urging our leaders in science and policy to finally disclose and correct these omissions, you will be helping to bring honesty, transparency, and accountability back where it is most sorely needed.”
“In whose professional world,” Wallace asks, “is it acceptable to omit the majority of the data and also to not disclose the omission to any other soul or Congressional body?”
Full story here: http://www.cfact.org/2014/12/22/what-if-obamas-climate-change-policies-are-based-on-phraud/
There’s a petition: http://www.ipetitions.com/petition/restore-the-worlds-ocean-ph-measurements
It should also be known that the neutral pH point of water is not per definition 7. It’s temperature dependent. The warmer it gets the more water molecules join the ion game:
H2O OH- + H+
As the total amount of ions increase and pH is inverse logaritm, the neutral point pH value decreases. See here:
http://chemwiki.ucdavis.edu/Physical_Chemistry/Acids_and_Bases/Aqueous_Solutions/The_pH_Scale/Temperature_Dependent_of_the_pH_of_pure_Water
It’s not much, but as the oceans have warmed slightly, the pH dropped slightly without changing the acidity/alkalinity.
Happy belated Merry Christmas
So how, over the course of a few decades did “Science” decide that Carbonates now the dominating buffer system in the oceans? I know it’s been a lot of years since I studied Aquatic Chemistry, but I suspect that Silicates are still the dominating oceanic buffer system and Carbonates have only minor effects. Freshwater is entirely a different story.
I’ve got to agree that historical measurements of various ionic species are probably a better record than that of GEpH. Still, if all the records were pulled together, it ought to be possible to assess the likely pH error of those old measurements. That is, if you know the seawater composition (chlorides, silicates, carbonates, etc) you should have a very good way of estimating the “real” pH vs the measured value.
Finally, a quibble about the graph that started this entire argument. So many years ago, when I was studying aquatic chemistry, the convention was always that the small “p” was used to indicate the negative log of concentration. If we were talking about something like dissolved CO2 in terms of partial atmospheric pressure, the convention was a large “P” followed by the dissolved gas as a subscript. I got raked over the coals by my graduate advisor for making that mistake, and didn’t do it again. Equilibrium values of Pco2 and pCO2 look completely different when plotted against system pH.
1. The ten-year moving average line in the second (Wallace) chart is clearly wrong or seriously misleading. How can the average value of the last ten years exceed the highest value measured during that ten-year span?
2. Why do extremist right wingers always view scientific disputes as political or theological issues (at least since forcing Galileo to recant his position that the earth revolves around the sun)? There’s a respectable point in the underlying article, but drawing the conclusion that Obama’s climate policy might be based on fraud is as ludicrous as claiming that the Bush Administration’s failure to prevent 9/11 proves it might have conspired to cause it.
Joe,
There is a lefty commentator here [joeldshore], who constantly accuses the science-oriented readers here of being “ideologues” because he doesn’t agree with them.
That’s what your point #2 sounds like.
If you don’t think the Administration’s policy is fraud-based, then do a search for ‘John Holdren’ and ‘climate’. When you’re done reading, tell us they aren’t perpetrating fraud on the public, for their own partisan reasons.
Why do extremist left wing fanatics create religions out of bad science?
http://www.pmel.noaa.gov/scientist/dr-christopher-sabine
Note – looks like he got “special recognition” from the IPCC for the Nobel Prize. Just missed the Nobel by this 9.) much
I tried to reproduce the graph from Wallace.
Made this document to explain the process: https://docs.google.com/document/d/1ijyZwW2e_OJEwJiimgnO-UF9WF_1k_2GWfnhYThq2O0/edit?usp=sharing
Full data set from NOAA in useable format: https://drive.google.com/file/d/0B7_OTN2MylIEazY3Yzc0UHRLeXM/view?usp=sharing
I came close to it, but not quite. I am using more data, 2.43 million vs 1.5 million. Did not find information on how he cleaned and extracted the data from NOAA web site.
Comments are open on my files and here.
Thanks,
Simon
Simon, you da MAN. I can’t tell you how happy I am to see someone do what I do, that is to say, run the numbers myself. It’s the only way to truly understand what’s been done.
Your results are most interesting, keep up the good work,
w.
The name of this site has always suggested Fraud, in the sense of being junk science.
;]
Gotta love the heavy blue regression curve, where the lefthand data is much sparser than the intensive measurements at the right. So the Wassup gang seems capable of pHraud as well as anyone — but what do I know as a statistician & engineer, eh?
It’d be good to see where Wassup gets it $ too.
But, in any case, regions around the world with natural, volcanically-influenced pH around 7.8 have no sea life with shells/skeletons, so look forward to your sea slug & jellyfish servings. Your descendants might appreciate that, or they might not.
;]
Maybe Fox News would make a feed for Wassup fluff?
“Shells and skeletons” at a pH of 7.8???
Sorry to give you the good news, Doc, but the waters around Alaska are teeming with sea life and the pH there is about 7.5 … don’t know what your doctorate is in, but it’s sure not oceanic pH. There may be a Fraud here … but so far you’re the most likely contestant.
See here for details.
w.
Can anyone answer this?
I’ve ‘understood’ for a few years now that the average pH of the oceans has changed from 8.2 to 8.1 over several decades. This is where the ‘30% more acidic’ claim comes from. ie, a pH decrease of 0.1 equates to a 30% increase in H+ ion activitiy.
Surely the Feely paper is not the only source of this ‘understanding’. But is it? Is the 8.2 to 8.1 change based on other studies as well?
Hey what are you gents using to view and graph this massive data file. My Excel 2010 chokes at 1.04M lines of data and says “entire file not loaded”
Also the charts here are top notch, would like to get as good as you guys….what the hell, I am just a solar engineer.
I am using R… Start here http://www.datasciencecentral.com/profiles/blogs/r-tutorial-for-beginners-a-quick-start-up-kit
Then read my document, I give example how to load the dataset, extract info and graph.
Simon, looks like R requires a fairly steep learning curve. What do you think of the comment by DrZ….and what the heck is and IDO
The R GUI is quite unappealing. To facilitate working with R and learning its various functions I’d strongly recommend RStudio as an IDO. It’s free and quite robust as a GUI, not to mention as a way to keep your projects organized and efficient. You can learn in about a week (tops).
Yes RStudio is a must! it’s a graphical interface on top of R : http://www.rstudio.com/products/rstudio/download/
Here are some graphs from the full dataset, depth = 0, with minor corrections for the outliers.
http://oi60.tinypic.com/21do9qd.jpg
http://oi60.tinypic.com/9s7xvo.jpg
http://oi59.tinypic.com/95u0ip.jpg
The results match with the gridded result:
Berényi Péter
December 31, 2014 at 8:58 am
A preliminary look at the data shows beyond doubt, that ocean pH is decreasing indeed, at a rate of -0.002±0.038/decade. In other words, it is absolutely stable.
(5×5 deg grid boxes, monthly averages, trends computed for grid box/month combinations with at least 15 years of data – 382 such boxes were found)
If only grid boxes with at least 20 years of data are considered (204 items), ocean pH trend is -0.002±0.031/decade, therefore the null result is reasonably robust.
Berényi Péter
December 31, 2014 at 9:29 am
I have given a try to grid box / month combinations with at least 30 years of data (81 items). The result is +0.003±0.026/decade, therefore the null result is incontrovertible.
Here is the sql code for the last graph, showing the cleanup filters and calculations. Variance and deviation were calculated on the underlying data, not the average. no adjustments we made to the data.
SELECT OSD_All.Year, Avg(OSD_All.pH) AS AvgOfpH, Var(OSD_All.pH) AS VarOfpH, StDev(OSD_All.pH) AS StDevOfpH
FROM OSD_All
WHERE (((OSD_All.Year) Not In (1958,1959,1960)) AND ((([OSD_All].[pH])) GE 6 And (([OSD_All].[pH])) LE 10) AND ((OSD_All.Depth)=0)) OR (((OSD_All.Year) In (1958,1959,1960)) AND ((([OSD_All].[pH])) GE 7 And (([OSD_All].[pH])) LE 9) AND ((OSD_All.Depth)=0))
GROUP BY OSD_All.Year
ORDER BY OSD_All.Year;
My pH has been going up for a few decades now.
This shabby analysis has been debunked by Richard Telford http://quantpalaeo.wordpress.com/2014/12/26/not-phraud-but-phoolishness/
His conclusion:
“The changing geographic and seasonal patterns in data availability means that simply calculating the mean pH for each year will give all sorts of spurious trends in the analysis. Even gridding the pH data would be difficult. They are probably best used to validate model output.
Certainly, Wallace’s “compelling” analysis is junk. I hope the rest of his PhD is better than this pHoolishess.”
LOL validate model output…….WOW as if we dont already know that 97 % of all the expert climate models have failed massively…..and now they want to tweak them to show “huge increases in sea ice are predicted by man mad CO2 theories….”
my oh my
Luke,
You’re arguing that omitting data is good science…
…oh, I see. You’re quoting Richard Telford (*SNORK*).
Surely you can do better than that?