“…startling data omission that he told me: “eclipses even the so-called climategate event.””
Willis Eschenbach tips me to a story by Marita Noon, titled:
What if Obama’s climate change policies are based on pHraud?
I’ve reproduced portions of it here, with a link to the full article. The graph with ALL the data is compelling.
“Ocean acidification” (OA) is receiving growing attention. While someone who doesn’t follow climate change science might think OA is a stomach condition resulting from eating bad seafood, OA is claimed to be a phenomenon that will destroy ocean life—all due to mankind’s use of fossil fuels. It is a foundational theory upon which the global warming/climate change narrative is built.
The science and engineering website Quest, recently posted: “Since the Industrial Revolution in the late 1700s, we have been mining and burning coal, oil and natural gas for energy and transportation. These processes release carbon dioxide (CO2) into the atmosphere. It is well established that the rising level of CO2 in our atmosphere is a major cause of global warming. However, the increase in CO2 is also causing changes to the chemistry of the ocean. The ocean absorbs some of the excess atmospheric CO2, which causes what scientists call ocean acidification. And ocean acidification could have major impacts on marine life.”
Within the Quest text is a link to a chart by Dr. Richard A. Feely, who is a senior scientist with the Pacific Marine Environmental Laboratory (PMEL)—which is part of the National Oceanic and Atmospheric Administration (NOAA). Feely’s climate-crisis views are widely used to support the narrative.

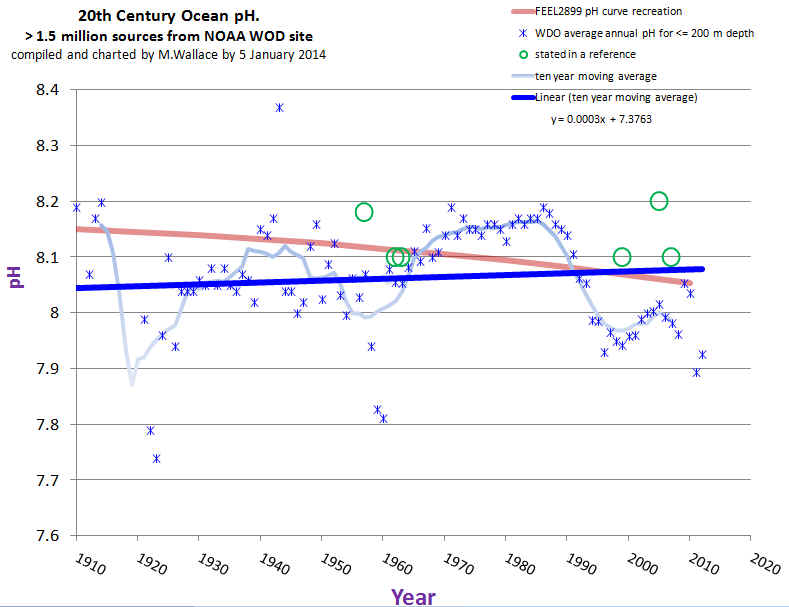
Feely’s four-page report: Carbon Dioxide and Our Ocean Legacy, offered on the NOAA website, contains a similar chart. This chart, titled “Historical & Projected pH & Dissolved Co2,” begins at 1850. Feely testified before Congress in 2010—using the same data that shows a decline in seawater pH (making it more acidic) that appears to coincide with increasing atmospheric carbon dioxide.
…
The December edition of the scientific journal Nature Climate Change features commentary titled: “Lessons learned from ocean acidification research.”
However, an inquisitive graduate student presented me with a very different “lesson” on OA research.
Mike Wallace is a hydrologist with nearly 30 years’ experience, who is now working on his Ph.D. in nanogeosciences at the University of New Mexico. In the course of his studies, he uncovered a startling data omission that he told me: “eclipses even the so-called climategate event.” Feely’s work is based on computer models that don’t line up with real-world data—which Feely acknowledged in email communications with Wallace (which I have read). And, as Wallace determined, there is real world data. Feely, and his coauthor Dr. Christopher L. Sabine, PMEL Director, omitted 80 years of data, which incorporate more than 2 million records of ocean pH levels.
Feely’s chart, first mentioned, begins in 1988—which is surprising as instrumental ocean pH data has been measured for more than 100 years since the invention of the glass electrode pH (GEPH) meter. As a hydrologist, Wallace was aware of GEPH’s history and found it odd that the Feely/Sabine work omitted it. He went to the source. The NOAA paper with the chart beginning in 1850 lists Dave Bard, with Pew Charitable Trust, as the contact.
Wallace sent Bard an email: “I’m looking in fact for the source references for the red curve in their plot which was labeled ‘Historical & Projected pH & Dissolved Co2.’ This plot is at the top of the second page. It covers the period of my interest.” Bard responded and suggested that Wallace communicate with Feely and Sabine—which he did over a period of several months. Wallace asked again for the “time series data (NOT MODELING) of ocean pH for 20th century.” Sabine responded by saying that it was inappropriate for Wallace to question their “motives or quality of our science,” adding that if he continued in this manner, “you will not last long in your career.” He then included a few links to websites that Wallace, after spending hours reviewing them, called “blind alleys.” Sabine concludes the email with: “I hope you will refrain from contacting me again.” But communications did continue for several more exchanges.
In an effort to obtain access to the records Feely/Sabine didn’t want to provide, Wallace filed a Freedom of Information Act (FOIA) request.
In a May 25, 2013 email, Wallace offers some statements, which he asks Feely/Sabine to confirm:
“…it is possible that Dr. Sabine WAS partially responsive to my request. That could only be possible however, if only data from 1989 and later was used to develop the 20th century portion of the subject curve.”
“…it’s possible that Dr. Feely also WAS partially responsive to my request. Yet again, this could not be possible unless the measurement data used to define 20th century ocean pH for their curve, came exclusively from 1989 and later (thereby omitting 80 previous years of ocean pH 20th century measurement data, which is the very data I’m hoping to find).”
Sabine writes: “Your statements in italics are essentially correct.” He adds: “The rest of the curve you are trying to reproduce is from a modeling study that Dr. Feely has already provided and referenced in the publication.”
In his last email exchange, Wallace offers to close out the FOIA because the email string “clarified that your subject paper (and especially the ‘History’ segment of the associated time series pH curve) did not rely upon either data or other contemporary representations for global ocean pH over the period of time between the first decade of 1900 (when the pH metric was first devised, and ocean pH values likely were first instrumentally measured and recorded) through and up to just before 1988.” Wallace received no reply, but the FOIA was closed in July 2013 with a “no document found” response.
Interestingly, in this same general timeframe, NOAA reissued its World Ocean Database. Wallace was then able to extract the instrumental records he sought and turned the GEPH data into a meaningful time series chart, which reveals that the oceans are not acidifying. (For another day, Wallace found that the levels coincide with the Pacific Decadal Oscillation.) As Wallace emphasized: “there is no global acidification trend.”

Regarding the chart in question, Wallace concludes: “Ocean acidification may seem like a minor issue to some, but besides being wrong, it is a crucial leg to the entire narrative of ‘human-influenced climate change.’ By urging our leaders in science and policy to finally disclose and correct these omissions, you will be helping to bring honesty, transparency, and accountability back where it is most sorely needed.”
“In whose professional world,” Wallace asks, “is it acceptable to omit the majority of the data and also to not disclose the omission to any other soul or Congressional body?”
Full story here: http://www.cfact.org/2014/12/22/what-if-obamas-climate-change-policies-are-based-on-phraud/
There’s a petition: http://www.ipetitions.com/petition/restore-the-worlds-ocean-ph-measurements
The Anthropocene HERE, NOW, FOREVER, Real SOON.
Reblogged this on Green Jihad and commented:
A scientist named Richard Feely ignored 85 years of existing data on ocean acidification.
[snip – Epiphron Elpis is yet another David Appell sockpuppet.]
This is Obvious:
AcidGate
Far from being inappropriate to question their motives or quality of their science, it seems to be entirely appropriate. On what planet is it ok to publish modelling results without even a passing attempt to determine how these correlate with measured results!
What makes you think they made no attempt to see how their models correlated with actual data. If history tells us anything they probably did and chose to ignore it when they didn’t get the results they wanted.
The 800-yr Temp→CO2 lag tells the story. As oceans warm, an outgassing process begins. Current CO2 levels are a response to SST at the onset of the Medieval Warm Period. The oceans have about 50X the CO2 in solution that the atmosphere contains. The ocean dog wags the atmospheric tail. Human emissions are irrelevant.
Sorry Brian: wrong story. As oceans warm, there is an increase of 8 ppmv/K in the atmosphere and then it ends, no matter how much CO2 is in the oceans. It is a matter of pressure difference, not of quantities.
The 800 years is for the reaction of the deep oceans on glacial-interglacial transitions, but the reverse reaction needs several thousands of years, while small changes (< 1 K) like the MWP-LIA transition have only a lag of ~50 years and some 6 ppmv CO2 drop after the temperature drop:
http://www.ferdinand-engelbeen.be/klimaat/klim_img/law_dome_1000yr.jpg
The current 110 ppmv increase needs a 12°C ocean surface temperature increase if temperature was responsible.
Ferdinand,
I’m aware of your position and see the logic but remain sure that we don’t yet have enough information about the carbon cycle to prove that your logic is correct.
In the meantime have you considered the effect of sunlight into the top few metres of water?
Sunlight warms individual molecules and groups of molecules and so could drive off CO2 more than would be the case from a warming of the whole body of water would it not?
We see that most CO2 in the atmosphere is found above or downwind of sunny oceanic regions beneath the subtropical high pressure cells and those regions migrate latitudinally to and fro with the seasons.
Maybe you are applying Henry’s Law too simplistically?
Winds quickly drive CO2 away from the sunny regions where it is being released so it is easy to envisage Henry’s Law applying in a particular location but if the CO2 rich air is being constantly removed then more outgassing can then occur in the same region and it is not hard to envisage an accumulation of CO2 downwind or over land masses where the wind flow slows down.
I
And I don’t agree that the oice cores properly reflect past atmospheric CO2 variations so yoiur Fig 4 may well be seriously misleading.
Whenever I read alarmist nonsense on ocean acidification, I always ask the same question: “Why don’t they look at the numbers?”
If you take the current rate of CO2 absorbtion into the oceans, you will find that after a century, this will represent about one part CO2 to one million parts ocean. In other words, not a lot!!!
So let’s cut the c**p and summarise:
Feely makes a computer model of declining ocean pH in contradiction of the real data, which he with the NOAA behind him tries to suppress.
For this he gets to testify before Congress and receives a 100,000 dollar prize.
Wallace asks for the actual data and in return is given a thuggish mafia style threat from the US government.
Most posters seem surprisingly relaxed about this.
I’m not at all relaxed about this. I feel a complete sense of outrage.
This appears to be a perfect example straight out of the cherry-picker’s climate guide.
The data from 1988 onwards is an environmental extremist’s dream: it’s completely scary.
But all the data from 1900 shows there’s no overall trend. How many times have we seen this before?
And this cherry-picked data was shown to Congress?
What is particularly sickening is that this scientific fraud actually threatened Wallace.
We can only hope that this industrial scale corruption of science will eventually end and scientists will return to the task of finding the truth, rather than trying to scare us into submission. Now that really would be a great Christmas present! But I’m not holding my breath.
Chris
thanks, Chris.
Feely may be an aberration . There is a lot of Govt funding in just the UK. A large numbers of papers , presentations , etc has already appeared , and can be seen on the organisation website ;
http://www.oceanacidification.org.uk/Home
Some of it is quite sobering.
Looks to me like the rely heavily on Feely for their claims. Without his truncated data their research is meaningless. It’s the corner stone of this fraud.
Mike Waite says it’s quite “sobering”?
“Already ocean pH has decreased by about 30% and if we continue emitting CO2 at the same rate by 2100 ocean acidity will increase by about 150%, a rate that has not been experienced for at least 400,000 years”
That is cold blooded fraud.
Like this.
http://www.scilogs.de/wblogs/gallery/16/AR5_acidification.png
http://blogs.seattletimes.com/seachange/2013/09/27/ipcc-high-confidence-that-oceans-are-souring/
Fortunatley there are top notch people refuting it.
http://cliffmass.blogspot.com/2013/10/ocean-acidification-and-northwest.html
http://cliffmass.blogspot.com/2013/11/coastal-ocean-acidification-answering.html
A year-end message to the commenters here at WUWT.
Consider the exchange between dbstealey and D. Socrates. At one point dbstealey says to Socrates,
There is always talk of “trolls” and so forth, but I think that open debate is always good. As long as both sides are being honest (even if one is delusional) then there is value in the discussion. I saw nothing new in what dbstealey wrote in his several posts, but was glad to be reminded of some things and to read different ways of expressing facts to one who is laboring under the delusion of massive propaganda by the alarmist side. (has no one ever heard of Chicken Little these days?)
We will certainly never see a long written (or otherwise) debate between an alarmist like "Dr." Mann and a realist like Steve McIntyre over the issues, and I disrepair of ever seeing even lesser lights on each side squaring off in a real debate. And yet "science" is debate. When a theory is put out there, there has to be continual attempts to discredit the theory by facts, observations, logic, other theories, and all the rest. The "man in the street" does not really get to see much in the way of debate and so exchanges like the one between dbstealey and D. Socrates had value here — even if we have seen similar on other occasions.
I would like to see more freedom here to mention unpopular ideas. I am not calling for a "troll fest", but rather for everyone to attempt to engage others with facts, observations, and logic. Even if you do not change the person's mind (at least publicly) you hopefully exhibit good arguments that the rest of us might use in our own dealings with the deluded alarmists.
And finally, we all need to remember that this CAGW scare is mostly political and that our rhetoric is therefore as important as our facts — and we can all learn better debate skills.
[Formatting fixed. -w.]
… and I end the year with an unclosed tag … damn, damn, damn.
[Merry Xmas … -w.]
Unresolved tags are better than unresolved resolutions.
Merry Xmas to all the mods as well! And thank you for your year long efforts.
Seconded! Here at WUWT too, there is too much jumping to conclusions, even in this article, while nobody knows (maybe the writer knows?) the real accuracy of the historical data, which may have been too variable because of place, time and method and too inaccurate to conclude anything about a (theoretical, but based on ocean chemistry) trend of 0.1 pH unit over a century…
It is entirely possible that this is the reason that Feely e.a. only used the most recent data where fixed station data were sampled with better equipment and more frequently over a much longer period…
Anyway, a nice Christmas Eve to everybody…
Ferdinand evidently wins the prize for the right answer–see commentary at Skeptical Science!
Willis Eschenbach December 23, 2014 at 12:54 pm
Eric Worrall December 23, 2014 at 11:34 am
In my Chemistry course, acidifying meant reducing the PH of the solution – even if the solution remained alkaline at the end of that step.
In my chem course, we used titration to determine the pH of a solution. Adding acid to an alkaline solution was called “neutralization”, and not ever “acidification”.
Willis an acid-base titration is indeed neutralization because sufficient acid is added to exactly neutralize the base, chemists term acidification as the addition of acid to a solution.
My general challenge to anyone who insists that lowering the PH towards 7 is called acidification in the common lexicon is to find examples outside of “ocean acidification”. You will be hard pressed there are very few.
“in the common lexicon is to find examples outside of “ocean acidification”. You will be hard pressed there are very few.”
Blood pH is normally around 7.4. pH 7 is not viable. In between, the condition is called acidosis. And yes, if you deviate on the other side, it’s alkalosis.
That is why this pH 7 argument is so silly. pH 7 is the neutral point of a particular buffer system – H+/OH-. It’s relevant to titrating HCl with NaOH. It’s not relevant when other buffer systems dominate, as in blood or seawater. Then what counts is what side of the neutral point of that buffer you are. Carbonic acid is diprotic, which complicates. But lowering pH is always acidifying.
Wrong again. 7 is the neutral point chemically. Blood is not neutral. No one claimed it is. And assigning blood chemistry to an absolute (chemically) is like saying that you must be 5% aluminum if you are “terrestrial”.
I would say you can do better, but given your past performance I guess that is not true either.
Thanks, Phil. So your claim is that if we add a small amount of acid to an alkaline solution it’s called “acidification”, if we add a larger amount it’s called “neutralization”, and if we add even more it’s once again called “acidification”? Makes no sense.
And it didn’t work that way in my chem class. If we only added half the amount of acid needed, we wouldn’t call that “insufficient acidification”. We’d say we had done an incomplete neutralization.
It’s simple, or at least it was in 1964. Moving towards a pH of 7.0 is neutralization. Moving away from 7.0 is either acidification or akalinization.
This is also the common usage. For example, you don’t add baking soda to the top of your car battery to “alkalinize” a battery acid spill. You add it to neutralize the acid.
So on the day that people start calling that action “alkalinizing the battery acid” I’ll believe your claims. Until then … not so much …
Best regards,
w.
Good point.
One doesn’t akalinize an acid solution.
Likewise one doesn’t acidify an alkaline solution, unless one likes the emotive aspect. Some do.
Willis et al.
Meanings of some of these terms overlap. Neutralization generally means that we add acid to a base (or base to an acid) in order to produce a “neutral” solution of pH 7.0. The term acidification often means that we are moving the pH down, whatever its current value. That from a PhD chemist.
Willis,
“And it didn’t work that way in my chem class. If we only added half the amount of acid needed, we wouldn’t call that “insufficient acidification”.”
In class, you only deal with strong acids. Try titrating 1 l of 1M NaOH with acetic acid. When you’ve added a mole of HAc, the pH is about 9.4. After that, you’re adding excess acid. By any definition, that is acidifying. pH 7 is just a point along the way.
And if you move pH up, what do you call that? De-acidification? Alkalinization?
Perhaps Feely should give back his Heinz award (see link).
http://content.usatoday.com/communities/sciencefair/post/2010/09/2010-heinz-awards-announced/1#.VJSpM90MA
“For his extraordinary efforts in identifying ocean acidity as global warming’s “evil twin.””
Extraordinary indeed.
This is what appears to happen:
i) Warmer oceans drive CO2 out of the water which becomes less acidic (more alkaline) as during the 1930’s and late 20th century warmimg spells.
ii) Cooler oceans allow more CO2 to be retained by the oceans which then become more acidic (less alakaline) as during the colder spells in the early 20th century and the middle 20th century.
That is the precise opposite of the established theory of CO2 driven PH.
Such a scenario supports the Salby proposition that changes in atmospheric CO2 follow the ocean temperatures and not human emissions.
It also fits my New Climate Model which states that solar variations influence global cloudiness so as to change the proportion of solar energy that gets into the oceans to drive the climate system.
High solar activity reduces global cloudiness resulting in more solar energy entering the oceans for ocean warming and more CO2 driven out of the oceans into the atmosphere.
Low solar activity increases global cloudiness resulting in less solar energy entering the oceans for ocean cooling and more CO2 retained by the oceans and denied to the atmosphere.
The above time series chart appears to substantiate that proposition.
Stomata evidence, being a more direct proxy for atmospheric CO2 than ice cores, shows substantial atmospheric variations in CO2 and therefore supports the proposition that atmospheric CO2 amounts are actually controlled by sunlight on oceans and that the amount of sunlight varies with the level of solar activity which in turn controls global cloudiness.
How does your model account for the declining C-13/C-12 ratios over the past 150 or so years?
How can you be sure that the declinng ratio is not caused naturally ?
My Model seeks to join the dots between a plethora of observations and so far has been successful to an extent that I am driven to doubt that we are the real cause of that declining ratio.
There seems to be a dearth of information about the precise interaction between the many variables involved in the carbon cycle and the isotope effect of each component.
The proposal that the declining ratio is caused only by our emissions remains speculative and we have seen that the models based on our emissions driving CO2 and that CO2 driving temperatures are failing. That failure also casts doubt on the isotope assumption.
You have put the cart before the horse.
Observations show the C-13/C-12 ratios are in decline.
I only asked you how your model accounts for that decline. I have not made any statement as to attribute it to our emission.
..
Your model needs to account for the observations.
And note that although my Model is consistent with an oceanic cause of increased atmospheric CO2 from sunlight variations it is not dependent on such a cause.
Even if our emissions were the cause of increased atmospheric CO2 my Model still works because it reduces the effect of our CO2 to an infinitesinal circulation change compared to the much larger circulation changes induced by the variable sun and ocean cycles.
Our emissions would still only make a difference equivalent to a decade or so of natural climate change within a 1000 year natural cycle.
So, what you are saying is that the decline in the isotope ratio is cause by humans?
“I only asked you how your model accounts for that decline. I have not made any statement as to attribute it to our emission.
Your model needs to account for the observations.”
It doesn’t need to for the reason given. Most likely there is some currently unknown aspect of the carbon cycle that accounts for it.
Oh no, you are so wrong there. You have to explain what is causing the decline in the isotope ratio. It’s an observation that is not explained if the source of the increase of atmospheric CO2 comes from the oceans.
The alternative explanation that the cause of the decline is attributable to humans makes the anthropomorphic origin of the CO2 much more plausible.
David,
How do you account for increased ocean acidity (more CO2 retained) during cooling periods and decreasing acidity (less CO2 retained) during warming periods as shown in the above chart?
Whatever happens to the isotope ratio the fact is that warmer oceans hold less CO2 and colder oceans hold more CO2.
Can you explain a decrease in the C13/C12 ratio when the oceans are warming and holding less CO2?
Can you say what the ratios were at the peak of the MWP or the coldest period of the LIA?
OK… I get it…your model can’t explain the decline, and you resort to asking questions to deflect.
“Oh no, you are so wrong there. You have to explain what is causing the decline in the isotope ratio. It’s an observation that is not explained if the source of the increase of atmospheric CO2 comes from the oceans. ”
My Model is neutral as to where the CO2 comes from provided that any effect from CO2 is too small to measure.
You have raised a straw man.
No stram man raised.
…
I just pointed out to you that your model is incapable of explaining a measured observation.
“OK… I get it…your model can’t explain the decline, and you resort to asking questions to deflect.”
I don’t need to explain it for my Model to remain valid.The concept of ocean outgassing in response to more sunlight is a useful add on but not an integral component because I do not ascribe significant climate forcing to that CO2.
You need to prove the cause as anthropogenic if you wish to rebut the oceanic role. Until you know a lot more about the carbon cycle you cannot do it.
“I don’t need to explain it for my Model to remain valid.”
…
Yes, you are correct. Your model may be “valid”……but as Newton’s laws of gravitation are “valid”……as compared to Einstein’s General Relativity which are also “valid” But GR is a better model because it explains things Newton’s model can’t (i.e. Mercury’s precession)
…
The better “model” wins, and your model’s inability to explain the declining carbon isotope ratio does not invalidate it, but your model is supplanted by one that provides a better explanation of the observables.
“your model is supplanted by one that provides a better explanation of the observables.”
I’ve not seen it 🙂
There is no such thing as “ocean acidification”. The oceans have never been acid on this planet; not in 4.5 billion years.
The pH has always been present day levels, even during the K when CO2 levels were 600-1200 ppm.
The reason is simple: phytoplankton.
The limiting factor for the growth and proliferation of phytoplankton is CO2.
This is especially true for coccoliths because these have tests of calcium carbonate. Add CO2 to the atmosphere, the phytoplankton proliferate and a new equilibrium is achieved. The CO2 is simply converted at a higher rate into calcium carbonate and organic matter.
We have the Cretaceous period to demonstrate this principle for us (Cretaceous) is Latin for chalk.
Stephen, it is very simple: if your model is right, the bulk of the extra CO2 is coming from the oceans.
The 13C/12C ratio of the ocean surface is at +1 to +5 per mil δ13C, the atmosphere currently is at -8 per mil δ13C.
If you add CO2 from the oceans to the atmosphere, including the isotopic shift at the sea-air border, the per mil δ13C of the atmosphere would go up. But we see a firm decline of the 13C/12C ratio in the atmosphere, in lockstep with human use of fossil fuels…
Thus your model doesn’t fit one of the basic observations of what happens in the atmosphere and ocean surface layer (which also shows a similar decline).
The nicest theory on earth is destroyed by one simple fact…
Ferdinand,
My model is neutral as regards the actual source of the extra CO2 but would be consistent with ocean outgassing. It is also consistent with an anthropogenic cause provided the climate impact of CO2 is negligible.
I reserve my position on the issue of the isotope ratio on the basis that we do not know enough about the carbon cycle to be sure.
I find the oceanic effect persuasive enough to doubt the validity the assumption that the decline in the ratio is a result of human emissions.
Note that sunlight penetrates the ocean surface by many metres so it isn’t just the air/sea interface that one must consider.
Stephen Wilde, whatever the cause of the increase, any theory explaining a non-human cause must match all observations, not only the increase in the atmosphere…
Human emissions increased a 4-5 fold in the past 55 years. So did the sink rate in nature (wherever that might be) and so did the rise in the atmosphere. If the oceans would be the cause, they need to have increased a 4-5 fold over the past 55 years too, or they can’t dwarf the human emissions to a secondary cause of the increase in the atmosphere. But that implies a huge increase in throughput (in/out) of the atmosphere, for which is not the slightest sign. To the contrary, the residence time of any CO2 molecule slightly increased over time as result of little change in throughput in an increasing CO2 content of the atmosphere.
See what happens with the 13C/12C ratio of the atmosphere if the cause of the CO2 increase was mainly from the deep oceans, human additions and exchanges with the ocean surface and the biosphere unchanged (the orange line in the graph):
http://www.ferdinand-engelbeen.be/klimaat/klim_img/deep_ocean_air_increase_290.jpg
Stephen Wilde,
Stomata data are in no way “better” than ice core CO2 data, they are proxy’s of local CO2 levels, not like ice cores which are direct measurements of CO2 in the ancient bulk (95%) of the atmosphere, be it averaged over several years to several centuries, depending of the snow accumulation rate of the ice core.
Further, the equilibrium pCO2 between ocean surface and atmosphere shifts with 8 μatm/K that is all. Literature shows values between 4 and 17 μatm/K. Anyway, the ocean surfaces didn’t heat up with 12 K to reach the 110 ppmv extra.
Stomata are a direct reflection of CO2 in the air at the time of their growth in the region of highest CO2 namely near the ground and where it is warm enough for plant life.
Ice cores acquire CO2 from the air in regions too cold for plant life and higher up where the snow flakes form. They are then subjected to multiple melt and freeze cycles, constant changes in pressure and lateral movement. CO2 can move around within the body of the ice They are far less reliable indicators.
I don’t agree that the entire body of the oceans needs to heat up by 12C to increase CO2 by 110ppm extra.
Sunlight driving off the CO2 in a constant stream in favoured locations whilst winds remove it will cause a backlog in the CO2 cycle elsewhere and cause an accumulation in the atmosphere without a 12C rise.
Stephen, I don’t know where your (des)information about ice cores originates: the air inside snow flakes has exactly the same composition as the air surrounding it. The air in the pores of the snow in the top layer has exactly the same composition as in the atmosphere above it. At 72 meter depth (for the Law Dome ice cores) the CO2 level in average still is only 7 years older than the air at the surface. Once the pores are fully closed at that depth, there is no, none measurable migration of air/CO2 in ice cores.
That can be found in the work of Etheridge e.a. from 1996:
http://onlinelibrary.wiley.com/doi/10.1029/95JD03410/abstract
There is a theoretical migration in “warm” coastal cores, which makes that at middle depth the CO2 levels in the Siple Dome ice core are a mix over 22 years instead of 20 years. Big deal…
The difference is that local CO2 levels over land are extremely variable. Here the monthly averages for Giessen (SW Germany, semi-rural):
http://www.ferdinand-engelbeen.be/klimaat/klim_img/giessen_mlo_monthly.jpg
The red points, averaged over 1 to a few years is what the stomata data reflect.
The blue line, averaged over 10 to 560 years is what the ice core data reflect.
The red points is what is measured at one point on earth, somewhere in the 5% highly variable atmosphere, influenced by the direct neighborhood and what happened in the main wind direction of the measurement (or tree(s) in the case of stomata data)
The blue line is what is measured in 95% of the atmosphere +/- 8 pmv (seasonal), +/- 2 ppmv (yearly averages).
Given this points, in my informed opinion, the ice core data are by far superior to the stomata data, be it averaged over longer periods…
BTW, only the temperature of the ocean surface layer is important for the CO2 fluxes in and out. Any temperature change of the surface layer doesn’t give more than 8 ppmv/K change in the atmosphere. The 110 ppmv extra in the atmosphere just push more CO2 into the oceans. not reverse…
Ferdinand, the Etheridge article you cite shows the firn closure averages about 50 years at Law Dome, while the exchange rate at depth is about 10 years. That implies a 5x average. Also, I don’t see how you can pass over the fact that, 1) the atmosphere in any ice core is locally derived, not global, and 2) the ice-bubble gas is a proxy for the originating atmosphere, not a direct measurement of that atmosphere.
Further, below a certain depth, the gas bubbles disappear because of over-pressure. Unless the ice is truly a glass, rather than crystalline, the CO2 will be forced out of the ice-lattice and into the interstices. That puts CO2 into linear defects within the glacier, where salts, acids, H2O2, and organics collect. Over long times, that exposes CO2 concentrations to reaction chemistry, not to mention migration, that is generally unaccounted in ice core CO2 reconstructions. Ice core gas concentrations, including CO2, are subject to opportunistic bacterial processing, that may go undetected.
You seem to regard ice core gases as having the same stability as gas bubbles trapped in lava. They do not. Some of the difficulties and confounding factors are discussed here and here (pdfs).
I’ll add that the calibrations of near depth ice cores, reflecting recent firn closure, with measured atmospheric gases are likely to be the least affected by chemo-physical reprocessing within the glacier, and so will not give a true measure of the reliability of more ancient gases recovered at depth.
Pat Frank,
The time that the pores are open at the Law Dome is ~40 years (40 layers of summer/winter snow) until where the closing of the air bubbles start. At that moment, the average air composition is 7 years younger than the composition of the air in the atmosphere, not 20 years if it was a simple average. That is because most of the time, the pores were open enough to allow exchange of air in both directions. Migration over 40 years is more than enough to have a lot of exchange and near zero difference between atmosphere and air composition near the bottom. Except when the pores are becoming smaller and reduce the exchange rate. The pore diameter is a reverse function of the firn/ice density.
Etheridge e.a. used a firn densification model to calculate the distribution of CO2 over the total firn/ice column. He confirmed the results of that model (used for all ice cores) by measuring CO2 in the firn top down until full closing of all air bubbles.
That makes that the distribution of the gas age is much smaller than you expect from the ice age. For the two summit Law Dome ice cores about a decade, for the more downslope Law Dome ice core ~20 years (but the full period for the first two is ~150 years before rock bottom was reached, ~1000 years for the third one).
Further, the “local” CO2 at the South Pole is in the bulk of the atmosphere, which is within a few ppmv from Mauna Loa or Barrow near the North Pole, that shows the same trend and near the same levels for 95% of the atmosphere:
http://www.ferdinand-engelbeen.be/klimaat/klim_img/co2_trends_1995_2004.jpg
In contrast, look at the real local data like in Giessen above where the leave knobs base their stomata index for the next growing season on the average local CO2 levels of the current/past season.
CO2 levels in ice cores are no “proxy’s”, they are direct measurements of CO2 in ancient air, be it averaged over a period of 10 to 600 years.
Further, below a certain depth, the gas bubbles disappear because of over-pressure. Unless the ice is truly a glass, rather than crystalline, the CO2 will be forced out of the ice-lattice and into the interstices.
CO2 and air do form clathrates, but these decompose during relaxation (minimum one year conservation at -20°C after drilling). The remaining clathrates decompose under vacuum at measurement time, or surely decompose with the sublimation technique, which is used in case of isotope measurements.
Antarctic ice cores have no to little problems from (sea salt) dust, Greenland ice cores are unreliable for CO2 due to frequent acidic dust from Icelandic volcanoes which react in situ (and during abandoned wet measurement methods) with carbonates from sea salts. That makes that Greenland ice cores show frequent peaks of high (not low!) CO2.
Bacteria are detected in all ice cores, mainly where dust deposits are encountered. At an average -40°C in the Vostok ice core, they just survive, where they use an alternative carbon source: CO2 to repair any DNA damages. That is reflected in the N2O increase in the air bubbles. If all measured N2O was caused by bacterial DNA repair, then the CO2 level dropped with 0.5 ppmv over 400,000 years…
The link you provided was for the bottom layer of the Greenland ice core, where temperatures increase to near melting.
There is no measurable CO2 migration in ice cores. There is some theoretical migration in relative warm coastal ice cores, but negligible in the cold inland ice cores. If there was any appreciable CO2 migration, the eight CO2 peaks during interglacial periods should fade for each period 100,000 years back in time.
The link you give (the second link doesn’t work) shows the caveats mainly for the Greenland ice cores. For the Antarctic ice cores they explicitly say that all ice cores are within 5 ppmv of each other, despite all possible errors in the ice cores drilling, storage and measurements… Not bad compared to stomata data with their 63 ppmv range (in one core…).
My head is spinning, but I learned a lot from this thread. Thanks to all.
The peak of sunshine induced ocean alkalinity appears at around 1988 and it then began a decline.
However, the strongest El Nino was some 10 years later in 1998. The delay would be due to ocean thermal inertia.
From 1988 to 1998 there would have been a complex interaction between the ENSO cycle and the amount of sunshine entering the oceans from changes in global cloudiness.
The Earthshine project shows that the solar induced reduction in global cloudiness did not reverse until about 2000 but we see that the highest level of ocean alkalinity was around 1988.
I propose that from 1988 to 1998 the run of stronger El Nino events during that period allowed more energy out of the oceans into the atmosphere than was being injected by sunshine and so the oceans became increasingly less alkaline from 1988 to 1998.
Less strong El Ninos since 1998 have helped to flatten the decline in alkalinity but we can see that the decline remains in progress due to increased global cloudiness at a time of a less active sun and less sunshine into the oceans.
AGW proponents have mistakenly taken a natural solar/ENSO induced reduction in alkalinity between 1988 and 1998 as as an indication that increasing atmospheric CO2 was causing the reduction in alkalinity.
I suspect that it will eventually be found that ocean alkalinity follows global cloudiness which in turn follows the level of solar activity but with a delay of ten years or so due to the thermal inertia of the oceans in conjunction with the ENSO cycle.
Changes in ocean aliklinity will then influence atmospheric CO2 and plant stomata.
The ice cores being hopelessy corrupted by pressure and migration effects so that they fail to reflect the high variability of solar/ocean induced levels of atmospheric CO2.
If the sun stays quiet we should soon see the level of atmospheric CO2 stabilise and then begin a slow decline but since there is a long term lag of some 800 years shown in the historical record between temperature and CO2 amounts we may still be seeing CO2 consequences from the Mediaeval Warm Period which could skew the figures away from those expected from current solar variations.
In any event our emissions count for little or nothing and are most likely absorbed locally or regionally by the nearby biosphere which has been seen to show enhanced activity near CO2 sources (hence the use of CO2 in greenhouses).
Merry Christmas, all.
Strange,
I have communicated with a David Socrates in the past and he was nothing like this one. That one supported my basic propositions.
Is there impersonation going on?
What constitutes failure?
You’re going on holiday, the travel agent says” Hawai’s nice, Warm sunny lots to see and do. You board the plane enjoy the trip, they look after you very well. Arriving at your destination you step outside the plane but something’s not quite right. It’s freezing blowing a gale, in fact it’s a blizzard. Success? Hmmm.
As for Climate Change where are we?
The Temperature hasn’t risen, nor has the sea. Storms no more frequent or catastrophic, it snows it rains, our dams are not only full Tim but Brisbane City has been under water twice.
How on earth can anyone believe what these morons say?
It’s been a lousy trip Tim and I want my money back! Tim you convinced the pollies to spend 20 billion of our money on desalination plants in Australia that are now all mothballed. I feel a public hanging coming on.
This is what I had written on12/12/2012 2:43 PM about this scam: Why should anyone bring up sea water acidification when it isn’t happening?
It would be simple and probably nice if the earth’s climate and ocean actions could be explained with something as simple as a trace gas, carbon dioxide, that makes up .035-8% of the atmosphere and 15.1% of the ocean’s makeup but only simple people could believe such a thing. They should know just how dynamic and complex the climate is and all of the factors that affect it before making such a flawed judgment. Here are some sites to look into, if you care to. The biggest flows out of the atmosphere are photosynthesis on land and CO2 uptake by cold ocean water. These are about 30 times and 40 times respectively the flow of carbon into the atmosphere from fossil fuel burning. What follows also addresses the utterly insane allegation that CO2 is increasing the acidity of the oceans.
“The pycnocline (meaning rapid change of density) separates the surface layer of the ocean from the deep ocean. Deep ocean water has a temperature of about 3 degrees Celsius and a salinity measuring about 34-35 psu.” (What does all of this do to the ocean’s pH? Where and what depth are your pH observations taken from?)
http://www.windows2universe.org/earth/Water/deep_ocean.html
“As water travels through the water cycle, some water will become part of The Global Conveyer Belt and can take up to 1,000 years to complete this global circuit. It represents in a simple way how ocean currents carry warm surface waters from the equator toward the poles and moderate global climate.” [The Global Conveyer Belt has suddenly stopped for several speculated reason in the past and caused dramatic and rapid climate changes always to the cold side; therefore, warm is preferable to cold any day]
http://science.nasa.gov/earth-science/oceanography/ocean-earth-system/ocean-water-cycle/
“As water temperature increases, the increased mobility of gas molecules make them escape from the water, thereby reducing the amount of gas dissolved. [Could this be why warming forces the amount of CO2 in the atmosphere by hundreds years & not what the alarmist want one to believe that it is the CO2 that is causing the warming?]
http://www.seafriends.org.nz/oceano/seawater.htm
“It is thought that the carbon dioxide in the sea exists in equilibrium with that of exposed rock and bottom sediment containing limestone CaCO3 (or sea shells for that matter). In other words, that the element calcium exists in equilibrium with CO3. But the concentration of Ca (411ppm) is 10.4 mmol/l and that of all CO2 species (90ppm) 2.05 mmol/l, of which CO3 is about 6%, thus 0.12 mmol/l. Thus the sea has a vast oversupply of calcium. It is difficult therefore to accept that decalcification could be a problem as CO3 increases. To the contrary, it should be of benefit to calcifying organisms. Thus the more CO2, the more limestone is deposited. This has also been borne out by measurements (Budyko 1977).” [maybe, just maybe as with so many things in nature, this is a self-regulating factor that has been taking care of the ocean’s pH without humans having one thing to do with it]
http://www.seafriends.org.nz/issues/global/acid.htm
It would appear that the alarmist worries about acidic oceans is pointless since where is the base line since the pH scale didn’t exist before the concept of p[H] was first introduced by Danish chemist Søren Peder Lauritz Sørensen at the Carlsberg Laboratory in 1909?
I made a calculation on a previous thread that if ALL the CO2 in the atmosphere immediately dissolved in the ocean, it would increase the amount of CO2 in the ocean by one ppm. Now the chemists among us can say how much of that would go to changing pH. But there simply is not enough CO2 in the atmosphere to significantly affect the amount in the ocean which is much larger.
Oh, no! It’s worse than we thought! It’s not ocean acidification, but ocean alkalization! Since ocean water is already quite alkaline, it’s way, way worse than acidification! Oceans will turn very corrosive in a decade! Many people will die! 98% of oceanic species will disappear! I need funding to research the process! /sarc
Sabine responded by saying (…) adding that if he continued in this manner, “you will not last long in your career.”
The quotation marks imply that those were Sabine’s actual words – not just an inference that could be read into what he had said
On the face of it, it is a scandal. The complete email sequence must be made public.
Reblogged this on Centinel2012 and commented:
There is still hope as we still have a few “real” scientists left in the world that look at data for the truth and don’t make the data fit an agenda not related to scienece!
it’s amazing how few people know where the C in carbonates and bicarbonates comes from…
…chemical biology is hard
Anthony writes “Interestingly, in this same general timeframe, NOAA reissued its World Ocean Database. Wallace was then able to extract the instrumental records he sought and turned the GEPH data into a meaningful time series chart, which reveals that the oceans are not acidifying.”
Ouch, so the model didn’t even try to pHit to the data.
It doesn’t have to be a “conspiracy” if every scientist is simply acting for their own benefit.
Yes, but Wallace didn’t publish the error bars of the GEpH data… If you are looking for a trend of -0.1 pH unit over a period of 100 years and your instrument is accurate to 0.1 pH unit and ocean pH can vary 0.5 pH unit (and more) at different parts of the oceans and in different seasons, any such compilation of pH data taken at different places and seasons has no meaning at all.
The Sabine/Feely series are based on better instrument data at fixed places over all seasons in the past few decades…
It is exactly the same problem as with the pre-Mauna Loa historical CO2 data: scattered all over the scale, unreliable due to accuracy of the instruments, personal skill, calibration, time and place of sampling…
Does anyone know of ANY papers that document the observed historical changes in ph before 1980?..cliff mass