“…startling data omission that he told me: “eclipses even the so-called climategate event.””
Willis Eschenbach tips me to a story by Marita Noon, titled:
What if Obama’s climate change policies are based on pHraud?
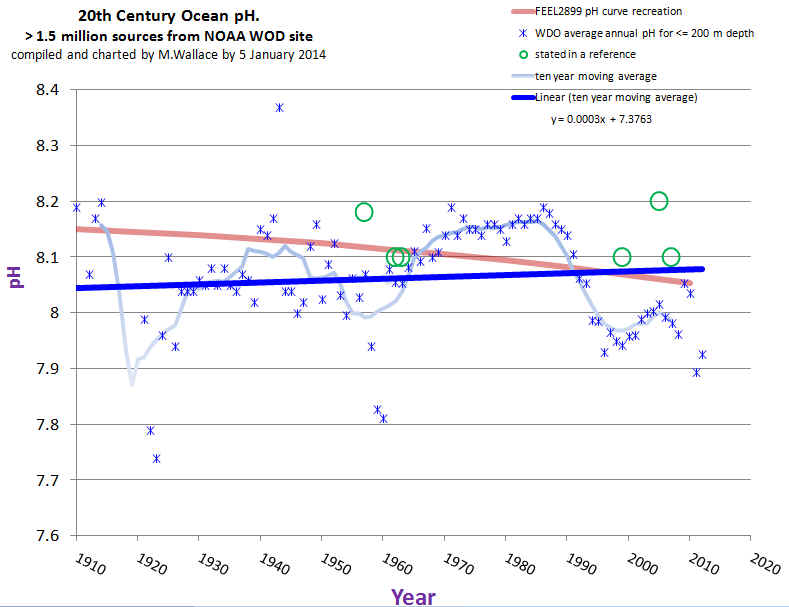
I’ve reproduced portions of it here, with a link to the full article. The graph with ALL the data is compelling.
“Ocean acidification” (OA) is receiving growing attention. While someone who doesn’t follow climate change science might think OA is a stomach condition resulting from eating bad seafood, OA is claimed to be a phenomenon that will destroy ocean life—all due to mankind’s use of fossil fuels. It is a foundational theory upon which the global warming/climate change narrative is built.
The science and engineering website Quest, recently posted: “Since the Industrial Revolution in the late 1700s, we have been mining and burning coal, oil and natural gas for energy and transportation. These processes release carbon dioxide (CO2) into the atmosphere. It is well established that the rising level of CO2 in our atmosphere is a major cause of global warming. However, the increase in CO2 is also causing changes to the chemistry of the ocean. The ocean absorbs some of the excess atmospheric CO2, which causes what scientists call ocean acidification. And ocean acidification could have major impacts on marine life.”
Within the Quest text is a link to a chart by Dr. Richard A. Feely, who is a senior scientist with the Pacific Marine Environmental Laboratory (PMEL)—which is part of the National Oceanic and Atmospheric Administration (NOAA). Feely’s climate-crisis views are widely used to support the narrative.

Feely’s four-page report: Carbon Dioxide and Our Ocean Legacy, offered on the NOAA website, contains a similar chart. This chart, titled “Historical & Projected pH & Dissolved Co2,” begins at 1850. Feely testified before Congress in 2010—using the same data that shows a decline in seawater pH (making it more acidic) that appears to coincide with increasing atmospheric carbon dioxide.
…
The December edition of the scientific journal Nature Climate Change features commentary titled: “Lessons learned from ocean acidification research.”
However, an inquisitive graduate student presented me with a very different “lesson” on OA research.
Mike Wallace is a hydrologist with nearly 30 years’ experience, who is now working on his Ph.D. in nanogeosciences at the University of New Mexico. In the course of his studies, he uncovered a startling data omission that he told me: “eclipses even the so-called climategate event.” Feely’s work is based on computer models that don’t line up with real-world data—which Feely acknowledged in email communications with Wallace (which I have read). And, as Wallace determined, there is real world data. Feely, and his coauthor Dr. Christopher L. Sabine, PMEL Director, omitted 80 years of data, which incorporate more than 2 million records of ocean pH levels.
Feely’s chart, first mentioned, begins in 1988—which is surprising as instrumental ocean pH data has been measured for more than 100 years since the invention of the glass electrode pH (GEPH) meter. As a hydrologist, Wallace was aware of GEPH’s history and found it odd that the Feely/Sabine work omitted it. He went to the source. The NOAA paper with the chart beginning in 1850 lists Dave Bard, with Pew Charitable Trust, as the contact.
Wallace sent Bard an email: “I’m looking in fact for the source references for the red curve in their plot which was labeled ‘Historical & Projected pH & Dissolved Co2.’ This plot is at the top of the second page. It covers the period of my interest.” Bard responded and suggested that Wallace communicate with Feely and Sabine—which he did over a period of several months. Wallace asked again for the “time series data (NOT MODELING) of ocean pH for 20th century.” Sabine responded by saying that it was inappropriate for Wallace to question their “motives or quality of our science,” adding that if he continued in this manner, “you will not last long in your career.” He then included a few links to websites that Wallace, after spending hours reviewing them, called “blind alleys.” Sabine concludes the email with: “I hope you will refrain from contacting me again.” But communications did continue for several more exchanges.
In an effort to obtain access to the records Feely/Sabine didn’t want to provide, Wallace filed a Freedom of Information Act (FOIA) request.
In a May 25, 2013 email, Wallace offers some statements, which he asks Feely/Sabine to confirm:
“…it is possible that Dr. Sabine WAS partially responsive to my request. That could only be possible however, if only data from 1989 and later was used to develop the 20th century portion of the subject curve.”
“…it’s possible that Dr. Feely also WAS partially responsive to my request. Yet again, this could not be possible unless the measurement data used to define 20th century ocean pH for their curve, came exclusively from 1989 and later (thereby omitting 80 previous years of ocean pH 20th century measurement data, which is the very data I’m hoping to find).”
Sabine writes: “Your statements in italics are essentially correct.” He adds: “The rest of the curve you are trying to reproduce is from a modeling study that Dr. Feely has already provided and referenced in the publication.”
In his last email exchange, Wallace offers to close out the FOIA because the email string “clarified that your subject paper (and especially the ‘History’ segment of the associated time series pH curve) did not rely upon either data or other contemporary representations for global ocean pH over the period of time between the first decade of 1900 (when the pH metric was first devised, and ocean pH values likely were first instrumentally measured and recorded) through and up to just before 1988.” Wallace received no reply, but the FOIA was closed in July 2013 with a “no document found” response.
Interestingly, in this same general timeframe, NOAA reissued its World Ocean Database. Wallace was then able to extract the instrumental records he sought and turned the GEPH data into a meaningful time series chart, which reveals that the oceans are not acidifying. (For another day, Wallace found that the levels coincide with the Pacific Decadal Oscillation.) As Wallace emphasized: “there is no global acidification trend.”

Regarding the chart in question, Wallace concludes: “Ocean acidification may seem like a minor issue to some, but besides being wrong, it is a crucial leg to the entire narrative of ‘human-influenced climate change.’ By urging our leaders in science and policy to finally disclose and correct these omissions, you will be helping to bring honesty, transparency, and accountability back where it is most sorely needed.”
“In whose professional world,” Wallace asks, “is it acceptable to omit the majority of the data and also to not disclose the omission to any other soul or Congressional body?”
Full story here: http://www.cfact.org/2014/12/22/what-if-obamas-climate-change-policies-are-based-on-phraud/
There’s a petition: http://www.ipetitions.com/petition/restore-the-worlds-ocean-ph-measurements
Like the narrative for “hottest year” (by 0.02 immeasurable degrees), there is something fundamentally hinky about 400 ppm CO₂ being capable of acidifying, in any measure, the volume of the oceans. And “oh, but it’s just surface acidification” doesn’t count. The oceans mix. Sorry. And for someone to fuel (and shield) the narrative by stonewalling a sceptical review of their work, is, in a word, corrupt. The mass balance, as mentioned at the outset, is insignificant. Only exists in a modelled state. These people just need to go away.
Mike, the few hundred meter surface layer of the oceans is in direct contact with the atmosphere. Exchanges with the atmosphere are very fast: 1-3 years half life time.
There is hardly any exchange between ocean surface and deep oceans, only via (polar) sinks and upwelling places. That gives an exchange of ~40 GtC/year as CO2 between the atmosphere and the deep oceans, or ~0.1% of total C in the deep oceans…
Just want to reemphasize that it is Richard A. Feeley and NOAA that is responsible for this intentionally misleading chart.
There will be an accounting someday and it is good to have a list of the perps.
I have added Feeley to my growing list of perps . Wallace asks “is it acceptable to omit the majority of the data ” But it seems to be a pervasive tactic accepted by peer reviewed climate “science”
http://landscapesandcycles.net/American_Meterological_Society_half-truth.html
If data begins at 1850, why has Wallace omitted the data from 1850-1910 in his chart?
Do keep up !!! The glass membrane pH electrode was not invented until 1909. Before that time , pH was measured by indirect means such as titration against an indicator. Any scientist knows you cannot reliably compare data sets obtained by such widely different methods unless you have a reliable means of validating them.
Yeah…just ask Mann!
/sarc off
The definition of pH does not depend on how it is measured.
..
I guess Wallace is just cherry picking the data.
socks: give your opinion, please, of scientists who behave in the manner documented in this post. Thanking you in advance.
To have some idea about the change in pH of the oceans, the accuracy of the measurements would need to be better than 0.01 pH unit. Someone who has an idea of the accuracy of the first glass electrodes of that time? My last pH titration was some 40 years ago…
The accuracy does depend on the measurement. What a fish!
OK mpainter.
…
Wallace should include the data from 1850, instead of dropping 60 years of it. He’s doing the same thing Feely is doing.
It seems that you are putting Wallace on the same level as Feeley, regarding their respective behavior in this affair.
Yup….seems like both of them qualify as “cherry pickers”
The pH scale wasn’t invented until 1909.
David Socrates reminds me of Dana Nuccitelli.
Hey, maybe he is Dana Nazicelli ☺
Lots of young folks here? Used to do pH titrations in the lab 50 years ago. OK, maybe not as “good” as the new electronic methods (calibration) but why not show the whole record with error bars?? Titration may be 0.05 to 0.2 units depending on procedures, high end spectrography may be 0.02, others less accurate.
http://news-oceanacidification-icc.org/2014/05/27/precision-and-accuracy-of-spectrophotometric-ph-measurements-at-environmental-conditions-in-the-baltic-sea/
So, why not show the whole record? Or does it show that there is nothing to see? Roy?
Thanks Wayne, I was looking for the accuracy of the early glass electrodes…
If we put the ancient electrodes and procedures at 0.1 units (best result) and the pH drop at a fixed place in the oceans with a growth of 40% CO2 is not more than 0.1 pH units over 100 years, what then is the value of the historical data, taken at a lot of different places in different seasons? Or shall we conclude that near all pre-1985 data are within the error band of the measurements?
Remember that no measurement is better than its calibration. Modern pH-meters certainly measures to bettter than 0.01 units, but they really can’t be calibrated to nearly that precision. pH is basically chemical, so ultimately all instruments must be calibrated against a standard solution with known pH. Those are not exact to 0.01.
Fortunately, one can (theoretically) calculate the pH from other observations in the oceans, as they have done for Bermuda and Hawaii, including some overlap of the two methods. If that is better than 0.01 pH unit still is questionable, but anyway easier to obtain than direct pH measurements. Although colorimetric analyses seems quite promising and not labor intensive, so that such automated equipment can be installed maintenance free in merchant ships. Automated pCO2 measurements are already installed in commercial ships…
Ferdinand
You never before admitted that the Bermuda and Hawaii pH figures were theoretically derived. These are your touchstons for ocean pH increase and now it comes out that these are not direct measurements, if I understand you correctly.
mpainter, they performed both direct pH measurements and calculated ones. The calculated ones are far easier to obtain and more reliable than the direct pH measurements, but both (partial) series overlap each other.
See: http://hahana.soest.hawaii.edu/hot/trends/trends.html and look at the pH comparison…
The one clear thing there is to see on the data presented is that choosing the downward slope of the trend curve obviously shows a decrease in pH. But that’s just a snapshot in time. If I quoted the trend for 1950 to say 1970 it would quite clearly show an increase in pH with time. Other points could/would indicate no change with time ( 1970 to 1990 ?). You pays your money you takes your choice.
The bottom line is anyone REALLY cherry picking data (say to fit a preconceived hypothesis-surely not !!) could easily do so with a naturally fluctuating system.
Does the pre-1910 data show any difference ? I don’t know but I might wager a small amount of pension that it would also show a natural cycle.
But hey, I’m just a newcomer on the comments here.
( ps. Wayne, I can only claim 43 years in the lab 😀 )
Roy, I doubt that the pre-1985 data have any value if they were taken with glass electrodes (+/-0.1 pH unit), different places and different seasons. We are searching for a (theoretical) trend of about -0.1 pH unit over the first 100 years of human emissions…
David Socrates, can you point us to the “omitted” data 1850-1910?
http://www.nodc.noaa.gov/cgi-bin/OC5/WOD/getyearlydata.pl?Go=TimeSorted
In the OSD file
As a chemistry illiterate, why are the annual amounts around 1920 and 1960 be so much below the general trend? If no error in capturing the data, what possible real life situation would cause what appears as a significant statistical outlier.
Those offsets are probably just due to regional outliers, sbdunes. None of the points in the trend line represent the global ocean. All of them are probably complied from regional maritime series where pH happened to be measured during some study. So, depending on what regional excursions enter into the record average, the supposed global pH average can wander about.
Sabine warns Wallace to not question their “motives or quality of our science”, I am sure Wallace did no such thing, but Sabine bringing it up means he is aware of his ulterior motives and it’s influence on his work.
It’s like when a cop asks the question, “Did you take John Smiths cash and checkbook from under his mattress?” and the suspect responds, “No I didn’t, John Smith is lying, there was no checkbook under the mattress.”
More like:
Cop: Can I see what’s in your glove compartment?
Perp: There’s no cocaine in there.
Except Wallace was no cop, but a colleague.
The original article also states:
That’s a significant motivation not to respond to inquiries like those of Mike Wallace.
I would be interested to hear the scientific justification for building a model to produce time series output and then not checking that against empirical data of the same type one already has. Really, I would.
Well mathematically $100,000 is more money than $0. Scientifically this leads to an irreversible upward trend in Mr. Feelys ability to buy more stuff. Morally and ethically totally bankrupt.
Wow, I just read this in the original article as well and can’t believe it was omitted here. How convenient for him that scientactivists are now being paid to manufacture results. I always had a feeling that finger pointing at skeptics claiming they were all being paid by the fossil fuel industry was simply a projection of guilt, not I’m quite certain. Feely’s connection to this foundation and award money need to be investigated.
Shorter answer: we need more $cience…
Now it will be all over the State Department how the wife of John Kerry, Sec. State, US, got took by a dubious scientist for $100 grand.
And next the world.
Pass the ketchup, please.
These frauds never believe that they will be sniffed out.
Dick Feely and seminal research. There’s a puerile joke in there, I’m sure.
Omitting data, thus lying to Congress is an is a criminal offense, is it not?
Contempt of congress or purgery is against the law. It is up to congress to enforce it however.
I believe that only applies if a witness is put under oath. Most people who appear before congressional committees are invited by whichever political faction believes the presentation will further their policy goals, and are not put under oath. Unlike some professions which require a professional license and civil liability insurance, climate scientists (and scientists in general) are not legally held to any specific standard of performance. So even if he did give testimony under oath, I really doubt Feely could be charged with perjury or held in contempt of Congress unless he were specifically asked whether the historical pH data were measured or modelled and gave a false answer. If you have access to a transcript of his testimony, it might be interesting to research, but I would not hold out much hope you would find anything incriminating.
Basically, if you are an impartial jurist, how can you hold it a crime to repeat before Congress what a witness has already published in a (drum roll, please) peer-reviewed journal? Thus the corruption of peer-review has ripple effects in other venues.
Eventually this will get sorted out as it has in other professions. We don’t allow bankers, stock brokers, or realtors to regulate themselves by their own standards (although they all claim the ability to do so). Eventually the body politic will figure out that as a group scientists have ceased to be disinterested seekers of truth and joined the throngs of other self-interested parties, and must be externally monitored and regulated as such. The more climate science tarnishes the common view of science, the sooner that reckoning will come.
Or possibly our civilization will collapse first from the cumulative corruption and stupidity of the people we have unwisely elevated to public office — it’s a tough call.
Unfortunately, I must agree with you.
So who was measuring the Ph of the oceans to a depth of 200 meters back in 1910? For that matter who was measuring it in the years since?
I’m seeing a large drop in pH since 1985 or so. This looks like the equivalent of arguing there is no pause in temperatures because the 30 year trend is one of increase.
Mike Wallace would do better publishing his findings than touting them on blogs.
You are unfamiliar with electronic publishing?
Hard to publish a study, when the authors of the study you are researching are running for the hills. I think you knew that or maybe not.
The moving 10 year trend does show a decline in PH. Am I missing something?
PS… I want to say thanks for exposing this (sadly unsurprising) cover up. A scientist, more than any other professional, should be most forthcoming with their information. They should be interested in the truth, and welcome critique.
The whole POINT of sharing data is so that other scientists can eliminate observer bias (motivation) as a source of error in the analysis.
I want you to question my motives. I need you to question my motives. I give you my data and and my code to aid you in the destruction of my claims. If I give you my data and I give you my code and you cannot find any effect due to choices I made in analyzing that data, then you are rationally obligated to accept my results.
Unfortunately The Team has made the whole POINT of sharing data selective and obstructionist to limit the ability of other scientists to eliminate observer bias (motivation) as a source of error in the analysis.
The Team has been hypersensitive and condemning of anyone who would seek to challenge their motives. When faced with opportunities to defend their motives by sharing their data and code they often refused in order to prevent any destruction of their claims.
Their lack of confidence in their own work prevented them from exposing their data & code to reviews which would critique their choices made in analyzing that data.
It’s not their lack of confidence, Steve. It’s that they know what isn’t tendentious (forced into predecided conclusions) is outright lies. To be charitable, a fair bit of the former rests on incompetence.
And if one does not provide their data and code to aid in the investigation of their claims, what are we then rationally obligated to accept?
Mosh makes an excellent point.
All too often we see studies in which the results only show up when the data is tortured via convoluted mathematics. Yet which analysed by more conventional mathematics, the results disappear.
If your results are robust, they should not depend on the choices you made in analysing the data. If the results change depending on your methods, then the first thing you should suspect are your methods.
Unfortunately, all too few scientists speak out because of the “you will not last long” problem.
Silence is Golden is the rule all too often, especially among the incompetent. Don’t question my results and I won’t question yours. In that way our faulty science will remain above reproach while we collect our government grants. Should anyone ask, the dog ate the data.
“Mosh makes an excellent point.
He also mentions code, meaning equations with operators, special symbols, and constants. Mistakes are easy to make and hard to find. Especially true if you have looked at many lines of code dozens of times.
Steven Mosher,
Wonderfully put.
That kind of Feynman-like view is wisdom. An intellect should, to be in objective mode, fully aid critics to find all possible issues with one’s work.
Steve, Happy Holiday Season to you.
John
I second John’s statements. Thank you.
Steven Mosher,
Excellent! Feynman couldn’t have said it better.
Now, if you can just get Michael Mann to go along…
Let’s see some breakpoint data for the BEST project Steven.
Having asked politely for this 9 times now, I’m assuming your comments above contain some qualifiers as in, some data can be released and some not.
The graph is lacking one important feature – error bars. I believe we can safely assume measurement error was pretty large prior to invention of modern pH measuring methods and taking that into account, all ups and downs prior to 1970 can likely safely hide into it. All that’s needed for the data to be compatible with the ocean acidification hypothesis is for any measurements prior to 1970 to have pH +/-0.1 stochastic and +0.1 systematic error. And something tells me people were not after pH 0.01 accuracy before 1970.
Now what I really want to say is that this definitely needs some attention. The data don’t say much, but the reluctance to provide them is suspicious.
anytime your trend depends on the choice of endpoints, you have no trend.
I believe we can safely assume measurement error was pretty large prior to invention of modern pH measuring methods
No we cannot assume that. Stoichiometry is capable of highly precise, repeatable, measurements.
It is however safe to assume that measurements of equal precision are likely cheaper today than 100 years ago.
On the other hand, systematic error might be more common today with overconfidence on a black box experiencing instrument drift.
Kasuha, I agree on that point: pH measurements with glass electrodes may have been accurate to 0.1 pH unit in the early days, while we are looking for a trend of 0.1 pH unit over (the first) 100 years of human emissions. Thus I fear that most of the 2 million historical data simply can’t show the real trend in pH of the oceans…
And they need to be adjusted for salinity…
There is a host of variables that need to be discounted before the panicists hypothesis crosses the credibility threshold.
Curiouser and curiouser. Craig Welch, lead reporter of The Seattle Times 2013 award winning “Sea Change” series on ocean acidification, refers to the research of Richard Feely and Christopher Sabine as sources for the content of the series.
And Welch never responded to my letter pointing out the scientific misconduct in both the corals and the oysters he used for Sea Change. No retraction, no correction, nothing. See esssay Shell Ganes for the details and references to both acidification scares. Prof. Cliff Mass in Seattle also bogged this and tried to get Seattle Times’s attention based on my guest post at Judiths. No luck either.
A correction or two would interfere with the steady stream of awards the OA series has accumulated, like the du Pont award last week. Craig Welch and the Times have been less enamored of Dr. Mass lately due to his criticism of it. Welch’s response to Dr. Mass has citations of Feely and Sabine papers.
Afaik, the global carbon inventories, in billions of tons, are roughly as follows:
Fossil fuels, 4000; atmospheric CO2, 700; vegetation and soil, 2000; oceans, 40,000.
So burning all the fossil fuel we can reach could increase the oceanic CO2 content by about 10%.
It is difficult to create a catastrophe from a 10% change.
That leaves the scientists working for the US in a dilemma.
Recognizing that oceanic buffering overwhelms any possible CO2 effect conflicts with their employers mandate, expressed by Interior Secretary Sally Jewell, who announced that ‘climate change deniers are not welcome in the Department of the Interior’, the umbrella agency that manages NOAA. So they either toe the official line or leave, with not many places to go.
Eisenhower, in his prescient farewell address, spoke of the dangers arising from a government monopoly on scientific research funding. Climate science today could be the poster child illustrating his fears.
Oceans do not magically suck CO2 out of the air…
…if it did, we wouldn’t have any
Present CO2 levels are not high enough to affect ocean pH
Biological processes produce so much acid….the buffer would have to run out first….the oceans would be acid without CO2
Sorry, but Henry’s law is well known. Higher CO2 concentrations in the air means more dissolved CO2 in the water, leading to lower pH. And while there is plenty of “buffer” in the ocean, it’s a rate constant problem — the ocean can’t keep up with the increase in dissolved CO2. This page explains the biological impacts: http://www.pmel.noaa.gov/co2/story/What+is+Ocean+Acidification%3F
Barry, you just said it’s impossible to have a fish aquarium in a closed building…
use your head and stop buying into this crap
The inability to buffer claim is based entirely on the flawed model in question.
Barry, see the graph from Evans 2011 below. It is not a simple rate problem as you suggest. The upper ocean can deal with 3 times the current CO2 in a matter of weeks.
Barry is right in this case: any change in CO2 of the atmosphere translates to a 10% change (due to the Revelle/buffer factor) in total CO2 and a drop in pH of the upper ocean layer within 1-3 years. That is what is measured in several places over the past decades.
If that will have any impact on sea life is doubtful as the main calcifying organisms evolved at much higher CO2 levels during the Cretaceous, witnessed by the white cliffs of Dover and many such places all over the world…
Ferd, Barry is not right…..Barry said: “Sorry, but Henry’s law is well known. Higher CO2 concentrations in the air means more dissolved CO2 in the water, leading to lower pH”
the ability of water to absord CO2 is buffer dependent…..a higher buffer can absorb more CO2 and have no change in pH
Barry said: “And while there is plenty of “buffer” in the ocean, it’s a rate constant problem”
No it is not…..since buffers can change
Latitude, seawater is a rather weak buffer: it is in equilibrium at about 10% of the change in the atmosphere. That gives that the 30% increase in the atmosphere only shows up as a 3% increase in DIC (CO2 + bicarbonate + carbonate) in the ocean surface layer, even if free CO2 in the surface layer also increased 30% per Henry’s law. But free CO2 is only 1% of total carbon in seawater…
Further the quantities are not that different in the ocean surface layer as in the atmosphere: ~1000 GtC in the “mixed” ocean layer, ~800 GtC in the atmosphere. The 30% increase in the atmosphere did increase the surface layer with only 30 GtC. Which makes that the surface layer is fast saturated (1-3 years behind the atmosphere).
Fred, northern latitudes hold more CO2 than southern…it’s because they are higher in buffer
Henry’s law assumes there are no chemical reactions taking place….
the more buffer…the more acid you can add without affecting the pH
+10 Barry.
Atmospheric CO2 not in equilibrium with the ocean.
Sources maybe removed by thousands of miles from sinks.
Sources may become sinks and vice versa, depending on season or time of day.
And the inter-conversion of free CO2 and bicarbonate is about ten million times slower than a diffusion limited reaction. That’s why every living organism utilises carbonic anhydrase to speed the reaction up.
It’s not just economists that made unworldly assumptions about equilibrium.
Henry’s Law looks pretty flaccid in face of those home truths.
Yep, we should be really reaalllyy reeeaaallllyyy worried! Look at how CO2 has been so deadly to planet #3:
http://wattsupwiththat.files.wordpress.com/2013/06/co2_temperature_historical.png
Latitude, CO2 in the polar seas is higher and pH lower, because the temperature is lower and therefore more CO2 is absorbed (and transported to the deep)…
Due to the ocean’s buffering capacity and the biological pump, as seen in the graph below, the upper ocean can experience upwelling that drives CO2 levels to 3 times higher than what would be expected from equilibrating with the atmosphere. Within a week, the concentration of CO2 and thus pH drops to levels that are 70% of what atmospheric equilibration would predict.
http://landscapesandcycles.net/image/98786989.png
Read Evans (2011) Seasonal cycle of surface ocean pCO2 on the Oregon shelf. JOURNAL OF GEOPHYSICAL RESEARCH, VOL. 116
The upper ocean can deal with 3 times the current CO2 in a matter of weeks……
It has to…..biological processes (acid) are magnitudes higher…and the carbonates are CO2
Jim, careful, pCO2 pressure is not the same as CO2 content… pCO2 is caused by the amount of free CO2, that is 1% of total inorganic carbon (CO2 + bicarbonate + carbonate) in seawater. If the pCO2 triples, free CO2 may have tripled, but the rest of the carbon may have changed just a few % to give a new equilibrium…
Very few have much of a clue regarding the oceans’ complex water chemistry – I don’t. However, we might be able to educate the public a little by comparing their water chemistry to a swimming pool, which may be more familiar to people. Of course a swimming pool is a closed system, but the idea and importance of buffering can be demonstrated in a properly balanced pool.
In a pool the main concern is to control the alkalinity. The ideal pH range in a pool is 7.4-7.8. (Note that the pH of the human tears is about 7.5, which is considerably more “acidic” (less alkaline) than the normal ocean alkalinity.) The chemicals added to a pool, for health reasons and prevention of algae, are typically quite acidic – in the pH of 3 range. This causes the water to become acidic and makes for uncomfortable swimming and a bunch of other problems, notably corrosion. To counter the acid, alkaline chemicals are added – typically in the forms of sodium carbonate (soda ash, pH = 11.4) and sodium bicarbonate (pH = 8.4). It takes a lot of the bicarb (pH = 8.4) to counter the low pH acids, so initially the bicarb is introduced in large quantities and this provides an alkaline base. The oceans have this same alkaline base in enormous quantities. In the pool, this alkaline base prevents large pH swings when the sanitizing acids are re-introduced/refreshed. The soda ash, with its high pH, is used in small quantities to make small adjustments to the alkalinity. If too much soda ash is used, the pH will rise to an uncomfortable level. In this case, an acid is introduced to lower the pH and what is funny is that CO2 gas is sometimes, not often, used to accomplish the desired drop in pH.
As a pool is used, there are over two hundred known chemical reactions occurring in it and quite likely twice that many unknown chemical reactions. These reactions constantly change the pool water chemistry, which requires constant oversight and testing. Lord knows how many chemical reactions are occurring in the oceans every second. The hubris of scientists, to think man is causing much to change ocean water chemistry, is astounding to me. When one considers all the effort we expend to control the water chemistry of a dinky water source like a pool, it is stupid to think we can influence and “control” the oceans’ water chemistry.
Oh yes, it’s so complicated that no one can know anything. Let’s just throw up our hands and keep polluting the planet. See previous comment explaining that it’s a rate constant problem, not an equilibrium one.
No one suggests we keep polluting the planet. That is a red herring. CO2 is not a pollutant but plant and plankton food.
Algae consume 500 billion tons of CO2 each year. The atmosphere holds 700 billion tons of CO2. We better hope something keeps eating the algae or we are in deep do-do.
Barry December 23, 2014 at 10:47 am Edit
Thanks, Barry, but I fear you have the problem backwards. It’s not that “no one can know anything”, nobody’s saying that but you.
The problem is that the natural world is indeed amazingly complicated, but despite that, people keep claiming that they know everything, and that “the science is settled”.
w.
Barry, I’m sorry…you don’t have a clue
Henry’s law assumes there are no other chemical reactions getting in the way….
…The higher the buffer, the more CO2 it can hold
That fact says it’s not a “rate constant problem”
Your PMEL link, says nothing about kinetics, Barry. It’s all about local equilibrium chemistry. Your kinetics argument is your own, and it’s merely an implicit proposition that not enough carbonate or oxide solids can dissolve fast enough to buffer surface waters to an invariant pH 8.1-8.2 as atmospheric CO2 increases. But you provide no evidence that this is important, and you show no evidence of understanding that the response of organisms is driven by metabolic energy, rather than chemical equilibration.
Your PMEL link gives a good example of this lack of understanding. It shows an empty pteropod shell dissolving over 45 days in water purportedly as it would be in the year 2100; presumably pH 7.9 bicarbonate (they don’t say). This shell is supposed to represent the fate of living pteropods. But an empty shell has no biological response.
Why didn’t they try the experiment with a living pteropod? Could it be because living pteropods can adapt to environmental pH? Especially interesting in that linked study, was that the researchers added HCl to make their pH adjustments, rather than bubble excess CO2 into the water. That means the pteropods did not have the benefit of higher pCO2 when they faced the challenge of lower pH. And yet, they were able to adapt anyway.
Pteropods produce a proteinaceous coat that covers the outside of their shell. It prevents direct contact between shell carbonate and sea water. Guess what that means as regards susceptibility to a small decrease in alkalinity. But, of course, the PMEL’s empty shell can’t maintain a protein coat, if it had one at all (they don’t say).
Here is a link to ocean acidification literature collected at CO2 Science. Go ahead and read through it. You’ll discover that the future is much more interesting than you expect. Biology is clever, adaptable, and has a large evolutionary bequest. Chemistry is only a small part of that, and equilibrium chemistry an even smaller part.
Calling CO2 “pollution” as you do is just language touted by green NGOs in order to channel your thinking. If you start out believing CO2 is a pollutant, you’re immediately susceptible to accepting specious proofs that it’s a pollutant.
So, what’s it going to be, Barry? Critical thought or normative moralization?
Your PMEL link, says…………”In areas where most life now congregates in the ocean, the seawater is supersaturated with respect to calcium carbonate minerals.”
and if someone doesn’t understand the processes that led to supersaturation….they would believe it can run out
Barry: my comment above is an attempt to educate the non-chemists who visit this site as to the importance of a buffered system by using an example with which they might be familiar. There are those who are taking advantage of the populace’s lack of chemistry knowledge and only education will combat their nefarious purposes. Ocean chemistry IS very complicated and wonderfully we are slowly learning more each day. To my last CO2 laden breath I will support further research. However, the reality is that we know very little at this point and have a very long ways to go. Hubris: the tendency to think we are gods. We are not.
Willis & Pat Frank: spot on.
”In areas where most life now congregates in the ocean, the seawater is supersaturated with respect to calcium carbonate minerals.”
Doesn’t a solution need to be cooled to become “supersaturated”? Just askin’
Rh, no
OK, so I will spell this out:
“The natural pH of the ocean is determined by a need to balance the deposition and burial of CaCO3 on the sea floor against the influx of Ca2+ and CO2−3 into the ocean from dissolving rocks on land, called weathering. These processes stabilize the pH of the ocean, by a mechanism called CaCO3 compensation…The point of bringing it up again is to note that if the CO2 concentration of the atmosphere changes more slowly than this, as it always has throughout the Vostok record, the pH of the ocean will be relatively unaffected because CaCO3 compensation can keep up. The [present] fossil fuel acidification is much faster than natural changes, and so the acid spike will be more intense than the earth has seen in at least 800,000 years.”
More here:
http://en.wikipedia.org/wiki/Ocean_acidification
It’s not “an acid spike,” Barry. If anything, it’s an alkalinity decline. The Wiki description is itself couched in specious language.
Second, the claim that it’s the largest descent in 800,000 years is based on the assumption that ice-core CO2 accurately follows atmospheric concentrations. But the record of fossil plant stomata refutes the ice-core record, at least over the last 13,000 years.
Further, the resolution of ice-cores is determined by the time of closure of the firn (solidification time of snow into ice). That time is typically 80-120 years. During closure of the firn, ice CO2 equilibrates with atmospheric CO2, and the record smears out. That means no one knows from the ice-core record whether CO2 spiked up for several decades, or not. From the stomata record, it may have done. Notice that the stomata record is invariably higher than the ice core record, where both sets of data exist.
Your worries are misplaced, Barry. You’re not thinking critically.
Pat Frank,
Second, the claim that it’s the largest descent in 800,000 years is based on the assumption that ice-core CO2 accurately follows atmospheric concentrations.
Ice core CO2 accurately follows the CO2 in the atmosphere, be it averaged over 10 to 600 years, depending of the snow accumulation. 10 years of resolution is over the past 150 years, ~20 years over the past 1,000 years, 40 years over the past 10,000 years and 560 years over the past 800,000 years.
The current 110 ppmv spike in CO2 over the past 160 years would be detected in all ice cores, including the least resolution cores as the repeatability of CO2 measurements in ice cores is 1.2 ppmv (1 sigma), thus a spike of 100 ppmv, sustained over 10 years, would be noticed in the Dome C 800 kyear record. Or a sustained change of 2 ppmv over 560 years.
In contrast, stomata (index) data are proxies, with all the problems involved. They show the local CO2 variability of where the plants grow, where CO2 levels are changing with the CO2 uptake/release in the main wind direction. That includes huge land use changes over the centuries even changes in the main wind direction in certain periods (MWP-LIA-current).
The local bias in CO2 levels can be compensated for by calibrating the stomata data to direct measurements, firn and… ice cores over the past century. But there is no knowledge how the local bias changed over the centuries… Thus while the stomata data give a good idea of the local CO2 variability, their absolute CO2 levels should be taken with a lot of salt.
Anyway, even if there is some migration (not even measurable) in ice cores, that doesn’t change the average of the CO2 levels over the period of resolution. If the stomata data show a different CO2 level over the same period, the stomata data are certainly wrong…
Ferdinand, the average firn closure time at Law Dome, Antarctica, is about 50 years. See Etheridge, et al., (1996) JGR 101, 4115-4128. Law Dome was chosen for its almost ideal characteristics. The exchange time before closing is about 10 years at depth, so that the averaging with atmospheric gases is reasonably complete over the firn closure time.
Even at Law Dome, then, “accurately” following atmospheric CO2, as you have it, does not mean accurately reproducing the absolute values of CO2. ‘Accurately following’ means no more than statistically correlated. The 110 ppmv increase in CO2 since 1850 that you mention would show up in well-behaved annually resolved ice cores, but not as a 110 ppmv rise. The apparent maximum would be reduced and the trend would be flattened.
It is true that stomata are proxies for CO2. But their population is strongly determined by ambient CO2 levels. While there are other determinants stomata are only weakly affected (pdf) by water stress or typical variations of irradiance, and so they do not suffer “all the problems” of such proxies as tree rings, corals, or spleothems.
Local winds that might change ambient CO2 levels on a daily basis will not affect stomata number, which cannot vary day-to-day, but will effect the diffusion of CO2 through a firn layer. So, the wind variable you mention will more affect ice core CO2 than it will stomata count.
The idea, in any case, that CO2 is globally well-mixed seems to have become suspect. It now seems possible that Antarctic and Arctic ice cores may under-reflect the global average atmospheric CO2, apart from the averaging effect of the firn.
Recent use of fossil stomatal index has shown large swings in CO2 concentrations during the Miocene. Your dismissal of stomata is too casual, Ferdinand. In my view, where stomatal index indicates a disparately higher level of CO2 than the contemporaneous ice core data, it’s more likely the ice core is wrong, shown here, for example in a comparison for the 13th century.
Pat Frank,
Have you read the full work of Etheridge e.a. of 1996, he explicitly refutes several of your objections. There is no influence of wind on the CO2 levels in the firn near the atmosphere: they are exactly the same as above the surface. The Law Dome ice cores have an overlap of ~20 years with the atmosphere and reflect the atmospheric CO2 levels within +/- 1.2 ppmv for the same average gas age:
http://www.ferdinand-engelbeen.be/klimaat/klim_img/law_dome_sp_co2.jpg
The averaging makes that the ice core record lags the changes in the atmosphere and that fast peaks are suppressed, but for the Law Dome ice cores, any peak of 20 ppmv happening over only one year should be just detected or a 10-year sustained 2 ppmv increase…
The 110 ppmv increase in CO2 since 1850 that you mention would show up in well-behaved annually resolved ice cores, but not as a 110 ppmv rise.
Depends of the resolution of the ice core and the length of the maximum. If the rise has a maximum longer than the resolution, the full ppmv rise will be detectable, as is the case for the -relative- slow increases and decreases of CO2 over the past 800,000 years. But for the current rise, where the end is not in sight, the ice cores only follow the increase with a lag which depends of the resolution.
It is true that stomata are proxies for CO2. But their population is strongly determined by ambient CO2 levels.
The problems are mainly in the ambient CO2 levels. Not the daily wind variations, but the level of CO2 over months, years and centuries imported by the prevailing winds. The tall tower in Cabauw, Netherlands can detect that corn is grown in the main (SW) wind direction…
One of the best stomata data in The Netherland is a thousands of years natural oak forest in the SE. In the main wind directions: SW to NW (of today!) sea was converted to land and agriculture, heather fields to forests and since 1.5 century industrialization, increased population and transport… The local offset (~40 ppmv in Giessen, SW Germany) can be calibrated away by comparing the stomata data to direct measurements and ice cores in the previous century, but nobody knows the influence of land use changes in the main wind directions and of changes in the main wind directions themselves (MWP-LIA) in the course of the centuries.
That makes that while stomata data have a better resolution than ice cores, their variability is mainly local and their averaged CO2 levels, if they differ from the ice core data over the resolution period of the ice core, are certainly wrong. Averaging does remove peaks, but doesn’t change the average over the resolution period… See:
http://www.sciencemag.org/content/286/5446/1815.full
Pat Frank, I have looked deeper into the stomata data as proxy.
First the error estimate of stomata data even over the previous two centuries is large (+/- 67 ppmv!):
http://hol.sagepub.com/content/19/5/757.abstract
Then the problem of huge CO2 changes in short time over the past:
from http://www.sciencemag.org/content/286/5446/1815.full
the trend can be enlarged:
http://www.sciencemag.org/content/286/5446/1815/F1.expansion.html
The resolution of the Taylor Dome ice core over the Holocene is ~40 years. At 11,300 years BP (1950), the stomata data and ice core data are equal. During the period 11,250-10,600 years BP, stomata data are average 330 ppmv, ice core data at 265 ppmv. A difference of 65 ppmv sustained over 650 years (borderline the above accuracy of stomata data). The change is long enough to be fully visible in every Antarctic ice core drilled until now. But is not measured in any ice core…
The difference in CO2 levels between all ice cores drilled in Antarctica with the most extreme differences in snow accumulation and temperature is not more than 5 ppmv for the same average gas age…
Thus sorry, while stomata data give a rough idea of (local!) variability and CO2 levels, their use for absolute CO2 levels in the bulk of the atmosphere is very limited and they certainly don’t refute the ice core data for average CO2 level over the period of resolution of the ice cores…
Ferdinand, regrets for the delayed response — holiday distractions and all that. . . 🙂
I have read Etheridge 1996, and understand your point about Figure 3. However, I believe you have overlooked that the points represent the very top of the compacted ice region, where correspondence to atmospheric composition is bound to be greatest.
As a smaller point, though, Etheridge, et al., corrected their empirical CO2 measurements for gravitational diffusion. They used their empirical 15-N measurement to estimate the gravitational diffusion rate, rather than the value from the barometric equation. Reliance on the empirical value automatically corrects the 15-N for any convective mixing due to wind shear.
This means their CO2 measurements were empirically corrected both for gravitational diffusion and for convection in the firn. So, it’s not too surprising that their corrected firn and upper ice CO2 values were so close to the atmospheric measurements.
Convective mixing due to wind shear does happen in firn, see here, where this is mentioned. According to J. Turner, et al., (2001) JGR 106, 7291-7311, strong high-wind storms were recorded near Law Dome about 10 times per year between 1969-1996.
Convective mixing due to wind mixes the atmospheric gas between 2-10 meters into the firn, amounting to 2-20 years of averaging, depending on snow accumulation rates.
However, the issue about accuracy concerns the extended record, not just the most immediate compaction zone.
The major problem affecting correspondence with contemporaneous gas mixing ratios is the diffusion of gas vertically through the ice over time. Gas dissolved in ice is in equilibrium with gas in bubbles above about 500 m, and with gas in the clathrates that appear below that level.
The empirical diffusion coefficients for N2, O2, and CO2 in ice cores was reported by Bereiter, et al. (2009) GRL 36 L05703. At 220 K, a typical deep core temperature, the diffusion coefficient for CO2 is 3.1×10^-11 m^2/sec. From this, one can estimate that CO2 can diffuse at the rate of 0.076 cm per year through the ice, in each direction. Of course, only vertical diffusion, (+/-)z, is important for coherence of ice core layers.
Equilibration with bubbles and clathrates means net migration of CO2 in ice across concentration gradients. This exchange would continue until a new equilibrium is attained across the diffusion zone.
That diffusion rate means ice-core CO2 in a given layer can migrate 76 cm per 1000 years. If we assume 1 cm per year of ice, 1000 years produces approximately a 152-year average. Over a few thousand years, the bulk ice CO2 may migrate across more than a meter. The result is to smear out excursions, as ice core CO2 slowly equilibrates to produce a mean of CO2 averaged over centuries, and then millennia.
If atmospheric CO2 were varying across 250(+/-)50 ppmv over several thousand years, it would seem this variation may be quite smoothed out by diffusion, and any short-term spike would be greatly attenuated. Mostly one would see an artifactual average that would make [CO2]atm seem quite constant over intermediate-length times, apart from large ice-age shifts.
In fact, one sees this effect in Lüthi, et al, (2010), EPSL 297, 226-233. They report larger variations in measured CO2 with per-cm vertical distance in younger ice earlier in an ice core clathrate zone, and smaller variations in older ice at deeper core, consistent with increasing homogeneity with time. They ascribe this aging effect to diffusion within the ice.
Likewise, B. Stauffer, et al. (2003) (pdf) (Mem. Natl Inst. Polar Res., Spec. Issue, 57, 139–152) reported multiple CO2 measurements every ~1-cm in two Antarctic ice cores (Khonen Station and Concordia Dome). The scatter among measurements decreased with the age of the ice; (+/-)3.8 ppmv at 147.4 m (930 year ice), (+/-)2.8 ppmv at 219 m (4270 year ice) and (+/-)2 ppmv at 521.7 m (16500 year ice). This trend was apparently surprising to them. Most likely these show the smoothing out of concentration differences in ice CO2 because of diffusion.
Lüthi, et al, (2010) proposed that after long times, the mean atmospheric CO2 concentration is regained, but only if one samples >10 cm of ice. This seems to be putting a favorable light on the problem.
All of this implies that the early Law Dome results of Etheridge are uncharacteristic of CO2 behavior over long times in ice cores, and should not be relied upon to indicate long term accuracy. Also, that after ~10 thousand years, ice core CO2 will no longer show perhaps even century-scale variations, but can t best only represent a long-term mean atmospheric concentration.
Ferdinand, I’ve looked at the stomata references you cited. First, Finsinger, et al., 2009 compared the stomata of plants grown in herbariums in Denmark, with the ice core CO2 index of Mauna Loa and Law Dome. That is very localized sets of plants are compared with global averages. This is a bit of apples and oranges.
It is significant that the stomatal reconstructions matched the modern Mauna Loa direct measurements but departed from the century-old Law Dome reconstructions.
As the (+/-)68 ppmv error you quoted was derived by the assumption that the Law Dome reconstructions were completely accurate representations of atmospheric CO2, one cannot use this disparity to discredit the stomata reconstruction relative to the Law Dome reconstruction. I.e., such a critical analysis is circular.
A better indication of intrinsic error in stomatal reconstructions is the (+/-)18 ppmv Finsinger, et al., give for the training period, where modern stomatal density or stomatal index is regressed against modern CO2 measurements. Likewise, Stults, et al., 2011 found a stomatal density error of (+/-)22 ppmv.
Your Science references, both of them to Indermühle, et al., 1999 merely dismisses the stomatal index CO2 reconstruction by Wagner, et al., because it disagrees from the Law Dome reconstruction. Such a dismissal is tendentious and is not a legitimate disproof of the stomatal reconstruction.
Perhaps you didn’t notice, but below Indermühle, et al., 1999, on the same page in Science, was a written rebuttal by Wagner, et al., that points out that Indermühle, et al., rested their critique on stomata measurements from “altitudinally and latitudinally contrasting growth areas,” and on stomatal density measurements rather than the more reliable normalized stomatal index.
Notice also the ice core reconstructions of Indermühle, et al., concern the Holocene centered around 11000 years BP. We know from the diffusion rate of CO2 in ice, which I noted above, that smearing is possible across (+/-)8.4 meters of core, which approximately averages 840 years of CO2 deposition.
In general, the gas inside ice core bubbles is in equilibrium with the gas dissolved in the ice. The gas dissolved in the ice diffuses about 1 mm/yr along (+/-)z. So, after every 1000 years, the ice core resolution of CO2 flux is reduced by about (+/-)100 years because of averaging.
I also looked at the four references Indermühle, et al. gave for what they call, “direct measurements on air that has been enclosed in bubbles” (Refs. 3,4,7,8). In fact, they did not measure CO2 directly in gas samples taken from inside bubbles (quite possible with modern analytical methods), but rather CO2 released from bubbly ice using a dry cold needle ice crusher. Needle crushers reduce ice core samples to mm-size bits. The gases released from the core are therefore from broken bubbles and from the ice itself, not from the interior of the bubbles alone.
Finally, in stomatal reconstructions, among other variables, one must be careful to choose plants that are known to respond well to changing [CO2]atm. D. L. Royer’s 2001 review of stomata as an indicator of atmospheric CO2 discusses this in detail, with long appendixes listing the traits of various candidate species. Some of the variability of stomatal results may be due to using poorly sensitive plant species. I haven’t looked into that aspect.
However, from all this, I remain of the conclusion that stomatal reconstructions provide a better record of paleo-excursions in atmospheric CO2 than do ice core records, including back in the Holocene, and that ice core CO2 declines in resolution with greater age.
It turns out, at Law Dome, the average core length per year is ~40 cm. So, my estimate of CO2 averaging by diffusion needs to be revised.
Taking 40 cm per year of core ice as typical, two years of trapped CO2 are averaged every 400 years with a standard CO2 diffusion rate of 1 mm per year. That means the resolution per ice-core year-point is 50 years of atmospheric CO2 averaged after 10,000 years, 500 years averaged after 100,000 years, and 1000 years averaged after 400,000 years — the time-length of the Vostok core.
So, for the mid-Holocene, 5000 years before the present, each ice-core year will represent a 25-year running average of atmospheric CO2. That’s from diffusion-averaging alone.
From the orginal publication of Petit, et al., 1999, it seems the Vostok glacial ice core record consists of 420,000 years recorded in 3350 meters of ice. That averages 1 year per 0.8 cm of ice.
Assuming diffusion is the rate limiting step in CO2 migration, the 1 mm per year rate implies a 2-year averaging every 8 years. So, the estimates above for 1 cm progressive loss of resolution of atmospheric CO2 are relevant to the Vostok core.
The Concordia Dome ice core turns out to average about 0.43 cm of ice per year, so the loss of resolution of atmospheric CO2 by diffusion averaging is about twice the rate of Vostok.
Is there anything left in the climate alarmist armoury of scary stories/pseudo-science that has not now been totally debunked?
I found this post very disquieting as it is yet another major abuse of the scientific method by those who we should be able to trust in the ‘climate science’ fraternity.
I find this more than disquieting – and I think we all need to sign the petition – how can we allow the data record to be censored? or tolerate cherry picked model output presented to Congress?
Look at Feely’s CV. Nobel Peace Prize (co-shared with Al Gore and other members of IPCC) – 2007. Yet another one.
It’s a license to kill science.
Another Hide The Decline, this time about ocean acidification.
So, the general rule now is that when scientists start making threats, you just know there is something being hidden.
The general rules are found in the Baloney Detector. Alarmists have trouble validating most of their assumptions when those rules are enforced.
PhGate?
AcidGate?
In private industry hiding data that disproves a hypothesis would be grounds for firing.
There is case after case where there is strong evidence that a cabal of climate change ‘scientists’ are working to push an agenda, rather than to solve scientific problems.
http://link.springer.com/article/10.1007%2Fs11191-013-9647-9
Climate Consensus and ‘Misinformation’: A Rejoinder to Agnotology, Scientific Consensus, and the Teaching and Learning of Climate Change
As soon as I saw the blue squiggle, I knew models were involved.
I never understood how they could sell the idea that oceans, that are supposed to be warming, would absorp CO2, which they don’t. Warming oceans release CO2, cooling oceans absorp CO2.
Manmade acidification is a h-o-a-x, as we now know for sure. It’s based on a Phraud.
I can’t wait to see these climate clowns doing a lot of time for their crimes.
The warming increases the pCO2 of the oceans with not more than ~8 μatm/K that is about 6 ppmv since the LIA. The increase is currently ~110 μatm (~ppmv) above equilibrium for the current average ocean surface temperature. Per Henry’s law the ocean surface is a net sink for atmospheric CO2…
…and during glaciation as the poles ice extends over more ocean area, resulting in a decrease in cold water to absorb atmospheric CO2. Probably explains the yo-yo of CO2 following the glaciation periods. Everyone knows that. 🙂
I don’t quite understand. Warming increases the pCO2 of the oceans? Could you please explain this?
And correct me if I’m wrong about warming/release and cooling/absorp?
highflight56433, the sink rate is higher in winter than in summer, as the ocean sinks are at the edge of the freezing ice. Ice formation expels most of its salts and makes the also cold waters heavier than the deep ocean waters. In summer when the ice melts there is less sink capacity…
cosmicclimate, it is as follows: warmer (ocean) water builds up CO2 pressure to escape from the solution. If the pCO2 (partial pressure of CO2) of the ocean is lower than the pCO2 from the atmosphere (~ppmv), then the direction is into the oceans, no matter its temperature. The reverse pressure difference gives a flux from the oceans into the atmosphere. If both pressures are the same, nothing happens, whatever the temperature of the oceans or atmosphere.
The pCO2 in the atmosphere is given by its volumetric CO2 content (ppmv) minus water vapor which is maximum a few % near sea level. pCO2 in water is a mix of temperature, pH, bio life and total carbon (DIC) content… In general measured by mixing seawater with air till equilibrium and measuring the CO2 level in the air.
Thank you. It gets more and more complex, the more you learn and try to understand.