 Guest essay by David Archibald
A couple of years ago the question was asked “When will it start cooling?” Of course solar denialists misconstrued this innocent enquiry. There is no doubt – we all know that lower solar irradiance will result in lower temperatures on this planet. It is a question of when. Solar activity is much lower than it was at a similar stage of the last solar cycle but Earthly temperatures have remained stubbornly flat. Nobody is happy with this situation. All 50 of the IPCC climate models have now been invalidated and my own model is looking iffy.
Friss-Christenson and Lassen theory, as per Solheim et al’s prediction, has the planet having a temperature decrease of 0.9°C on average over Solar Cycle 24 relative to Solar Cycle 23. The more years that pass without the temperature falling, the greater the fall required over the remaining years of the cycle for this prediction to be validated.
The question may very well have been answered. David Evans has developed a climate model based on a number of inputs including total solar irradiance (TSI), carbon dioxide, nuclear testing and other factors. His notch-filter model is optimised on an eleven year lag between Earthly temperature and climate. The hindcast match is as good as you could expect from a climate model given the vagaries of ENSO, lunar effects and the rest of it, which gives us a lot of confidence in what it is predicting. What it is predicting is that temperature should be falling from just about now given that TSI fell from 2003. From the latest of a series of posts on Jo Nova’s blog:

The model has temperature falling out of bed to about 2020 and then going sideways in response to the peak in Solar Cycle 24. What happens after that? David Evans will release his model of 20 megs in Excel in the near future. I have been using a beta version. The only forecast of Solar Cycle 25 activity is Livingstone and Penn’s estimate of a peak amplitude of seven in sunspot number. The last time that sort of activity level happened was in the Maunder Minimum. So if we plug in TSI levels from the Maunder Minimum, as per the Lean reconstuction, this is what we get:

This graph shows the CET record in blue with the hindcast of the notch-filter model using modern TSI data in red with a projection to 2040. The projected temperature decline of about 2.0°C is within the historic range of the CET record. Climate variability will see spikes up and down from that level. The spikes down will be killers. The biggest spike you see on that record, in 1740, killed 20% of the population of Ireland, 100 years before the more famous potato famine.
I consider that David Evans’ notch-filter model is a big advance in climate science. Validation is coming very soon. Then stock up on tinned lard with 9,020 calories per kg. A pallet load could be a life-saver.
David Archibald, a Visiting Fellow at the Institute of World Politics in Washington, D.C., is the author of Twilight of Abundance: Why Life in the 21st Century Will Be Nasty, Brutish, and Short (Regnery, 2014).
UPDATE:
For fairness and to promote a fuller understating, here are some replies from Joanne Nova
Monckton of Brenchley says:
June 28, 2014 at 12:58 pm
Many will be watching. Many will remember.
And many will remember [one might hope] your silly comments trying to cover for Mr Evans.
Leif and Greg, the TSI data being used DOES show a drop-off in recent years, look at the troughs here: http://lasp.colorado.edu/lisird/tsi/historical_tsi.html
But, the source of the data mentions a splicing of 2 different data sets, so that may be an issue.
If I was going to predict a drop in temperature I’d check exhaustively that the TSI data supports it.
Mr Svalgaard said Dr Evans was deliberately using wrong TSI data. He now knows that was false. He said, on the strength of that false allegation, that Dr Evans was acting in an almost criminal fashion. Having been caught out, he has refused to apologize as he should have done, and has instead tried to explain away his absurd tampering which, like the USHCN tampering to invent data from non-existent temperature stations, fabricated a trend on nine months of missing data. He is a quack, not a scientist. This was not inadvertence on his part: it was plain wickedness. Nothing he ever says again on any scientific subject can or will be taken seriously. He is finished, dead by his own hand.
Oh dear, the text on the graph says they used mean of Jul 2012- Feb 2013 to pad out data to 2015. Credit due for colouring differently.
Looks like they must have padded the 25y SST in a similar way.
Part of what makes the drop remarkable is the distortions of the running mean. Note how the 1990 peak is inverted.. Also IIRC the Lean et al method adds back in the 11y average. to give their TSI reconstruction. That is presumably a trailing 11y mean, so that adds a 5.5y lag.
It starts to become clear why this is so similar to the relaxation calculation.
Action of cosmic radiation.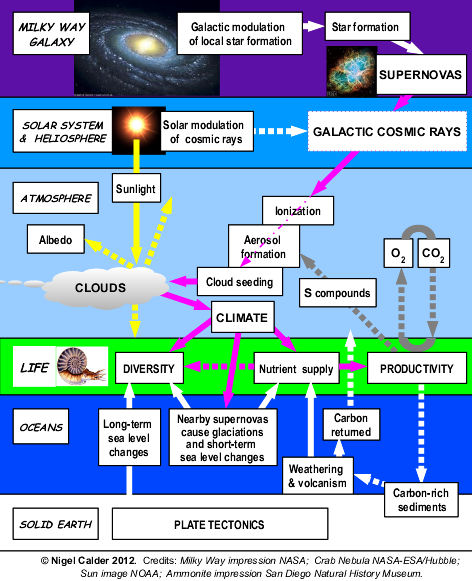 ?w=450&h=553
Despite Solar Cycle 24 having low sunspot activity, TSI is running slightly higher than SS23. The lull in TSI between SS23 and SSS24 is plainly evident in the UAH temperature record and wiped out all of the temp anomaly of the preceding years. Sunspots are only a proxy for TSI and until SS24 radiation levels start to tail off, we should not expect to see much change in global temperature averages.
MikeUK says:
June 28, 2014 at 2:40 pm
Leif and Greg, the TSI data being used DOES show a drop-off in recent years, look at the troughs here: http://lasp.colorado.edu/lisird/tsi/historical_tsi.html
But, the source of the data mentions a splicing of 2 different data sets, so that may be an issue.
It is indeed an issue. The splicing is done to the PMOD data which had a lower 2008 minimum than the preceding minimum. However, the PMD data suffers from unmodeled degradation and as W. Smutz has shown the 0.2 W/m2 difference is not real, but an effect of that degradation, see. e.g. slide 36 of http://www.leif.org/research/Another-Maunder-Minimum.pdf
So there is no evidence for a decline of TSI at that solar minimum
Monckton of Brenchley says:
June 28, 2014 at 2:44 pm
Mr Svalgaard said Dr Evans was deliberately using wrong TSI data. He now knows that was false.
No, he does not know that. On the contrary he has shown that Mr Evans used wrong TSI data. This is either incompetence [I will allow for that hence my ‘almost’] or a deliberate act [you made that call].
Folks who think they are experts would do well to read and understand the work of Philip Tetlock.
Some humility is in order.
MikeUK says:
Leif and Greg, the TSI data being used DOES show a drop-off in recent years
Indeed it does. You can see that reflected in my relaxation graph too. Though it is mostly the magnitude of the positive swing that changes not the base line.
However, what you link to is not “TSI data” it is a “TSI reconstruction”.
There seems to be less support for these ramped up recon. plots now, which is Leif’s main contention. TSI should be reconstructed from SSN directly , not adding back in some longer term average. That seems like double counting to me and I’m not sure on what theoretical grounds ( if any ) this was done.
There is recent decline which has been going for the last 3 cycles and to a lesser extent since 1960.
If one assumes the climate system equilibrates almost instantaneously, that would imply there should be a cooling since 1960. However, if there is some stockage of the incoming energy that dissipates over time, some kind of relaxation response should be expected. That seems a more realistic proposition than instantaneous equilibration.
I did a very quick stab at that with the most simplistic single slab ( single reservoir ) model, giving a single time constant. It fits rather well over all but shows divergence since about 1990. Due to the reservoir effect, the drop starts later.
A more realistic model would have a second reservoir with a longer delay and that would prop up the end of the data. Such a model would drop off slower too, leading to a slow decline rather than Evans’ sudden drop.
The divergence may also indicate some other factor is propping up recent temps. That may be AGW, or maybe the extra incoming SW since Mt Pinatubo:
http://climategrog.files.wordpress.com/2014/04/tropical-feedback_resp_ci.png?w=843
The other possibility is that all this is a total coincidence, there is no relation between SSN and surface temps, they just happen to go up and down in a similar way. Correlation is not causation etc.
Are there solar denialists? Do we have to use the term? Would Willis Eschenbach be called a solar denialist?
The study of solar influences on climate is in its infancy – there is no need to start dividing critics along supposed differences in belief while a proper theory is very far away.
Boy am I naive…. I thought skeptics were above name calling and slinging mud at each other. I thought that was an alarmist characteristic. My respect for many of you has dropped considerably based on this single post. Not that it matters to any of you, you are too busy playing in the gutter.
A good deal of ammunition (talking points) has now been created for the alarmists, thanks guys.
I have used this website as a reference in many past emails to friends but will no longer be doing so.
Dr Evans analysis is flawed but not fatally so. The early parts of it are insightful and useful. However his model pushes things too far in my opinion and the “bomb test” correction in his model looks like a massive fudge factor to me; a sign that the model has been stretched beyond the point of usefulness.
Leif – I understand your frustration that he seems to have ignored your work in correcting the sunspot/TSI record. At the very least, if he didn’t want to use your updated figures, he should have commented on them and explained why. However this doesn’t invalidate his work (at least the early parts) because the majority of his analysis is carried out in frequency space and is completely insensitive to the corrections you made. He WILL find the same “notch” using your figures.
Similarly, because almost all his analysis is carried out in frequency space, it is insensitive to “corrections” and “adjustments” to the temperature record as well. It doesn’t matter which temperature figures he uses and how they were massaged. As long as the adjustments don’t tamper with the frequency spectrum of the data he will get the same result.
Willis – you note that he would have found the same notch if he had used white noise for temperature. Well duh! If your input (TSI) has an 11 year oscillation and your output (temperature) shows no such oscillation (because you’ve replaced the real data with white noise) then there is obviously some kind of disconnect between input and output. If you model the disconnect using a filter, then the strongest frequencies present in the input will need to be most strongly filtered and you’ll see an 11 year notch.. That is precisely the point. Temperature should show an 11 year cycle because TSI has such a cycle. It doesn’t and that requires explanation. This observation is extremely robust to adjustments to either the TSI record or the temperature record.
The second insightful observation in my opinion was that the physical basis for such an 11 year filter has to come from an indirect solar effect, and that magnetic field strength has the correct timing to provide a physical basis for such a filter. Field strength is low when sunspot numbers and TSI are high. However field strength isn’t determined by sunspot numbers. At times of low solar activity (such as we are now starting to see) field strength becomes generally lower at all phases of the solar cycle. If field strength is your suggested physical mechanism then trying to impute it from TSI figures just using a simple delay is not good enough.
Beyond this point he loses me. I think his model is flawed. Clearly the model WILL be effected by corrections to the TSI record ( a la Leif ) and to the temperature record ( a la the various climate sausage factories ). Furthermore if magnetic field strength is the physical basis of his notch then an 11 year delay filter is a very poor way to model it. The “bomb test” fudge factor is a sign to me that he may have fitted an elephant.
Nevertheless there is value here. He is showing us where to look for evidence of an indirect solar effect. We need to look at the reason why the dog isn’t barking in the night – variation in TSI is not showing up as variation in temperature. An indirect solar effect in counterphase is the perfect explanation. And if this indirect effect originates from magnetic field strength then at times when the sun is quiet we should also see overall cooling.
They will never ever admit that the sun drives out climate and not human induced greenhousegasses. That does not mean we can polute btw. Because our way of living makes account a lot of UFP’s floating around in the air we breath. And UFP’s causes cancer.
What I like about this is that we will know whether or not the proposition is sound in a relatively short time, unlike all the thermogeddonists’ claims which conveniently project forward so far in time that they (and we) will all be dead before we know whether or not they are correct.
So, I have a question for the participants in the little spat which has been going on here. If Archibald and Evans (and by extension Monckton) are shown to be wrong in 10 years or so, will they admit it and apologise and, similarly, if they are shown to be correct, will Svalgaard do likewise?
Greg Goodman says:
June 28, 2014 at 3:42 pm
TSI should be reconstructed from SSN directly , not adding back in some longer term average. That seems like double counting to me and I’m not sure on what theoretical grounds ( if any ) this was done.
In addition the sunspot group that are created at a rate of about one a day, everyday thousands of little magnetic bipoles [called ephemeral region, ERs] are also created. It was once thought that those would add a significant contribution to TSI and that their emergence rate was a function of general solar activity: the more sunspots, the more ERs. So they would constitute a varying ‘background’ on top of which the regular sunspot-related TSI would ride. The assumption was that a running 11-yr average of the Group Sunspot Number would be a measure of that background [so indeed the sunspots were counter twice], see 34 of http://www.leif.org/research/Another-Maunder-Minimum.pdf
Hagenaar et al [2008] have shown that this assumption is false, and that ERs erupt at a rate that is almost, if not absolutely, unrelated to the sunspot number. Therefore all TSI reconstructions that assume that varying background are not correct. This is not controversial, see e.g. http://www.leif.org/research/2011GL046658.pdf
Thanks to Stephen Wilde and thinkingscientist for some civil discourse. A few levels above the vitriol expressed in the some of comments in this post. I suspect that I am not the only visitor to this and other sites that tend to ignore the vitriolic comments.
Monckton’s rabid response to a mere plot average that meaninglessly jumped a gap is yet another red flag that this whole exercise may be an organized PR stunt gone bad. I fear an insider circle has turned to the dark side and intend to fight fire with fire by themselves playing sensationalist dirty pool to compete with Steven Goddard at the same strategy. Those supporting this model don’t seem to enjoy critical feedback at all, an extremely valuable commodity to obtain compared to merely being ignored. Now Monckton is channeling prickly Mann in a world gone topsy turvy mad. Is Leif’s graph wrong I don’t know but his casual software average is no valid criticism of it and he does happen to be a working solar expert who does not overlap with the corrupt hockey stick team that was plotted graphically in the Wegman report:
http://climateaudit.files.wordpress.com/2011/05/social_network.gif
Leif posts a lot here too, which is against hockey stick team rules of Alinskyite engagement, tutored by real PR firms, so I judge his comments as valuable as I try to understand these claims. He doesn’t come off as one of the bad guys.
Would the TSI drop matter anyway for an “infinitely tuned” model that could wiggle match either way or is this also important for the future cooling prediction? All this nitpicking isn’t answering such fundamental questions that only David can answer until code is released. For now I’ll rely on my favorite string theorist who suggests this isn’t a model at all, just a mathematical stunt.
Mr Green Genes says:
June 28, 2014 at 3:59 pm
If Archibald and Evans (and by extension Monckton) are shown to be wrong in 10 years or so, will they admit it and apologise and, similarly, if they are shown to be correct, will Svalgaard do likewise?
Of course, that is what honest scientists do. I’m not so sure about the other guys, though. ‘Apologise’ is normally not the way it is done. One way is to say in a paper that one’s earlier ‘finding’ was incorrect but even that is rare – wrong papers are simply quietly forgotten.
cynical_scientist says:
June 28, 2014 at 3:53 pm
Leif – I understand your frustration that he seems to have ignored your work in correcting the sunspot/TSI record. At the very least, if he didn’t want to use your updated figures, he should have commented on them and explained why.
That is not the issue. The issue is that he used an obsolete reconstruction of TSI [see my comment at 3:59pm]. This has nothing to do with the revision of the sunspot number. My frustration is with people [such as Monckton] with an agenda.
NikFromNYC says:
June 28, 2014 at 4:02 pm
Monckton’s rabid response to a mere plot average that meaninglessly jumped a gap is yet another red flag that this whole exercise may be an organized PR stunt gone bad.
You may a point here. It certainly looks that way.
Everybody is talking this and that and letting their egos speak. Cut it out will ya? Nobody knows what the weather will do tomorrow, nobody. You can speak out in weather terms and nowcast all you want, the weather never does what you think it will do… Hell as i know, this could well be a counter operation website full of cons (i dont know, just meant it as a matter of speak)..
You see.. There is the main problem. People who think they can outsmart someone else by new data. As soon as you see the data, it is already the past. You can only enjoy the weather now, is by looking at it and be present, just be there and observe.
All the focus is on CO2., And it should not be. It should be focussed at UFP’s or Ultra Fine Particles. They are real danger and are spread by cars and plains. Nobody is looking at that, the problem we all create for ourselfs. And not only we are affected, other species too.
lsvalgaard says:
June 28, 2014 at 4:10 pm
Sure. But his main observation is so totally robust and insensitive to manipulations in the data that it almost doesn’t matter where he gets his figures from. It is astonishing how robust his result is. Working in the frequency realm has many advantages not least of which adjustments of the kind which plague climate science (and solar science) have almost zero impact there.
Yeah Monckton can be a bit of a loose cannon. It isn’t fun to be in front of him when he lets loose a blast in the wrong direction.
Brad says:
“Boy am I naive…. I thought skeptics were above name calling and slinging mud at each other. I thought that was an alarmist characteristic.”
I think the “solar denialist” thing was a tongue in cheek mockery of “climate denialist” name calling, it was not supposed to be a invitation to fight fire with fire and start throwing names back.
Apparently such subtle humour is beyond some. Not funny, not P.C.
cynical_scientist says:
June 28, 2014 at 4:24 pm
Sure. But his main observation is so totally robust and insensitive to manipulations in the data that it almost doesn’t matter where he gets his figures from.
I think not [as many people have agreed]. Certainly the drastic drop would not come from random data.
Yeah Monckton can be a bit of a loose cannon. It isn’t fun to be in front of him when he lets loose a blast in the wrong direction.
I would rather be in front than just behind him…
Belvedere106 says:
“All the focus is on CO2., And it should not be. It should be focussed at UFP’s or Ultra Fine Particles. They are real danger and are spread by cars and plains. Nobody is looking at that, the problem we all create for ourselfs. And not only we are affected, other species too.”
Oh don’t worry, that’ll be the next pretext to remove our freedom of mobility and have us all forced ride around in electric powered shoeboxes or solar assisted bicycles.