Guest essay by Don J. Easterbrook, Dept of Geology, Western Washington University

The absence of global warming for the past 17 years has been well documented. It has become known as “the pause.” and has been characterized as the “biggest mystery in climate science,” but, in fact, it really isn’t a mystery at all, it was predicted in 1999 on the basis of consistent, recurring patterns of the Pacific Decadal Oscillation (PDO) and Atlantic Multidecadal Oscillation (AMO) and global climate.
Perhaps the easiest way to understand the causal relationship between global warming/cooling and the PDO and AMO is to recount how these correlations were discovered. In 1999, while studying recent glacial fluctuations on Mt. Baker in the North Cascade Range, a pattern of recurring advances and retreats became apparent. In the wee hours one night, I came across a 1997 paper by Mantua, et al., “A Pacific interdecadal climate oscillation with impacts on salmon production,” an early recognition of the PDO. The PDO is an index, not a measured value, based on about a dozen or so parameters that are related to cyclical variations in sea surface temperatures in the NE Pacific. The term “Pacific Decadal Oscillation” (PDO) was coined by Steven Hare (1996). It has two modes, warm and cool, and flips back and forth between them every 25 to 30 years.
The Mantua et al. curve looked so similar to my glacial curve that I superimposed the two and was surprised to see that they corresponded almost exactly. I then compared them to global temperature and all three showed a remarkable correlation (Fig. 1).
The significance of this correlation is that it clearly showed that the PDO was the driver of climate and glacial fluctuations on Mt. Baker. Each time the PDO mode flipped from one mode to another, global climate and glacier extent also changed. This discovery was significant in itself but was to lead to a lot more. At this point, it was clear that PDO drove global climate (Figs. 2,3), but what drove the PDO was not apparent.

Figure 2. 1945-1977 PDO cold mode and 1977-1998 warm mode. (Easterbrook 2011 modified from D’Aleo)

Figure 3. PDO fluctuations from 1900 to August 2012. Each time the PDO was warm, global climate warmed; each time the PDO was cool, global climate cooled. (modified from http://jisao.washington.edu/pdo/)
In 2000, I presented a paper, “Cyclical oscillations of Mt. Baker glaciers in response to climatic changes and their correlation with periodic oceanographic changes in the Northeast Pacific Ocean” at the annual meeting of the Geological Society of America (GSA). The following year at the GSA meeting, I presented another paper “The next 25 years: global warming or global cooling? Geologic and oceanographic evidence for cyclical climatic oscillations.”
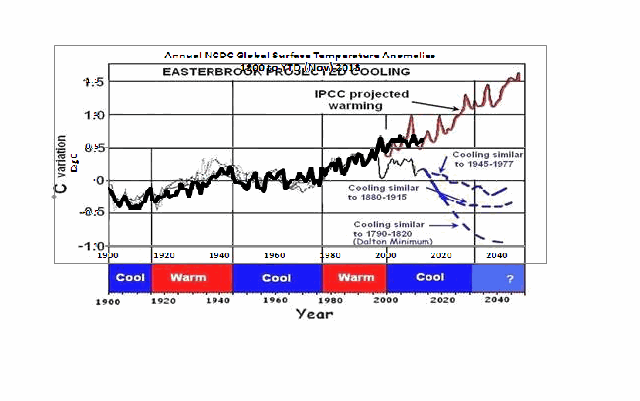
Since this recurring pattern of PDO fluctuation and global climate held true for the past century, what might the future hold? If the pattern continued, then might we project the same pattern into the future to see where we are headed, i.e., the past is the key to the future. If we want to know where we are heading, we need to know where we’ve been. Each of the two PDO warm periods (1915-1945 and 1978-1998) and the three cool periods (1880-1915, 1945-1977, 1999-2014) lasted 25-30 years. If the flip of the PDO into its cool mode in 1999 persists, the global climate should cool for the next several decades. Using the past durations of PDO phases, I spliced a cool PDO (similar to the 1945-1977 cool period) onto the end of the curve and presented the data in a paper at the 2001 Geological
Society of America meeting in Boston. In this paper, I proposed that, based on the past recurring pattern of PDO and global climate changes, we could expect 25-30 years of global cooling ahead (Fig. 4). With memories of the 1998 second warmest year of the century, the audience was stunned at such a prediction, especially since it directly contradicted the IPCC predictions of global warming catastrophe.


Figure 4. (Top) PDO fluctuations and projections to 2040 based on past PDO history.
(Bottom) Projected global cooling in coming decades based on extrapolation of past PDO recurring patterns.
My first projection of future global cooling was based on continuation of past recurring PDO fluctuations for the past century. But what about earlier climate changes? Because climate changes recorded in the oxygen isotope measurements from the GISP2 Greenland ice core had such an accurate chronology from annual layering in the ice, it seemed a perfect opportunity to see if similar changes had occurred in previous centuries, so I plotted the oxygen isotope accelerator measurements made by Stuiver and Grootes (1997) for the past 450 years. Oxygen isotope ratios are a function of temperature, so plotting them gives a paleo-temperature curve. This was a real eye-opener because the curve (Fig. 4) showed about 40, regularly-spaced, warm/cool periods with average cycles of 27 years, very similar to the PDO cycle. There was no way to determine what the PDO looked like that far back, but the GISP2 warm/cool cycles were so consistent that correlation with PDO 25-30 year cycles seemed like a good possibility. Historically known warm/cool periods showed up in the GISP2 curve, i.e., the 1945-1977 cool period, the 1915-1945 warm period, the 1880-1915 cool period, the Little Ice Age, Dalton Minimum cooling, the Maunder Minimum cooling, and many others, lending credence to the validity of the GISP2 measurements.

Figure 5. Warm and cool periods to 1480 AD from oxygen isotope measurements from the GISP2 Greenland ice core. The average length of a warm or cool cycle is 27 years.
When I presented this data and my climate projections at the 2006 GSA meeting in Philadelphia, Bill Broad of the NY Times was in the audience. He wrote a feature article in the NY Times about my data and predictions and the news media went bonkers. All of the major news networks called for interviews, then curiously all except CNN, MSNBC, and Fox abruptly canceled, apparently because my data posed a threat to IPCC predictions of catastrophic warming.
Nine additional papers expanding the geologic evidence for global cooling were presented from 2007 to 2009 and several longer papers were published from 2011-2014, including
“Multidecadal tendencies in Enso and global temperatures related to multidecadal oscillations,” Energy & Environment, vol. 21, p. 436-460. (D’Aleo, J. and Easterbrook, D.J., 2010).
“Geologic Evidence of Recurring Climate Cycles and Their Implications for the Cause of Global Climate Changes: The Past is the Key to the Future,” in the Elsevier volume “Evidence-Based Climate Science; p. 3-51. (2011)
“Relationship of Multidecadal Global Temperatures to Multidecadal Oceanic Oscillations,” in the Elsevier volume “Evidence-Based Climate Science; p. 161-180. (D’Aleo, J. and Easterbrook, D.J., 2011)
“Observations: The Cryosphere,” in Climate Change Reconsidered II, Physical Science (Easterbrook, D.J., Ollier, C.D., and Carter, R.M., 2013), p. 645-728.
Reprints of any of these publications may be obtained from http://myweb.wwu.edu/dbunny/ or by emailing dbunny14 “at”yahoo.com.
During these years, important contributions were made by Joe D’Aleo, who showed that during warm periods, warm El Nino phases occurred more frequently and with greater intensity than cooler La Nina phases and vice versa. He also documented the role of the Atlantic Multidecadal Oscillation (AMO), which is similar to the PDO. The AMO has multi-decadal warm and cool modes with periods of about 30 years, much like the PDO.
So the question now becomes how could my predictions be validated? Certainly not by any computer climate models, which had proven to be essentially worthless. The obvious answer is to check my predictions against what the climate does over several decades. We’ve been within my predicted cooling cycle for more than a decade, so what has happened? We’ve now experienced 17 years with no global warming (in fact, slight cooling) despite the IPCC prediction that we should now be ~1° F warmer (Figs. 6, 7, 8). So far my 1999 prediction seems to be on track and should last for another 20-25 years.
Conclusions
The ‘mysterious pause’ in global warming is really not mysterious at all. It is simply the continuation of climatic cycles that have been going on for hundreds of years. It was predicted in 1999, based on repeated patterns of cyclical warm and cool PDO phases so it is neither mysterious nor surprising. The lack of global warming for the past 17 years is just as predicted. Continued cooling for the next few decades will totally vindicate this prediction. Time and nature will be the final judge of these predictions.
What drives these oceanic/climatic cycles remains equivocal. Correlations with various solar parameters appear to be quite good, but the causal mechanism remains unclear. More on that later.

Figure 6. Temperature trend (°C/century) since 1996. Red = warming, blue = cooling.

Figure 7. Global cooling since 2000 (Earth Observatory)

Figure 8. Winter temperatures in the U.S. 1998-2013. 46 of the 48 states were significantly colder.
==========================================================
UPDATE 1/24/14, Dr. Easterbrook writes in with this update:
Here is an updated version of my 2000 prediction. My qualitative prediction was that extrapolation of past temperature and PDO patterns indicate global cooling for several decades. Quantifying that prediction has a lot of uncertainty. One approach is to look at the most recent periods of cooling and project those as possibilities (1) the 1945-1975cooling, (2) the 1880-1915 cooling, (3) the Dalton cooling (1790-1820), (4) the Maunder cooling (1650-1700). I appended the temperature record for the 1945-1975 cooling to the temperature curve beginning in 2000 to see what this might look like (see below). If the cooling turns out to be deeper, reconstructions of past temperatures suggest 0.3°C cooler for the 1880-1915 cooling, about 0.7°C for the Dalton cooling (square), and about 1.2°C for the Maunder cooling (circle). We won’t know until we get there which is most likely.

This updated plot really doesn’t change anything significantly from the first one that I did in 2000.
===============================================================
REFERENCES
D’Aleo, J. and Easterbrook, D.J., 2010, Multidecadal tendencies in Enso and global temperatures related to multidecadal oscillations: Energy & Environment, vol. 21, p. 436-460.
Easterbrook, D.J. and Kovanen, D.J., 2000, Cyclical oscillations of Mt. Baker glaciers in response to climatic changes and their correlation with periodic oceanographic changes in the Northeast Pacific Ocean: Abstracts with Programs, Geological Society of America, vol. 32, p.17.
Easterbrook, D.J., 2001, The next 25 years: global warming or global cooling? Geologic and oceanographic evidence for cyclical climatic oscillations: Geological Society of America, Abstracts with Program, vol. 33, p. 253.
Easterbrook, D.J., 2005, Causes and effects of abrupt, global, climate changes and global warming: Geological Society of America, Abstracts with Program, vol. 37, p. 41.
Easterbrook, D.J., 2006a, Causes of abrupt global climate changes and global warming predictions for the coming century: Geological Society of America, Abstracts with Program, vol. 38, p. 77.
Easterbrook, D.J., 2006b, The cause of global warming and predictions for the coming century: Geological Society of America, Abstracts with Program, vol. 38, p.235-236.
Easterbrook, D.J., 2007a, Geologic evidence of recurring climate cycles and their implications for the cause of global warming and climate changes in the coming century: Geological Society of America Abstracts with Programs, vol. 39, p. 507.
Easterbrook, D.J., 2007b, Late Pleistocene and Holocene glacial fluctuations: Implications for the cause of abrupt global climate changes: Abstracts with Programs, Geological Society of America, vol. 39, p. 594.
Easterbrook, D.J., 2007c, Historic Mt. Baker glacier fluctuations—geologic evidence of the cause of global warming: Abstracts with Program, Geological Society of America, vol. 39, p.13.
Easterbrook, D.J., 2008a, Solar influence on recurring global, decadal, climate cycles recorded by glacial fluctuations, ice cores, sea surface temperatures, and historic measurements over the past millennium: Abstracts of American Geophysical Union annual meeting, San Francisco.
Easterbrook, D.J., 2008b, Implications of glacial fluctuations, PDO, NAO, and sun spot cycles for global climate in the coming decades: Geological Society of America, Abstracts with Programs, vol. 40, p.428.
Easterbrook, D.J., 2008c, Global warming’ is over: Geologic, oceanographic, and solar evidence for global cooling in the coming decades: 3rd International Conference on Climate Change, Heartland Institute, New York.
Easterbrook, D.J., 2008d, Correlation of climatic and solar variations over the past 500 years and predicting global climate changes from recurring climate cycles: Abstracts of 33rd International Geological Congress, Oslo, Norway.
Easterbrook, D.J., 2009a, The role of the oceans and the sun in late Pleistocene and historic glacial and climatic fluctuations: Abstracts with Programs, Geological Society of America, vol. 41, p. 33.
Easterbrook, D.J., 2009b, The looming threat of global cooling – Geological evidence for prolonged cooling ahead and its impacts: 4th International Conference on Climate Change, Heartland Institute, Chicago, IL.
Easterbrook, D.J., ed., 2011a, Evidence-based climate science: Data opposing CO2 emissions as the primary source of global warming: Elsevier Inc., 416 p.
Easterbrook, D.J., 2011b, Geologic evidence of recurring climate cycles and their implications for the cause of global climate changes: The Past is the Key to the Future: in Evidence-Based Climate Science, Elsevier Inc., p.3-51.
Easterbrook, D.J., 2011c, Climatic implications of the impending grand solar minimum and cool Pacific Decadal Oscillation: the past is the key to the future–what we can learn from recurring past climate cycles recorded by glacial fluctuations, ice cores, sea surface temperatures, and historic measurements: Geological Society of America, Abstracts with Programs
Easterbrook, D.J., 2010, A walk through geologic time from Mt. Baker to Bellingham Bay: Chuckanut Editions, 330 p.
Easterbrook, D.J., 2012, Are forecasts of a 20-year cooling period credible? 7th International Conference on Climate Change, Heartland Institute, Chicago, IL.
Easterbrook, D.J., Ollier, C.D., and Carter, R.M., 2013, Observations: The Cryosphere: in Idso,C.D., Carter R. M., Singer, F.S. eds, Climate Change Reconsidered II, Physical Science, The Heartland Institute, p. 645-728.
Grootes, P.M., and Stuiver, M., 1997, Oxygen 18/16 variability in Greenland snow and ice with 10-3– to 105-year time resolution. Journal of Geophysical Research, vol. 102, p. 26455-26470.
Hare, S.R. and R.C. Francis. 1995. Climate Change and Salmon Production in the Northeast Pacific Ocean: in: R.J. Beamish, ed., Ocean climate and northern fish populations. Can. special Publicaton Fish. Aquatic Science, vol. 121, p. 357-372.
Harper, J. T., 1993, Glacier fluctuations on Mount Baker, Washington, U.S.A., 1940-1990, and climatic variations: Arctic and Alpine Research, vol. 4, p. 332‑339.
Mantua, N.J. and S.R. Hare, Y. Zhang, J.M. Wallace, and R.C. Francis 1997: A Pacific interdecadal climate oscillation with impacts on salmon production: Bulletin of the American Meteorological Society, vol. 78, p. 1069-1079.
Mac the Knife says: “All you’re doing here is strafing your own allies! Your disagreements with Dr. Easterbrook and Dr. Page are a distraction from what should always be a determined focus on the main target: Refuting the false CO2 scare mongering of Anthropogenic Global Warming pseudoscience and the irrational megalomania it is driving in our national governments and energy policies!”
We can’t do it with lies, Mac. Figure 4 includes a cartoon-like version of global surface temperature anomalies that is far from reality. And Figure 6 is blatantly wrong.
Bob Tisdale says:
January 18, 2014 at 12:50 pm
I am sorry that you think I am attacking you. I admire and appreciate the work you do. I do NOT mean to imply that the PDO drives anything. It could well be following something for all I know.
Mine was purely a simple piece of observation. That there is a 60 year (or thereabouts) in the data sets. (The data is WAY too short to give precise values to anything really and, anyway, this is an ‘organised chaos’ environment at best. Unlikely to give precise sine waves).
As Janice also noted above, Easterbrook’s poor wording about ‘cooling’ whilst meaning ‘trend of cooling’ is like sine and cosine as I tried to put to you also.
I will try and improve my words better so that I do not cause offense in the future.
phlogiston says: “Its a projection. It was presented in a conference in 2001 (see text).”
Wrong. The following is an early version of the Easterbrook projection.
http://wattsupwiththat.files.wordpress.com/2008/12/agu2.png
See the post here:
http://wattsupwiththat.com/2008/12/29/don-easterbrooks-agu-paper-on-potential-global-cooling/
Figure 4 in this post was updated sometime between 2008 and now. For Figure 4, Easterbrook spliced on bogus-looking data after 1998.
RichardLH says: “I am sorry that you think I am attacking you.”
Never crossed my mind, Richard. We were simply having a discussion.
Regards.
Janice Moore: There was no reason for me to be concerned about your bluntness, Janice, so no apology is necessary. Similarly, you’ve interpreted my comments to Don Easterbrook as being loud, when I, like you, was simply being blunt.
Regards
Right – so it’s a projection as we can see from Don Easterbrook’s comment: “I spliced a cool PDO (similar to the 1945-1977 cool period) onto the end of the curve and presented the data in a paper at the 2001 Geological”
I’m still a bit confused. Don has included a dashed line to indicate cooling similar to 1945-77 which seems to start – well – about now in 2013/14. The solid line implies a continuation of the dataset. Incidentally, which dataset is it? It is unrecognisable to me – and several others apparently.
I, therefore, have a number of questions.
1. When does the 1945-77 splicing start – in 2001 or later? If it’s in 2001 why does the earlier bit appear part of the data while the latter part is displayed as a dashed line.
2 Why does the 1945-77 splice look nothing like the 1945-77 data in the “Easterbrook” dataset. The 1945-77 data looks broadly flat whereas the splice shows a decline of about 0.5 deg from 2000 and about half that from 2012/13/14/whatever.
3 On what evidence does Don justify a temperature decline of 1 deg between 1790 and 1820.
4 And to repeat earlier requests: Which dataset is don Easterbrook using?
The BBC has a story on why the floods on the Thames!
http://www.bbc.co.uk/news/uk-england-oxfordshire-25793358
Oops. Sorry. Wrong tab. Was intended for http://wattsupwiththat.com/2014/01/18/flooding-in-the-somerset-levels-a-case-study
What a l of people are overlooking is that, if the warmists turn out to be wrong and this is all a natural multi-decadal cycle, the nex decades are going to not only be part of a “cooling” trend, but during them we’re going to see many of the wild predictions of the warmests coming true.
i.e.
– more atlantic hurricanes
– stronger hurricanes
– shorter food growing seasons > less food / higher food prices
– leading to famines in already fragile/tenuous political economies
– more flooding
– etc
I fully expect them to, at some point, switch on a dime and start trumpeting how they told us this was going to happen all along …
Don J. Easterbrook: I apologize for not first congratulating you on your prediction back in the early 2000s that global surface temperatures would cease to warm for a few decades.
Your first prediction graph that I can find on WUWT is Figure 2 in the December 2008 post here. The caption reads:
But it’s very obvious the data actually ended in the late 1990s and your “predictions” began at 2000. If we now overlay real data (NCDC global surface temperature anomalies), we can see that your “prediction” is too low, but it’s not bad.

The real problem lies in your newer “prediction” graph. The problematic “prediction” graph that you used in this post first appeared (as far as I can tell) in the November 1011 WUWT post here. There your caption for the illustration reads:
But anyone with a keen eye can tell that’s not real data after the mid-1990s. In fact, the 1997/98 El Niño is missing. Refer to the following animation that again overlays NCDC global surface temperature data onto your graph.
The problems with the mystery data are obvious. Your prediction falls far below the actual global surface temperature anomaly curve, and the data actually falls in line with whatever IPCC model you presented.
Will you supply the source for the data in that graph, as many have asked of you on the thread above? In lieu of that, will you issue an errata for the blog posts and journal papers in which that graph appears. As you’re aware, that prediction graph you presented as Figure 4 in this blog post also appears as Figure 59 in your 2011 paper Geologic Evidence of Recurring Climate Cycles and Their Implications for the Cause of Global Climate Changes – The Past is the Key to the Future. Does it also appear in other peer-reviewed publications? Or will you continue to ignore the problem and “let nature and time judge [your] work”?
A lot of people have faith in you as you can tell by the well wishes on this thread. The ball’s in your court.
PS: I went to your climate publications webpage to check the paper Easterbrook, D.J. and Kovanen, D.J., 2001. The next 25 years: global warming or global cooling? Geologic and oceanographic evidence for cyclical climatic oscillations: Abstracts with Program, Geological Society of America, vol. 33, 253. But the link no longer works.
phlogiston & John Finn: Thanks for finding this quote. Easterbrook wrote in the post, “… I spliced a cool PDO (similar to the 1945-1977 cool period) onto the end of the curve and presented the data in a paper at the 2001 Geological Society of America meeting in Boston.”

I believe that means Easterbrook spiced smoothed PDO data (starting about 1945) onto the end of the smoothed global surface temperature data (ending about 1995). In other words, he shifted the PDO data back in time 50 years, smoothed it with about a 10-year or longer filter, then scaled it and shifted it upwards to “fit” onto the end the global temperature data.
If that’s the case, then it’s remarkable, because Easterbrook’s been presenting it as global surface temperature data. Whatever it is, it’s really misleading
Janice Moore says:
January 18, 2014 at 10:36 pm
Thank you for your comments here. I know you were quoting someone else here:
After the peak in 10-year trends around 2001, the ten-year periods are simply warming at a lesser rate, until they drop below zero, then they’re cooling.
However I think that the warming at a lesser rate was actually misleading on Figure 6. It is actually cooling from 2002 to 2012 and 2002 to date for that matter as shown below.
http://www.woodfortrees.org/plot/hadcrut4gl/from:2002/to/plot/hadcrut4gl/from:2002/to:2012/trend/plot/hadcrut4gl/from:2002/trend
Bob Tisdale says:
January 19, 2014 at 1:50 am
Figure 4 includes a cartoon-like version of global surface temperature anomalies that is far from reality.
I am wondering if he put in the wrong graphic by mistake here.
Werner Brozek, Easterbrook used that graph in other posts here at WUWT. And he used it in at least one paper. I don’t think it was a mistake.
Regards
Mac the Knife says: @ur momisugly January 18, 2014 at 11:27 pm
…. And every now and then, one of the more intelligent team mates has to be ‘taken to the wood shed’ because of their unwillingness to just accept the minor differences in viewpoints amongst the team members. I was ‘taken to the wood shed’ several times in my early career, for just such similar indiscretions, by a mentor that taught me well:
Keep Your Eyes On The Prize!
>>>>>>>>>>>>>>>>>>>>>>>>>>
I will agree with you there.
None of us has a monopoly on the truth and often only see a tiny bit of the whole truth. Also it is very easy to get tripped up on the use of words to describe what you mean. It can be very frustrating when talking to someone who does have a more extensive vocabulary when trying to describe a point or a much less extensive vocabulary.
That is probably the best part of WUWT. We have many different people from many different fields bring in different knowledge. It is important NOT to let ego get in the way of the exchange of ideas and the formulation of a better picture of how our climate operates. That is the prize we all want.
Well done. You’ve illustrated the main problems with the Easterbrook graphics perfectly.
Fig 4 is an embarrassment to all responsible climate sceptics.
Bob Tisdale says: @ur momisugly January 19, 2014 at 8:03 am
Bob could he be using Steve Goddards data? (Tongue in cheek)
http://stevengoddard.files.wordpress.com/2010/10/1998changesannotated.gif?w=500&h=355
Steve just found a huge error in the USA data: http://stevengoddard.wordpress.com/2014/01/19/just-hit-the-noaa-motherlode/#comment-310458
Steve is showing adjustment over the last century of over 1.5C!!!!
Janice Moore says:
January 19, 2014 at 12:59 am
==================================
If I were keen on ideological warfare, here is what I would do. I would identify pro GW blogs which do not practice censorship, go there, and shout about Exit and Jorge Montt glaciers, which as far as I know, have not been mentioned together in one sentence by anyone but me.
–Private Foster
Gail:
Your petard, ma’am:
” It can be very frustrating when talking to someone who does have a more extensive vocabulary when trying to describe a point or a much less extensive vocabulary.”
Say what?
Bob Tisdale says:
January 19, 2014 at 6:34 am
Don J. Easterbrook: I apologize for not first congratulating you on your prediction back in the early 2000s that global surface temperatures would cease to warm for a few decades.
Your first prediction graph that I can find on WUWT is Figure 2…….
Bob Tisdale,
Your communique of Jan 19 @ur momisugly 6:34am is precisely how your issues with Easterbrooks article should have been handled from the very start: Polite and Direct. All of the other harsh words only created unnecessary antagonism combined with an extended ‘time suck’ of wasted energy.
Blogs like this can be a bit of an electronic echo chamber, a synthetic reality. But ‘out there’ in the world of hard matter, in our world of hard physical matters, the AGW megalomaniacs are shutting down our cheap and efficient coal fired power plants based on the false hypothesis that the CO2 they emit is pollution! Out there, in an increasingly cold and unreliably powered world, the AGW fanatics are turning off our heat and turning out our lights…..
You can continue to expend your considerable talents on ‘time sucks’ like the extended comments to this post have been… but ‘outside’ the lights are dimming around us as the AGW cadres use false science to destroy our power plants.
Focus on the main target and expend your precious, prodigious talents there, my friend!
Best regards,
Mac
Bob Tisdale says:
January 19, 2014 at 9:16 am
I don’t think it was a mistake.
OUCH! I was hoping it was a mistake. Guess who is pouncing all over Don for the obviously low predictions from 1999.
Brian H says: @ur momisugly January 19, 2014 at 12:48 pm
… Say what?
>>>>>>>>>>>>>>>>>>>>>>>>>>>>
Bob T. has specialized in ENSO and he has a much better vocabulary to describe what he means. Don Easterbrook does not from what I can tell.
Tisdale
Easterbrook’s hypothesis that PDO is the cause of global cooling and warming observed in the last century is supported by the research of Dr. Roy Spencer to quote:
“A simple climate model forced by satellite-observed changes in the Earth’s radiative budget associated with the Pacific Decadal Oscillation is shown to mimic the major features of global average temperature change during the 20th Century – including three-quarters of the warming trend.”
“While the PDO is primarily a geographic rearrangement in atmospheric and oceanic circulation patterns in the North Pacific, it is well known that such regional changes can also influence weather patterns over much larger areas, for instance North America or the entire Northern Hemisphere (which is, by the way, the region over which the vast majority of global warming has occurred).”
“Spencer and Braswell (2008) showed theoretically that daily random variations in cloudiness can actually cause substantial decadal time-scale variability on ocean temperatures. This is not a new finding, as it was also demonstrated over 30 years ago (Hasselman, 1976) and is related to the fact that the ocean, due to its large heat capacity, retains a ‘memory’ of past changes in the Earth’s radiative budget for a very long time.”
“When the feedback is removed, we see a good match in Fig. 5 between the low-frequency behavior of the PDO and the radiative forcing (which is presumably due to cloud fluctuations associated with the PDO). Second-order polynomials were fit to the time series in Fig. 5 and compared to each other to arrive at the PDO-scaling factor of 1.9 Watts per square meter per PDO index value.”
“The evidence presented here suggests that most of that warming might well have been caused by cloud changes associated with a natural mode of climate variability: the Pacific Decadal Oscillation.”
http://www.drroyspencer.com/research-articles/global-warming-as-a-natural-response/
Dear Mr. Tisdale,
So, there is “no reason” for my being blunt to be of concern to you. Wow. Always good to know where one really stands with someone. I mistakenly thought that we were pals of a sort, thus, my speaking so bluntly could potentially hurt your feelings. I didn’t realize that your heart is impervious to any bluntness from me. Thanks for being so candid.
You miss at 2:48am (not intentionally, I’m going to assume) my main point,
(here: http://wattsupwiththat.com/2014/01/17/cause-of-the-pause-in-global-warming/#comment-1540873)
however, which is NOT that your tone was “loud,” but that the content of your comments above (which I took pains to quote at length in my comment) supports AGW.
I am now, not only “dismayed,” but sad. I have completely mis-read you in these past months. And that’s my problem. Live and learn.
Thanks again for sharing all your research with us, and
for taking the time to respond,
Janice Moore
Janice Moore, you’ve misunderstood what I wrote. I’m never concerned about someone being straightforward, candid, direct to the point. There’s no reason to mince words. That was my point.
Dr. Strangelove, Dr. Spencer has now changed the metric to ENSO that he uses for the Pacific variability. Check out his newer paper.