Guest essay by Joe Born
Is the Bern Model non-physical? Maybe, but not because it requires the atmosphere to partition its carbon content non-physically.
![bern_irf[1]](http://wattsupwiththat.files.wordpress.com/2013/12/bern_irf1.gif)
A Bern Model for the response of atmospheric carbon dioxide concentration 


![\rho_{CO_2}(t)=C_{CO2}\int\limits_{-\infty}^{t}E_{CO_2}(t')\left[ f_{CO_2,0}+\sum\limits_{S=1}^{n} f_{CO_2,S}e^{-\frac{t-t'}{\tau_{CO_2,S}}} \right]dt' .](https://s0.wp.com/latex.php?latex=%5Crho_%7BCO_2%7D%28t%29%3DC_%7BCO2%7D%5Cint%5Climits_%7B-%5Cinfty%7D%5E%7Bt%7DE_%7BCO_2%7D%28t%27%29%5Cleft%5B+f_%7BCO_2%2C0%7D%2B%5Csum%5Climits_%7BS%3D1%7D%5E%7Bn%7D+f_%7BCO_2%2CS%7De%5E%7B-%5Cfrac%7Bt-t%27%7D%7B%5Ctau_%7BCO_2%2CS%7D%7D%7D+%5Cright%5Ddt%27+.&bg=ffffff&fg=000&s=0&c=20201002)
The “Bern TAR” parameters thus adopted state that the carbon-dioxide-concentration increment 

where the 


There are a lot of valid reasons not to like what that equation says, the principal one, in my view, being that the emissions and concentration record we have is too short to enable us to infer such a long time constant. What may be less valid is what I’ll call the “partitioning” version of the argument that the Bern model is non-physical.
That version of the argument was the subject of “The Bern Model Puzzle.” According to that post, the Bern Model “says that the CO2 in the air is somehow partitioned, and that the different partitions are sequestered at different rates. . . . Why don’t the fast-acting sinks just soak up the excess CO2, leaving nothing for the long-term, slow-acting sinks? I mean, if some 13% of the CO2 excess is supposed to hang around in the atmosphere for 371.3 years . . . how do the fast-acting sinks know to not just absorb it before the slow sinks get to it?” (The 371.3 years came from another parameter set suggested for the Bern Model.)
The comments that followed that post included several by Robert Brown in which he advanced other grounds for considering the Bern Model non-physical. As to the partitioning argument, though, one of his comments actually came tantalizingly close to refuting it. Now, it’s not clear that doing so was his intention. And, in any event, he did not really lay out how the circuit he drew (almost) answered the partitioning argument.
So this post will flesh the answer out by observing that the response defined by the “Bern TAR” parameters is simply the solution to the following equation:

where

But that equation describes the system that the accompanying diagram depicts. And that system does not impose partitioning of the type that the above-cited post describes.

In the depicted system, four vessels of respective fixed volumes 


Additionally, a gas source can add gas to the first vessel at a rate 

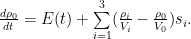
If appropriate selections are made for the 
The gas represents carbon (typically as a constituent of carbon dioxide, cellulose, etc.), the first vessel represents the atmosphere, the other vessels represent other parts of the carbon cycle, the membranes represent processes such as photosynthesis, absorption, and respiration, and the stimulus 
I digress here to draw attention to the fact that I’ve just moved the pea. The flow from the source does not represent all emissions, or even all anthropogenic emissions. It represents the flow only of carbon that had previously been sequestered for geological periods as, e.g., coal, and that is now being returned to the cycle of life. Thus re-defining the model’s emissions quantity finesses the objection some have made that the Bern Model requires either that processes (implausibly) distinguish between anthropogenic and natural carbon-dioxide molecules or that atmospheric carbon dioxide increase without limit.
Now, there’s a lot to criticize about the Bern Model; many of the criticisms can be found in the reader comments that followed the partitioning-argument post. Notable among those were richardscourtney’s . Also persuasive to me was Dr. Brown’s observation that the atmosphere holds too small a portion of the total carbon-cycle content for the 0.152 value assigned to the infinite-time-constant component to be correct. And much in Ferdinand Engelbeen’s oeuvre is no doubt relevant to the issue.
As the diagram shows, though, the left, atmosphere-representing vessel receives all the emissions, and it permits all of the other vessels to compete freely for its contents according to their respective membranes’ permeabilities. So what is not wrong with the model is that it requires the atmosphere to partition its contents, i.e., to withhold some of its contents from the faster processes so that the slower ones get the share that the model dictates.
Related articles
- On CO2 residence times: The chicken or the egg? (wattsupwiththat.com)
Bart: “So, the place to begin is the PDE model, the equations and their boundary conditions, assumed by the Bern model.”
No. The Bern equations are exact solutions to ordinary differential equations. The equation that results from plugging the Bern TAR numbers into the first equation above is an exact (except for computation rounding) solution to the third equation above, which is not a partial differential equation.
No doubt some diffusion does occur in the real-world carbon cycle, but the Bern model does not reflect that.
Joe, I think Bart’s comment was intended to mean that a diffusion model produces somthing very similar to the ‘long tailed’ triple exp. model. Not that is was mathematically identical.
IIRC either Nick Stokes, or WHT has worked out a three slab ocean diffusion model that essentially comes out the same.
Greg Goodman: “[A] diffusion model produces something very similar to the ‘long tailed’ triple exp. model.”
Indeed. If I remember correctly, I once computed seven or eight vessels in series (ODE) to approximate the “tautochrone” results I had obtained here http://wattsupwiththat.com/2012/07/13/of-simple-models-seasonal-lags-and-tautochrones/ through a diffusion equation (PDE).
Allan MacRae says: “The CO2 seasonal sawtooth is dominated by the larger Northern Hemispheric (“NH“) landmass.”
jorgekafkazar says on December 2, 2013 at 9:22 am
Or is it dominated by the larger Southern Hemisphere (“SH”) oceanic surface area?
Allan again:
Hi Jorge,
I suggest that it is as I said. Please examine the timing and direction of the atmospheric CO2 sawtooth (measured at Mauna Loa) superimposed in the AIRS animation, which I suggest is dominated by larger NH landmass photosynthesis.
But I am open to discussing your point. What natural mechanisms would support your hypo?
Best, Allan
[Actually Jorge I think your point is just wrong, but I’m trying to be polite.]
Joe Born says:
December 2, 2013 at 10:45 am
The equilibrium between two reservoirs is governed by the equilibrium constant for that process. Consider the equilibrium between in the atmosphere and
  in water (i.e. Henry’s law). That equilibrium is given by:
![K_{eq}=\frac{\left [ CO_{2} \right ]\left ( aq \right )}{\left [ CO_{2} \right ]\left ( g \right )}](https://s0.wp.com/latex.php?latex=K_%7Beq%7D%3D%5Cfrac%7B%5Cleft+%5B+CO_%7B2%7D+%5Cright+%5D%5Cleft+%28+aq+%5Cright+%29%7D%7B%5Cleft+%5B+CO_%7B2%7D+%5Cright+%5D%5Cleft+%28+g+%5Cright+%29%7D&bg=ffffff&fg=000&s=0&c=20201002)
such that the equilibrium constant for the process can be written as:
In this example, note that the equilibrium constant is not governed by the volume of the respective reservoirs. It is governed by the equilibrium molar concentration or (equivalently) partial pressure within each reservoir. The total mass contained within each reservoir at equilibrium will depend upon their respective volumes. However, chemical equilibrium is not defined in this manner (for more details refer to http://en.wikipedia.org/wiki/Chemical_equilibrium). Finally, the thermodynamics of the system dictate the form that the kinetic rate laws (differential equations) must take.
Allan MacRae says: “The CO2 seasonal sawtooth is dominated by the larger Northern Hemispheric (“NH“) landmass.”
jorgekafkazar says: Or is it dominated by the larger Southern Hemisphere (“SH”) oceanic surface area?
Greg Goodman says: December 2, 2013 at 10:30 am
Yes, indeed. Yet another urban climatology assumption I guess.
Annual ‘saw tooth’ works out rather nicely actually since it can be modelled by two ramps or 12mo and 6mo cosines (the latter being more physically real, but the first is handy for getting flow rates).
http://climategrog.wordpress.com/?attachment_id=721
Allan again:
Depends upon the year Greg, and whether Earth is warming, cooling or neither.
Annualized Mauna Loa dCO2/dt has “gone negative” a few times in the past (calculating dCO2/dt from monthly data, by taking CO2MonthX (year n+1) minus CO2MonthX (year n) to minimize the seasonal CO2 “sawtooth”.)
These 12-month periods are (Year-Month ending):
1959-8
1963-9
1964-5
1965-1
1965-5
1965-6
1971-4
1974-6
1974-8
1974-9
Has this not happened recently because of increased humanmade CO2 emissions, or because the world has, until recently, been getting warmer?
Mr. Born, thank you for taking the time to write this intriguing and highly useful post.
Now that you have acknowledged (at 11:15am) the accuracy of Greg Goodman’s clarification (at 11:01am) of Bart’s suggested path forward, how about now replying more meaningfully to Bart (at 10:41am)? This layperson is left (for now) with the impression (hopefully, mistaken) that you are intentionally avoiding discussing meaningfully Bart’s suggestion.
Your conscientious and polite responses above are wonderful. Well done.
I was just trying to point out where I think the expansion of the Bern model comes from, because I did not see anyone mention anything about diffusion processes above, and thought I might be able to clarify or elucidate how the model comes about. If what I suggested is already known by the participants, then never mind.
Obviously, the Bern model is chock full of assumptions which, based on observations, appear to be wrong in whole or in part. I’m not defending it by any stretch of the imagination.
ZP: “[T]he equilibrium constant is not governed by the volume of the respective reservoirs. It is governed by the equilibrium molar concentration or (equivalently) partial pressure within each reservoir.”
In this case equilibrium is equal molar concentrations. There are no chemical effects biasing the system. The partial pressure (in the case, the complete pressure) is proportional to the molar concentration and is, as I indicated above, rho / V.
Janice Moore: “This layperson is left (for now) with the impression (hopefully, mistaken) that you are intentionally avoiding discussing meaningfully Bart’s suggestion.”
Actually, I did address his comment.
Diffusion, which he’s talking about, can be thought of as a situation in which an infinite number of infinitesimally small vessels are connected in series. The solution can be thought of as an infinite sum of infinitesimal exponentials, but it is expressed in other terms, such as error functions.
That’s not what the Bern equation is. Since the Bern solution is a finite number of exponentials, it is the solution to a linear ordinary differential equation. If the parameters are right, the result can look a lot like the solution to a diffusion (a type of partial-differential) equation, so, as Mr. Goodman pointed out, one could in the right circumstances look upon it as an approximation to a diffusion-equation solution.
But the Bern equation is an exact solution to what I’ve heard adepts in this discipline refer to instead as a “lumped-parameter” equation, which describes the diagram I provided above.
Hi Allan, good to have you on board.
In relation to your paper on phase relationships I suggest you read my recent article on Climate Etc. re. running means. It does not negate what you found but could help improve it.
http://judithcurry.com/2013/11/22/data-corruption-by-running-mean-smoothers/
“Annualized Mauna Loa dCO2/dt has “gone negative” a few times in the past ”
I have little time for this kind of climatology home spun data distortion techniques. It seems that by “annualised” you mean some kind of “anomaly” calculation. If you wish to remove annual and sub-annual cycles use an appropriate filter (unless you absolutely need to look at the last year or two of data).
Yes, 1974 was a low point but did not go negative in this plot. Why would it matter if it did?
http://climategrog.wordpress.com/?attachment_id=720
Clearly there are a number of factors at work, not just one simple relaxation process driven by temperature. Indeed , since 1995 and start of the “plateau”, it seems that AO correlates better than SST. This is also a reflection of Henry’s Law
. http://climategrog.wordpress.com/?attachment_id=259
All that is ignoring the non negligible question of data sample errors and “bias corrections”.
None of this is simple but we’re guessing for some first order approximations. Don’t be surprised is some years deviate. Does not disprove a hypothesis.
Joe Born says: in water. As shown in this table http://en.wikipedia.org/wiki/Henry's_law#Other_forms_of_Henry.27s_law, the equilibrium constant for the solubility of
  in water at 25 °C is
  M/atm (which is considerably different than 1).
December 2, 2013 at 12:25 pm
In this case equilibrium is equal molar concentrations. There are no chemical effects biasing the system.
Equilibrium being achieved at equal molar concentrations is not generally the case. Consider the solubility of
I agree with the nomenclature. However, the forward rate constant cannot be assumed equal to the reverse rate constant. This approach is contrary to known chemical thermodynamics of these systems. Chemical equilibrium is achieved when the forward rate equals the reverse rate (i.e. ) such that
  . So, the ratio of the forward rate constant
  to reverse rate constant
  must also equal the ratio of the equilibrium molar concentrations, which are measured values and normally are not equal (as exemplified above for the solubility of carbon dioxide in water).
Joe Born says:
December 2, 2013 at 12:40 pm
Not to stir a tempest in a teapot, but a lumped parameter model is generally a method for expressing a PDE system as an expansion in ODEs. So, while the Bern model is an exact solution to the set of ODEs describing the approximated system, it is an approximate solution for a much more complicated model.
As far as I can tell, the Bern models, for there appear to be more than one, are a distillation into ODEs of a sort of hybrid PDE/ODE model. For example, Bern-SAR is described by
Well, Mr. Born, thanks for acknowledging my concern, but, it is clear to me, at least, that you have not yet meaningfully addressed what Bart said. It appears that you do not realize what Bart is trying to say to you. There is definitely a communication break-down, there — I’m assuming it is not intentional.
And if this issue is, indeed, not essential (a “tempest in a teapot”), by all means ignore my pleas to address it.
http://climategrog.wordpress.com/?attachment_id=722
The Nordkap data , at least seems to support the idea of a short decay constant. (Though not as short as my SST/CO2 work is suggesting. This may related to NH/SH delay of transfer from strato to tropo delays.)
There seems to be some clear oscillation in the initial decade whose magnitude is at least close to the initial decay relationship.
this would seem to be ” consistent with” the idea of dilution of C14 ratio by the continual turn over between atm and mixed layer. After initial dilution and equilibration with mixed layer the longer (diffusion?) to second ocean slab takes over.
There are so many sinks and sources in all this that there may be a different physical interpretation but the above seems likely to me.
tty says:
December 2, 2013 at 3:19 am
The empirical data show that Ao, the proportion of CO2 that remains in the atmosphere indefinitely must be very slightly less than zero. “Slugs” of CO2 are continuously being injected into the atmosphere by volcanoes, but the trend in CO2 in the atmosphere has been inexorably downward for the last 35 million years.
The question of volcanic CO2 emissions is one that really is not well understood by any one. For instance, looking for information on the isotopic signature of volcanic CO2 leads to the fact that at present, there really isn’t any reliable generalization (http://www3.geosc.psu.edu/courses/Geosc518/15_Random_Mixing_Model/Chapter_15/Mantle%20Carbon.pdf).
In one view most, if not all, volcanic CO2 is “new” carbon as far as the biosphere is concerned. That is, volcanic emissions are mostly not reworked or naturally “recycled” biological carbon. It consists of carbon that has been driven off the core through fractionation and has been working its way to the surface through tectonic processes. The isotopic composition should reflect the composition of the nebula that planet condensed from during the formation of the solar system. There are also some arguments that the commonly used figures for volcanic carbon emission are far too low.
As the pdf above notes, mantle xenoliths can consist of crustal fragments subducted and reworked. This will be true only within the vicinity of active or extinct subduction zones. Mantle plumes such the one that drives the Hawaiian Island volcanoes, or Yellowstone are not linked to any known subduction processes.
As regards atmospheric CO2, the concentration trend has been “inexorably down” for about 150,000,000 years (roughly since the mid-Mesozoic).
Janice Moore: “It appears that you do not realize what Bart is trying to say to you.”
Perhaps. What I initially thought he meant was that the Bern model implies diffusion and that my diagram, which depicts a lumped-parameter system, not a distributed-parameter one, therefore does not depict a system to whose system equations the Bern equation is a solution.
What I now understand him to mean is that the reason why the authors of the Bern equation came up with a sum of exponentials was to approximate the solution to a diffusion equation. That’s conceivable, although I don’t know why they’d settle for an approximation when they could have used the exact solution. In any event, I no longer understand Bart to say that my diagram’s system equation has as its solution something other than the function that results from plugging the Bern TAR parameters into the Bern equation.
Therefore, since the Bern equation applies to that diagram, and since that diagram’s first, atmosphere-representing vessel does not partition its contents, my point stands that the Bern equation does not require (arguably implausible) partitioning, so it would be best not to base an argument against its use on its imposing such a requirement.
My review of the bidding is that no one so far has faulted my reasoning except ZP. His argument is that my diagram”s system equation is not what I think it is. If he were right, of course, that system equation’s solution, which I think is the Bern equation with the Bern TAR parameters plugged in, might not be. That would undermine my reasoning. But I think ZP knows a formula from chemistry but doesn’t really know when to apply it. I’m no scientist, but I have dealt with technical types extensively, and in my experience that type of error is not uncommon.
–Of course, I could be wrong.
ZP: “Equilibrium being achieved at equal molar concentrations is not generally the case. Consider the solubility of CO_{2} in water.”
I’ll grant you that equal concentrations at equilibrium are bot the case in all systems. I’m no scientist, but I did take high-school chemistry.
But will you grant me me that, in a situation in which you have two vessels containing the same, identical ideal gas and joined by a permeable membrane, the equilibrium condition may–just may–be equal pressures in the vessels?
And, even if you don’t, could you grant that if such a system were to exist, my equations describe it? Because the question before the house is whether the Bern equation requires the atmosphere to partition its CO2 contents implausibly, and, to the extent that my equations describe a system that doesn’t perform such partitioning, it demonstrates that the answer to the question is no.
Joe Born says:
December 2, 2013 at 2:38 pm
I’m not faulting anything. Just trying to facilitate understanding of how they arrived at the model. As to why they’d settle for an approximation, it would be to get a closed form solution in terms of elementary functions.
I fear I am only detracting from the conversation, though, which was the opposite of my intention. Pray carry on and consider it no further.
ATheoK says:
“Subduction is not required. Folding deposits deep enough for metamorphosis is sufficient to release CO2.”
True, but it requires rather extrene ultra-high-temperature metamorphism. Normally limestones and dolomites just turn to marble.
“The CO2 sources for many of the ‘hot spot’ volcanoes, e.g., Hawaii, are unknown. Guesses about magma absorbing CO2 from sediments as magma passing through are just that, guesses.”
Not really, we might not be able to see it happen in real time, but decarbonation by contact metamorphism is very well known and documented. As a matter of fact it is much more common than UHT metamorphism.
Sorry Joe, I’m just trying to help you with your post. It is apparent that you have a fundamental misunderstanding of chemical systems, since you do not appear to appreciate that fact that the forward and reverse rate constants will not generally be equal. ) is equal to the reverse constant ($latex k_{ma}) as indicated on page 176:
Perhaps an alternative argument for why your approach is incorrect would help. Your approach predicts that the equilibrium position between reservoirs will be essentially independent of temperature, because you are equating the forward and reverse rate constants. This is in direct conflict with known thermodynamics of chemical systems, such as the solubility of carbon dioxide in water (see http://en.wikipedia.org/wiki/Henry's_law#Temperature_dependence_of_the_Henry_constant). However, by recognizing that the forward and reverse rate constants are independent of each other and are each adequately described by the Arrhenius equation (http://en.wikipedia.org/wiki/Arrhenius_equation#Equation), you’ll be able to provide an excellent molecular dynamics explanation for this observation (see http://en.wikipedia.org/wiki/Transition_state_theory).
However, if this argument and the previous references I have provided do not help, hopefully, this paper, which discusses the Bern model, will: http://onlinelibrary.wiley.com/doi/10.1111/j.2153-3490.1975.tb01671.x/pdf. I’ll direct your attention to equation 1 on page 170. In this equation, the authors have introduced two rate constants that they refer to as exchange coefficients. The authors do not assume the forward constant (
Sure.
Joe, I’m hope you realize that I’m not defending the Bern model. I just want to help you formalize your arguments and objections in a manner that will be accepted by physical chemists. When you begin discussing the partitioning of , you immediately invoke the thought of partitioning between air and water, which is a chemical equilibrium phenomenon. As such, this situation is quite different from the simplistic two vessels joined by a permeable membrane that you appear to want to invoke.
ZP: “When you begin discussing the partitioning of CO_{2}, you immediately invoke the thought of partitioning between air and water, which is a chemical equilibrium phenomenon.”
I’m afraid we aren’t going to be able to join issue.
I’m telling you what the Bern mathematics says, not what happens in the real world or what the authors were shooting for when they wrote it. I agreed at the outset that the Bern equation does not reflect the the fact that emissions and uptake processes are asymmetrical and that it fails to that extent to reflect the real world. But with the Bern TAR parameters, the Bern equation expresses the solution to the differential equations that the system I illustrated dictate–with equal pressures at equilibrium.
What you say about equilibrium between CO2 in air and CO2 in water is no doubt true, but it’s irrelevant. Now, if you can show me that the Bern equation does not give the the solution to the diagrammed system as I’ve described it, with the symmetry I’ve assumed in writing the equations, then you’re addressing the subject of the post. Otherwise, I don’t think either of us will benefit from further discussion.
The argon in the Earths interior comes from radioactive decay and it would be nice to measure its release from volcanic sources, which would give us an good estimate of volcanic activity during the last 800 ky.
Look, the ranges of response vary between the dumb hindquartered sks kidz arguing that the isotope ratios alone implicate human CO2, and the elegant process engineering of Ferdinand coming to the same conclusion. It is utterly reasonable to suspect that when you dump a bunch of something in the system, and the system concentration of the something increases, the increment will be yours.
However, our contribution is small, and the system is poorly understood. Furthermore, we are feeding the biological cycle exactly what it needs. I argue we simply cannot know right now. The same applies to the so called e folding which is the notion that an exceptional slug of something the system is not prepared for will take longer to absorb. All well and good, but this notion calls into question a dozen factors we know even less about. Study large igneous provinces, and you may well suspect, as I do , that the human volcano is nothing unprecedented.