From Dr. Benny Peiser and the GWPF
We Really Don’t Understand Our Climate

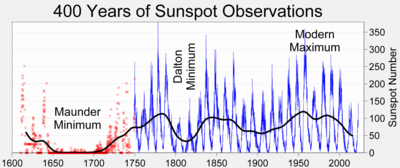
Something is happening to our sun. If history is anything to go by, the sun’s change of mood could affect us all by cooling the earth and throwing our climate change calculations into disarray. It might even be the case that the earth’s response to low solar activity will overturn many of our assumptions about man’s influence on climate change. Cold not warmth might be our future. We do not know. We must keep watching the sun. –David Whitehouse, Public Service Europe, 24 July 2013
Global warming has been on “pause” for 15 years but will speed up again and is still a real threat, Met Office scientists have warned. In a set of three new reports, the Met Office claims that global warming has been disguised in recent years by the oceans, which have absorbed greater amounts of heat and prevented us from noticing the difference at surface level. Other factors including a number of volcanic eruptions since 2000 and changes in the Sun’s activity, could also have masked the effect of greenhouse gases by providing a slight cooling effect, they said. –Nick Collins, The Daily Telegraph, 22 July 2013
In its conclusions the Met Office states that the pause has not falsified the climate models. If the pause is, as they define it and limit it, from 2001 onwards, then this is true. But if the pause is 16-years, as the temperature data actually show, then the models, already looking unimpressive, are in jeopardy. We are at the waiting stage. Better and more reliable OHC data are desperately needed. Even if global temperatures were to rise again the climate models have shown themselves inadequate. If the pause continues, however, then the crisis of climate science will become more serious. –David Whitehouse, The Global Warming Policy Foundation, 24 July 2013
The scientists say, pauses in warming were always to be expected. This is new – at least to me. I’ve never heard leading researchers mention the possibility before. I asked why this had not come up in earlier presentations. No one really had an answer, except to say that this “message” about pauses had not been communicated widely. But what about another possibility – that the calculations are wrong? What if the climate models – which are the very basis for all discussions of what to do about global warming – exaggerate the sensitivity of the climate to rising carbon dioxide? –David Shukman, BBC News, 22 July 2013
Scientists are still struggling to explain the slower-than-predicted global warming over the past decade. There are innumerable variables in the climate system that could be responsible for the warming slowdown. These scientists have identified some of the likeliest culprits, but one professor admitted that they “don’t fully understand the relative importance of these different factors.” The recent warming plateau is exposing our limited understanding of climate, and it’s effectively killing the rationale for green policies that limit growth and, at the most basic level, try to force people to do things they would rather not do. — Walter Russell Mead, Via Meadia, 23 July 2013
The Science Media Centre has released a statement on the failure of global temperatures to rise in line with the models. It’s spin of course, although perhaps not quite as blatant as we are used to from them. Lots of “our understanding is getting better” and not a lot of “nobody has a clue what’s going on”. There’s a complete misrepresentation of science’s level of understanding of the reasons why this is happening. As I said in Parliament, the inability of climate scientists to admit their ignorance is one of the reasons nobody trusts them. The Science Media Centre are just helping that process along in the wrong direction. –Andrew Montford, Bishop Hill, 22 July 2013
First, I asked Stephen Belcher, the head of the Met Office Hadley Centre, whether the recent extended winter was related to global warming. Shaking his famous “ghost stick”, and fingering his trademark necklace of sharks’ teeth and mammoth bones, the loin-clothed Belcher blew smoke into a conch, and replied, “Here come de heap big warmy. Bigtime warmy warmy. Is big big hot. Plenty big warm burny hot. Hot! Hot hot! But now not hot. Not hot now. De hot come go, come go. Now Is Coldy Coldy. Is ice. Hot den cold. Frreeeezy ice til hot again. Den de rain. It faaaalllll. Make pasty.” –Sean Thomas, The Daily Telegraph, 19 June 2013
The Sunday Politics interview with Energy and Climate Change Secretary Ed Davey on July 14 provoked widespread reaction in the twittersphere and elsewhere, which was only to be expected given the interview was about the latest developments in global warming and the implications for government policy. Many of the criticisms of the Davey interview seem to misunderstand the purpose of a Sunday Politics interview. –Andrew Neil, BBC News, 22 July 2013
Henry.
Sunspots are indeed cooler areas but is their coolness not more than offset by the hotter areas around them and it is those hotter areas that fire off more energetic wavelengths is it not?
Stephen Wilde says
Sunspots are indeed cooler areas but is their coolness not more than offset by the hotter areas around them and it is those hotter areas that fire off more energetic wavelengths is it not?
Henry@Stephen Fisher wilde
I am actually looking at it from the other end, where I have proven (for myself) a link between increasing ozone (& others) and declining maximum temperatures.
The increase in ozone production TOA only makes sense if we assume more E-UV bombardment.. From which it follows that a “quiet” sun is somehow producing more E-UV… ?
As you know, TSI does not vary much, but I suspect there is some variation in the distribution of TSI, shifting the solar irradiance peak a bit to left, but overall, energy output looks much the same…
btw, you did not answer me, on a previous post, either positive or negative, where I posed that in a cooling world (from the top) you would naturally expect more clouds and rain at lower latitudes, thereby increasing albedo and amplifying the cooling (on the bottom).
It would be interesting to see ANY evidence that such possible pauses had ever been mentioned, even in passing, anywhere in the ‘literature’. Retro claims of past predictions which qualified or contradicted the consensus extraordinary and need extraordinary evidence.
typo: ,,, are extraordinary and …
Ian,
only have time to draft informal notes:
SH: high volume high heat capacity, largely ring-shaped westerlies — big role for accumulating heat storage
NH: strongly contrasting, angled midlatitude land/ocean gradients – & hence flows — big role for modulation of circulatory geometry (temperature, mass, & velocity are coupled, NASA JPL reminds us…)
NH sun-modulated (cross-ENSO average) surface circulation (wind) controls ocean welling (up & down) & evaporation, atmospheric water firehosing, and ice extent (a binary variable) — on/off circulatory switch (meridional vs. zonal, equatorward vs. poleward, & low momentum vs. high momentum) — so what matters is persistence in one state (mean large-scale circulatory configuration) or the (topologically-contrasting) other — varies with changing cycle length. Binary (i.e. discrete) is key = why NH response follows solar cycle phase differential.
Abrupt surface water – mass & state – spatial distribution (contrast) change ~1920s.
Capturing regional variability in some areas may be possible via tuned differential equation (as I suggested a few years ago) — investigating — very promising preliminary results for Pacific Northwest of North America — will report again in days/weeks ahead…
@ur momisugly phlogiston
not just nonlinear — observation suggests multipath is even more important (e.g. interannual) — maybe conceptualize it (for now) as spatiotemporally turbulent mixing – riding a longer wave
HenryP
I agree that a cooling world has more clouds and rainfall at lower latitudes. That is where the more meridional, equatorward jets come in.
I also agree that somehow we need ozone to increase above the tropopause in the higher latitudes when the sun is quiet so as to warm the stratosphere above the poles forcing down tropopause height at the poles relative to the equator which then leads to the more meridional, equatorward jets.
There have been reports that contrary to conventional climatology ozone decreases higher up in the atmosphere when the sun is active and increases when it is inactive.
The mesosphere and stratosphere cooled with less ozone during the late 20th century warming spell but that seems to have stopped with the quiet sun and there may be a slight recovery by now.
There are lots of upper atmosphere processes that can affect ozone quantities above the tropopause and they can involve both particle and wavelength changes so I am currently unable to attribute precise causation.
Therefore I simply say that it is changes in the overall mix of particles and wavelengths that alter the ozone creation/destruction balance and furthermore I suspect that the variations have different effects at different levels.
The net effect of such variations is to alter the gradient of tropopause height between equator and poles to allow latitudinal climate zone shifting beneath the tropopause.
That then affects total cloudiness and the amount of energy able to enter the oceans to fuel the system.
I like to keep things simple. If I go outside on a cloudy day, and the sun suddenly comes out, there’s a dramatic difference in the thermal energy reaching me. I’m sure that if CO2 concentration suddenly dropped by 25%, I wouldn’t notice the difference. Therefore I conclude that cloud density and cover would be a major driver of our climate. Just a small long term shift in average cloud cover would be very significant – much more than CO2. Yet all the IPCC seems to say is that they don’t understand clouds, so ignore them.
I know CERN is working on this, with nothing significant reported yet. I also understand the relationship of negative feedback – increased heat/more water vapour/ more cloud/ less heat. I can’t help thinking that cloud influence pales most other things into insignificance.
R James – The high sensitivity of average global temperature to tiny changes in cloud cover, as calculated at http://lowaltitudeclouds.blogspot.com/, corroborates your thinking.
henryy@Stephen Fisher wilde
yes it seems we are now getting on the same wavelength…. good to exchange some ideas with you… thanks.
just to summarize to you all my results
1)maximum temps starting increasing around 1950,
ozone started dropping from 1951
2) maximum temps. are falling from 1995
ozone is increasing from 1995, both NH and SH, but % wise the increase in the SH is more spectacular. SH has all the oceans, our energy store. Increasing ozone (+peroxides + nitrous oxides) bounces more sun light off to space so that in total less energy is going into the oceans (SH, predominantly).
hence we are cooling, from the top.
3) Due to this, as agreed, higher latitudes > [40] will get some less clouds and moisture, and it will also become cooler there. I have proven this as well by studying some random rainfall data.
The lower latitudes 30 > x > -30 will get more clouds and rain, on average. But insolation at the equator is 684 whereas on average it is 342, so with the higher albedo, due to the increased clouds at lower latitudes, we are cooling from the bottom as well.
At this stage, we must realize that these changes are not much, in real terms, but they are now going to add up and I promise you that we all will be shivering from the cold, in about ten years from now. Unfortunately.
(my wife still laughs at me when I tell here it has been globally cooling and we already dropped 0.2 degrees C or K in the last dozen years or so)
4) now to agree on the mechanism is the important issue.
In the end, I think William Arnold had it right in the first place.
http://www.cyclesresearchinstitute.org/cycles-astronomy/arnold_theory_order.pdf
to quote from the above paper:
“A Weather Cycle as observed in the Nile Flood cycle, Max rain followed by Min rain, appears discernible with maximums at 1750, 1860, 1950 and minimums at 1670, 1800, 1900 and a minimum at 1990 predicted.
The range in meters between a plentiful flood and a drought flood seems minor in the numbers but real in consequence….
end quote
According to my table for maxima, end of warming was around 1995, and not 1990 as William Arnold predicted.This is looking at energy-in. I think earth reached its maximum output (means) a few years later, around 1998/1999.
Anyway, either way, (a few years error is fine!), look again at my best sine wave plot for my data,now see:
1900 minimum flooding of the Nile – end of the warming
1950 maximum flooding – end of cooling
1995 minimum flooding – end of warming.
predicted 2035-2040 – maximum flooding – end of cooling.
The flooding of the Nile follows the other observations, exactly, i.e. that means more rain and clouds between [30] latitudes from 1995-2040.
Seeing that he had the dates right, in line with my data events on ozone and maxima, I think the rest of that report might also be correct. It is our planets exerting a weight on the centre of the sun, changing not its output so much as the distribution of the TSI, especially E-UV.
Do you perhaps have a correlation of E-UV against SSN?
In hindsight, what a pity of all our time and resources wasted, on the idea that it is the CO2 that is warming our planet….
But what is going to happen when we reach the bottom of the wave? That is where we have almost a complete standstill in the speed of cooling. Any ideas? I am convinced 1932-1939 drought is going to happen again…..
HenryP.
I think we are getting very close but a couple of differences remain.
I don’t think it is the amount of ozone above the tropopause that has a direct effect on climate. Instead it has an indirect effect by altering the gradient of tropopause height between equator and poles.
The amount of cloud (total global albedo) is the factor that directly affects temperatures by affecting the amount of solar energy that gets into the oceans.
In effect we have three factors capable of amplifying the effect of minor TSI changes compounding each other.
The shift in the mix of particles and wavelengths first alters tropopause heights which is one amplification factor then that change in heights affects global albedo which is another.and then the change in energy entering the oceans is yet another amplifying factor.
The result is shifting climate zones to an extent way out of proportion with what the small changes in TSI could cause.
But in the end all those changes are of no account in the long term because the climate zone shifts are themselves the negative system response cancelling out the thermal effect of the change in solar output.
It is the latitudinal climate zone shifts that regulate the flow of energy through the system in order to maintain long term stability.
As regards ‘the bottom of the wave’ I think it will be decades away unless the sun gets more active soon.
In the meantime we should see a general cooling develop with more atmospheric blocking systems, colder middle latitudes and more extremes as the more equatorward polar air masses crash against the warm equatorial air masses.
The ways it can all play out are infinite on a local level but the general trend will be colder stormier and latitudinally broader mid latitude climate zones.
Lots of people have noted he relevant correlations and the cyclical nature of it all but so far as I know no one else has proposed solar induced changes in the gradient of the equator to pole tropopause heights with all the climate and energy budget consequences that follow from that.
henry@Stephen Fisher wilde
you did not say what you think of william arnold’s theory? Is it the planets causing the obvious 90-odd year weather cycle?
http://blogs.24.com/henryp/2012/10/02/best-sine-wave-fit-for-the-drop-in-global-maximum-temperatures/
we reach the bottom in a couple of years?
The planet theory fits like a glove; it (the planetary system) is like an elastic band, preventing over-cooling and run away warming. It means of course that if a catastrophe hits one of those big planets we are in deep trouble…
Hi Henry.
It doesn’t matter to me how the solar variations are caused.
It might be planetary influences or internal mechanics or a mixture of both.
My point is that whatever forces seek to cause thermal disruption within a planetary atmosphere the response of the atmosphere is always the same.
Quite simply the entire circulation pattern reconfigures to adjust the rate of energy throughput and thereby negate the effect of the forcing mechanism.
Note too that there is more than a 90 year cycle involved. The sun varies on a millennial time scale.
In the oceans the Thermohaline Circulation is up to 1500 years long.
Our emissions come nowhere in comparison.
I am in pretty much agreement with Stephen Wilde’s most recent postings. Mty studies lead to the same basic conclusions. Read some of my earlier post.
Salvatore Dep (Del?) Prete says
I am in pretty much agreement with Stephen Wilde’s most recent postings. Mty studies lead to the same basic conclusions
henry says
yes, I do remember that at some stage you called the work of William Arnold in that paper that I quoted to Stephen Wilde:
http://www.cyclesresearchinstitute.org/cycles-astronomy/arnold_theory_order.pdf
completely “obsolete” or something to that effect. But, please, do elaborate now, as to why you think William Arnold is/was wrong in pointing to the planets for the (apparent) change in weather (on earth), more specifically which part in the paper do you object to??
@ur momisugly Stephen Wilde
Have you yet realized that terrestrial & solar jets are being controlled by the same thing?
http://tallbloke.files.wordpress.com/2013/03/scd_sst_q.png
Supplementary: http://img845.imageshack.us/img845/6451/1xx.gif
That’s a clever animated GIF Paul… great work there.
Paul Vaughan said:
“Have you yet realized that terrestrial & solar jets are being controlled by the same thing?”
If the change in particles and wavelengths is caused by changes in the solar jets then that would be a logical observation but I don’t need to consider that for my purposes.
Note too that the solar jets would still not be the whole story because the Earth’s jets are controlled more directly by the net energy budget and the solar effect is heavily modulated by the lagging ocean response.
My position is that anything that affects the net energy budget will affect Earth’s jets and climate zones because their movement is the negative system response adjusting the flow of energy through the Earth system.
Stephen, seems we’ve had a misunderstanding. I’m saying a (previously) lurking variable is driving 2 systems in parallel …but I suppose this probably doesn’t matter for your purposes.
Ian,
a few more informal notes:
Southern Ocean is very well linked and mixed hard.
Northern basins: not so much …so they’ll highlight what’s happening instantaneously. The instantaneous signal is there in the SH too, but it doesn’t often stand out relative to the weighty background.
@ur momisugly Mario Lento (July 27, 2013 at 10:42 pm)
Thanks Mario.
…and it gets even better – (more details in the days/weeks ahead…)
Paul Vaughan said:
“a (previously) lurking variable is driving 2 systems in parallel”
Hi Paul.
That might be relevant to me if you suggest that the lurking variable affects the Earth’s jets directly without involving the sun’s jets first.
That is possible in principle if you are considering planetary movements but I don’t see that as able to significantly affect the temperature of the stratosphere and the equator to pole tropopause height gradient.
It seems to me to be far too small an effect to produce the air circulation shifts that we observe.
Stephen, there seems to be another misunderstanding.
I’ve made NO mention of “planetary effects”.
Far from being a “small effect”, it’s 80%:
http://img845.imageshack.us/img845/6451/1xx.gif
What you see there is SST & summaries of sunspot numbers (and NOTHING else).
All that’s left in the residuals is interannual.
You prefer words.
I prefer quantitative illustrations.
Be careful not to disagree with yourself!!
[ :
Cheers
Ok Paul.
So what do you say is the previously lurking variable?
Must be powerful if it accounts for 80% of observed variability.
New:
http://img7.imageshack.us/img7/1659/oiio.png
(short on time – will check back later…)
Ok Stephen
Ok Paul.
Are we are all agreed now here it is mainly the planets exerting a force on the sun that affects the weather on earth?
Then we are back to where William Arnold was / philosophized, (before the CO2 nonsense)
-God bless him, does he still live?-
If I read his dials correctly the planets (Jupiter and Uranus) will re-align similarly to where we were in 1934, in 2017. That would mean we only have a few years left before the dust bowl droughts 1932-1939
http://www.ldeo.columbia.edu/res/div/ocp/drought/dust_storms.shtml
I am trying to warn people of an impending disaster.
I can see from my own data
http://blogs.24.com/henryp/2012/10/02/best-sine-wave-fit-for-the-drop-in-global-maximum-temperatures/
that we could reach the bottom (constant speed= no difference in temps. = no difference in pressure= no rain ) around 2016
but William Arnold was out by at least 5 years in his prediction on the end of warming….
There could be a lag…?
please help me, if you can?
@ur momisugly Stephen Wilde
Pumping rate & persistence, as I’ve shown. Temperature, mass, & velocity are coupled. The mainstream simply underestimated how large scale circulation mixes stuff around in 4D. Keep in mind we’re looking at point samples & 1D cross-sections — hence the initial need to start with EOP to get solid quantitative constraints on solar-terrestrial circulatory pulsing. (When time permits I’ll update & reorganize some old graphs to give a refresher on that.)
btw: It’s 97% for the local Pacific Northwest example I gave. If you look hard enough near the bottom of that graph, you’ll see a faint grey line that accounts for less than 3% of the variation, which is about 0.5 degrees Celsius per century — that’s all that’s left to be shared by UHI, CO2, LIA rebound, &/or whatever else.
@ur momisugly HenryP
Once again: No planets. Just SST & sunspot numbers.
I stick to exploration. I’ve no interest in forecasting.
I respect your interests Henry. Best Regards.