From Dr. Benny Peiser and the GWPF
We Really Don’t Understand Our Climate

Something is happening to our sun. If history is anything to go by, the sun’s change of mood could affect us all by cooling the earth and throwing our climate change calculations into disarray. It might even be the case that the earth’s response to low solar activity will overturn many of our assumptions about man’s influence on climate change. Cold not warmth might be our future. We do not know. We must keep watching the sun. –David Whitehouse, Public Service Europe, 24 July 2013
Global warming has been on “pause” for 15 years but will speed up again and is still a real threat, Met Office scientists have warned. In a set of three new reports, the Met Office claims that global warming has been disguised in recent years by the oceans, which have absorbed greater amounts of heat and prevented us from noticing the difference at surface level. Other factors including a number of volcanic eruptions since 2000 and changes in the Sun’s activity, could also have masked the effect of greenhouse gases by providing a slight cooling effect, they said. –Nick Collins, The Daily Telegraph, 22 July 2013
In its conclusions the Met Office states that the pause has not falsified the climate models. If the pause is, as they define it and limit it, from 2001 onwards, then this is true. But if the pause is 16-years, as the temperature data actually show, then the models, already looking unimpressive, are in jeopardy. We are at the waiting stage. Better and more reliable OHC data are desperately needed. Even if global temperatures were to rise again the climate models have shown themselves inadequate. If the pause continues, however, then the crisis of climate science will become more serious. –David Whitehouse, The Global Warming Policy Foundation, 24 July 2013
The scientists say, pauses in warming were always to be expected. This is new – at least to me. I’ve never heard leading researchers mention the possibility before. I asked why this had not come up in earlier presentations. No one really had an answer, except to say that this “message” about pauses had not been communicated widely. But what about another possibility – that the calculations are wrong? What if the climate models – which are the very basis for all discussions of what to do about global warming – exaggerate the sensitivity of the climate to rising carbon dioxide? –David Shukman, BBC News, 22 July 2013
Scientists are still struggling to explain the slower-than-predicted global warming over the past decade. There are innumerable variables in the climate system that could be responsible for the warming slowdown. These scientists have identified some of the likeliest culprits, but one professor admitted that they “don’t fully understand the relative importance of these different factors.” The recent warming plateau is exposing our limited understanding of climate, and it’s effectively killing the rationale for green policies that limit growth and, at the most basic level, try to force people to do things they would rather not do. — Walter Russell Mead, Via Meadia, 23 July 2013
The Science Media Centre has released a statement on the failure of global temperatures to rise in line with the models. It’s spin of course, although perhaps not quite as blatant as we are used to from them. Lots of “our understanding is getting better” and not a lot of “nobody has a clue what’s going on”. There’s a complete misrepresentation of science’s level of understanding of the reasons why this is happening. As I said in Parliament, the inability of climate scientists to admit their ignorance is one of the reasons nobody trusts them. The Science Media Centre are just helping that process along in the wrong direction. –Andrew Montford, Bishop Hill, 22 July 2013
First, I asked Stephen Belcher, the head of the Met Office Hadley Centre, whether the recent extended winter was related to global warming. Shaking his famous “ghost stick”, and fingering his trademark necklace of sharks’ teeth and mammoth bones, the loin-clothed Belcher blew smoke into a conch, and replied, “Here come de heap big warmy. Bigtime warmy warmy. Is big big hot. Plenty big warm burny hot. Hot! Hot hot! But now not hot. Not hot now. De hot come go, come go. Now Is Coldy Coldy. Is ice. Hot den cold. Frreeeezy ice til hot again. Den de rain. It faaaalllll. Make pasty.” –Sean Thomas, The Daily Telegraph, 19 June 2013
The Sunday Politics interview with Energy and Climate Change Secretary Ed Davey on July 14 provoked widespread reaction in the twittersphere and elsewhere, which was only to be expected given the interview was about the latest developments in global warming and the implications for government policy. Many of the criticisms of the Davey interview seem to misunderstand the purpose of a Sunday Politics interview. –Andrew Neil, BBC News, 22 July 2013
Stephen Wilde says:
July 24, 2013 at 11:12 pm
Since my 2008 article I have created a stream of articles at climaterealists.com which, taken together, build up to a comprehensive climate overview from which I have extracted what I call a New Climate Model.
It is conceptual rather than mathematical but none the worse for that.
Nice comment – climate is also as much biology as it is physics. Maths is over-rated in regard to climate – mathematicians rushing into climate are rather like German armies invading Soviet Russia (I’m just reading Anthony Beevor’s new WW2 history so its an analogy on my mind). If maths have to be involved, it needs to be the right sort of maths – that of dissipative nonequilibrium-nonlinear oscillatory systems. Not back of envelope arithmetic.
FWIW I think there’s a danger the sun could become the new CO2 – proposed as the be all and end all of climate. Its not. I think small solar changes in output are best viewed as a weak forcer of an nonlinear oscillatory system. So the emergent wiggles will never exactly match the forcing wiggles and objective proof of the link with traditional linear based arithmetic and statistics will always be elusive. New nonlinear type tools are needed.
Look forward to seeing the new website.
It’s going to be so demoralizing to progresser environmentalist democrats when they find out planetary climate is the Sun’s fault stupid. I wonder if we could comfort them somehow?
Of course its the sun. The LIA occurred during a solar quiet time as did lowered temperatures during the Dalton minimum. If the sun is now in a quiet period then it will get colder models or no models.
The mainstream media has noticed the planet has stopped warming. The planet is starting to cool in response to the solar magnetic cycle 24 changes, with the most amount of cooling occurring in the same regions that warmed in the last 70 years.
If I understanding the mechanisms the cooling will be anomalous: too much cooling and too rapid. A change back to 1960’s winters (starting this winter) and then a change back to 1850’s winters (in a couple of years).
Significant and rapid cooling is only physically possible if the majority of the warming in the last 70 years was caused by solar magnetic cycle modulation of planetary clouds which unlike the CO2 theoretical mechanism is reversible.
Global cooling will be front page news. It will be interesting to see how quickly the scientific community abandons the extreme AGW hypothesis.
http://nsidc.org/data/seaice_index/images/daily_images/S_stddev_timeseries.png
http://ocean.dmi.dk/arctic/meant80n.uk.php
A) The planet has warmed and cooled in the past. Solar magnetic cycle changes correlate with the past warming and cooling cycles. The regions that warmed in the last 70 years are the same regions that warmed in the past when there was a solar grand maximum. There is smoking gun evidence that solar magnetic cycle changes cause cyclic climate change. The answer to the question how the sun causes cyclic climate change will be provided over the next few years by observations.
Greenland ice temperature, last 11,000 years determined from ice core analysis, Richard Alley’s paper.
http://www.climate4you.com/images/GISP2%20TemperatureSince10700%20BP%20with%20CO2%20from%20EPICA%20DomeC.gif
http://www.climate4you.com/
The following graph is a comparison of the past solar cycles 21, 22, and 23 to the new cycle 24 is provided. http://www.solen.info/solar/images/comparison_recent_cycles.png
This is a graph, that is also located at the above site, that compares solar cycle 24 to the weakest solar magnetic cycles in the last 150 years. http://www.solen.info/solar/images/comparison_similar_cycles.png
http://www.economist.com/news/science-and-technology/21574461-climate-may-be-heating-up-less-response-greenhouse-gas-emissions
B) Observations indicate there are one or more fundamental errors in the extreme AGW science OVER the past 15 years air temperatures at the Earth’s surface have been flat while greenhouse-gas emissions have continued to soar. The world added roughly 100 billion tonnes of carbon to the atmosphere between 2000 and 2010. That is about a quarter of all the CO₂ put there by humanity since 1750. And yet, as James Hansen, the head of NASA’s Goddard Institute for Space Studies, observes, “the five-year mean global temperature has been flat for a decade.” (William: Hansen appears needs to check a calendar. Planetary temperature has not increased for 15 years.)….
….Yet it does not. In fact, it may actually be an overestimate. Over the past few years, measurements of aerosols have improved enormously. Detailed data from satellites and balloons suggest their cooling effect is lower (and their warming greater, where that occurs). The leaked assessment from the IPCC (which is still subject to review and revision) suggested that aerosols’ estimated radiative “forcing”—their warming or cooling effect—had changed from minus 1.2 watts per square metre of the Earth’s surface in the 2007 assessment to minus 0.7W/m ² now: ie, less cooling.
One of the commonest and most important aerosols is soot (also known as black carbon). This warms the atmosphere because it absorbs sunlight, as black things do. The most detailed study of soot was published in January and also found more net warming than had previously been thought. It reckoned black carbon had a direct warming effect of around 1.1W/m ². Though indirect effects offset some of this, the effect is still greater than an earlier estimate by the United Nations Environment Programme of 0.3-0.6W/m ².
All this makes the recent period of flat temperatures even more puzzling. If aerosols are not cooling the Earth as much as was thought, then global warming ought to be gathering pace. But it is not. Something must be reining it back. One candidate is lower climate sensitivity.
A related possibility is that general-circulation climate models may be overestimating the impact of clouds (which are themselves influenced by aerosols). In all such models, clouds amplify global warming, sometimes by a lot. But as the leaked IPCC assessment says, “the cloud feedback remains the most uncertain radiative feedback in climate models.” It is even possible that some clouds may dampen, not amplify global warming—which may also help explain the hiatus in rising temperatures. If clouds have less of an effect, climate sensitivity would be lower. ….
David Gloss says:
July 24, 2013 at 5:15 pm
“I have only ever found one guy with a good theory on what is happening and why. His name is Fred Bailey and he has written books about his theory about solar chord science. His website is http://www.solarchords.com/. It is time to worry about coming crop failures in the northern hemisphere and the dwindling world food stocks due to ethanol farming.”
Was reading some of the info on the site link you provided and came across his solar cycle predictions by his solar chord method. Predicted cycle 23 to be 10 years and it was in reality 12.1 years. Kind of shows his method is not reliable. Also predicts cycle 24 will be 10 years long, most likely incorrect also.
henry asks
“more cloudiness as a result of what?””
stephen wilde says
Longer lines of air mass mixing from more meridional jets.
I think the increase in cosmic rays is merely coincidental and not causative.
henry says
I have a theory, although it is not really a theory, it is just common sense,
namely that as global cooling continues, as proven, by my own data set,
http://blogs.24.com/henryp/2013/02/21/henrys-pool-tables-on-global-warmingcooling/
&
http://blogs.24.com/henryp/2012/10/02/best-sine-wave-fit-for-the-drop-in-global-maximum-temperatures/
and that of others,
http://www.woodfortrees.org/plot/hadcrut4gl/from:1987/to:2014/plot/hadcrut4gl/from:2002/to:2014/trend/plot/hadcrut3gl/from:1987/to:2014/plot/hadcrut3gl/from:2002/to:2014/trend/plot/rss/from:1987/to:2013/plot/rss/from:2002/to:2013/trend/plot/hadsst2gl/from:1987/to:2014/plot/hadsst2gl/from:2002/to:2014/trend/plot/hadcrut4gl/from:1987/to:2002/trend/plot/hadcrut3gl/from:1987/to:2002/trend/plot/hadsst2gl/from:1987/to:2002/trend/plot/rss/from:1987/to:2002/trend
the temperature differential between the poles and the equator will become bigger.
This would naturally cause more clouds at lower latitudes and less moisture being available for higher latitudes.
But now, with more clouds at lower latitudes, you get less insolation in total, and this amplifies the cooling of earth. (Therefore sudden strong cooling periods are predictable….)
Never mind that, the logical result is that at higher latitudes it will become both drier and cooler.
I believe that this was the cause of the dust bowl droughts 1932-1939 on the Great Plains. (USA & CANADA)
To check my own “common sense” , I looked at the daily rain reported by a weather station in Wellington, NZ, at -41 latitude. I find that between 1930 and 1939, the average rainfall was 14% lower than that from between 1940-2005. I think that amount is significant and it proves my point. (remember New Zealand are a few islands in the ocean where there is naturally always more moisture, unlike the Great Plains of the USA).
With more than 7 billion people counting on their daily food from mother earth, doing nothing as Lord Monckton of Brenchley has suggested, might perhaps not be such a good idea.
I copy and paste here my answer to him, made on another thread on same issue:
henry says
there was a time that I would probably agree with you on that but not anymore.
The truth is that all current results show that global cooling will continue, especially when you look at things from 2002 (which includes one full solar cycle)
http://www.woodfortrees.org/plot/hadcrut4gl/from:1987/to:2014/plot/hadcrut4gl/from:2002/to:2014/trend/plot/hadcrut3gl/from:1987/to:2014/plot/hadcrut3gl/from:2002/to:2014/trend/plot/rss/from:1987/to:2013/plot/rss/from:2002/to:2013/trend/plot/hadsst2gl/from:1987/to:2014/plot/hadsst2gl/from:2002/to:2014/trend/plot/hadcrut4gl/from:1987/to:2002/trend/plot/hadcrut3gl/from:1987/to:2002/trend/plot/hadsst2gl/from:1987/to:2002/trend/plot/rss/from:1987/to:2002/trend
Those that think that we can put more carbon dioxide in the air to stop the global cooling are just not being realistic. There really is no hard evidence supporting the notion that (more) CO2 is causing any (more) warming of the planet, whatsoever.
I have now finished my own investigations into all of this
namely
1 I took a random sample of weather stations that had daily data
2 I made sure the sample was globally representative (most data sets aren’t)
a) balanced by latitude (longitude does not matter)
b) balanced 70/30 in or at sea/ inland
c) all continents included (unfortunately I could not get reliable daily data going back 38 years from Antarctica,
so there always is this question mark about that, knowing that you never can get a “perfect” sample)
d) I made a special provision for months with missing data (i.e. not to put in a long term average, as usual in stats, but to average the results of that month in the year preceding and following )
e) I did not look only at means (average daily temp.) like all other data sets, but also at maxima and minima…
3) I determined at all stations the average change in temp. per annum from the average temperature recorded,
over the period indicated.
http://blogs.24.com/henryp/2013/02/21/henrys-pool-tables-on-global-warmingcooling/
4) the end results on the bottom of the first table (on maximum temperatures),
clearly showed a drop in the speed of warming that started around 38 years ago, and continued to drop every other period I looked//…
5) I did a linear fit, on those 4 results for the drop in the speed of global maximum temps, versus time,
ended up with y=0.0018x -0.0314, with r2=0.96
At that stage I was sure to know that I had hooked a fish:
I was at least 95% sure (max) temperatures were falling
6) On same maxima data, a polynomial fit, of 2nd order, i.e. parabolic, gave me
y= -0.000049×2 + 0.004267x – 0.056745
r2=0.995
That is very high, showing a natural relationship, like the trajectory of somebody throwing a ball…
7) projection on the above parabolic fit backward, (10 years?) showed a curve:
happening around 40 years ago,
8) ergo: the final curve must be a sine wave fit, with another curve happening, somewhere on the bottom…
http://blogs.24.com/henryp/2012/10/02/best-sine-wave-fit-for-the-drop-in-global-maximum-temperatures/
the means table confirms that there is a bit of lag between maxima and means but even with means I can make parabolic fit with 95% confidence.
Altogether, that means that we are cooling. Unfortunately, global cooling is not “good”.
I find that as we are moving back, up, from the deep end of the 88 year sine wave, there will be standstill in the speed of warming, and therefore naturally, there will also be a lull in pressure difference at that [latitude], where the Dust Bowl drought took place, meaning: no wind and no weather (read: rain). However, one would apparently note this from an earlier change in direction of wind. According to my calculations, this will start around 2019 or 2020.
Danger from global cooling is documented and provable. It looks we have only ca. 7 “fat” years left (2013 – 88 = 1925).
if you will argue with me on my results that we did not see anything catastrophic happening around 1972, when we also had a standstill, in the speed of warming, I would agree with that but remember this was at the height of warming causing more natural clouds and moisture. Now we are approaching the bottom, and there simply will be a lot less moist air going around…..
WHAT MUST WE DO?
1) We urgently need to develop and encourage more agriculture at lower latitudes, like in Africa and/or South America. This is where we can expect to find warmth and more rain during a global cooling period.
2) We need to tell the farmers living at the higher latitudes (>40) who already suffered poor crops due to the cold and/ or due to the droughts that things are not going to get better there for the next few decades. It will only get worse as time goes by.
3) We also have to provide more protection against more precipitation at certain places of lower latitudes (FLOODS!),
There are some on this blog say that a Maunder type of solar minimum may lower global temperatures by only 0.1C Lets review what happens during low sunspot activity . I question this claim of 0.1C.and think it may at least 10 times higher when measured annually.
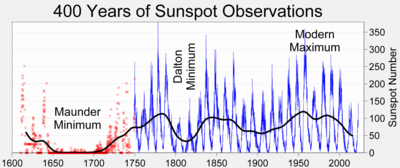
19 of the 30 coldest annual CET temperatures were during the three very low sunspot periods of Maunder Minimum. Dalton Minimum and the Modern Minimum of 1880-1910
20 of the 30 coldest winter CET temperatures were during the same three major minimums, regular minimums, or sustained low solar sunspot years
The period 1690-1699, the coldest decade, had an average annual temperature of 8.107C. The average annual decade temperature during 1981-2010 was 9.9 C. The annual average temperature 1940-1979 [the era before global warming was 9.48C] The annual average temperature shortly after MM, namely 1720-1729 was 9.3 C and 1730-1739 was 9.8 C
The coldest year during the same MM period of 1690-1699, namely1695 had an annual temperature of 7.25 C, or almost 2.65 C lower than our recent experience over the last 30 years
The average winter temperature during the same MM period was 2.59C. The average today is about 4 C
The winter of 1684 was the coldest in CET records
The same analysis of the period 1807-1816 during the Dalton Minimum shows annual temperatures of about 8.6C when annual sunspot number was zero during 1810. The winter of 1814 was the 4th coldest in CET records
If we check the record , global temperatures tend to drop near the end of long solar cycles and at the beginning of the next decade like One can see the global temperatures decline at the end of cycles # 9,13,14,20.
From a basic starting point the sun heats the earth by X amount. Additional factors come to play by the solar activity levels, which consequently affect a cascade of other variables which are chaotic. Throw in a mix bag of orbit variations and day length, lunar and galactic variances. Good luck with any modeling.
I would like to see some evidence that some model predicted a pause. I have heard it claimed 2 a century. This appears to run contrary to CO2 warming theory especially since it was claimed that CO2 is the dominant driver and dominates natural variability.
According to the theory, whenever there is an increase in global CO2 concentraions, there must be a corresponding increase in temperature; the temperature increase depending upon Climate Sensitivity. It is not sometimes there will be an increase in temperature, and some times there will not be any increase.
Now of course, natural variation muddies the water. One year natural variation may act to warm temperatures (e., the super El Nino of 1998), and in other years natural variation may act to cool temperatures. The upshot of this is that when natural variation is positive, when coupled with increasing CO2 emissions then there will be a lot of warming. When natural vaition is neutral, when coupled with increasing CO2 emissions there will be just the usual CO2 induced warming (depending upon Climate Sensitivity). When natural variation is negative, it will go in some way to cancel out the warming effect of CO2 caused by increased CO2 emissions. If as was alleged, CO2 is the dominant driver, even in this scenario there will be some very slight warming. If of course, CO2 is not the dominant driver, then negative natural variation could cause a temperature drop.
Now if models have predicted pauses of 10 to 15 yeras, they must have predicted periods when natural variation is a negative forcing exactly equal to the CO2 forcing brought about by rising CO2 emissions. So what negative natural variation did these model runs predict? To answer this, would help us to understand natural variation.
Further, during which periods did the models predict the pause and in particular at what CO2 levels. Given that CO2 emissions are rising unabated, the extent of the negative forcing of natural variation will have to be stronger during the second of the two predicted pauses. In other words what I am saying is that if temperatures were flat between say 1940 to 1960 (I have not checked, this is just an assumption being made for the purposes of argument0 then it would be easier for natural variation to cancel out the positive forcing of CO2 if at the time the CO2 levels were say 360 to 370ppm However, if we look at the period say 1998 to date, it is more difficult to cancel out the CO2 forcing now that CO2 levels are 390 to 400ppm. The negative natural variation forcing has to now be greater than it was during the period of 1940 to 1960.
This of course causes a major problem for the warmists since they were arguing that by late 1970s the forcing associated with CO2 at 1970s levels was now greater than natural variation such that the only thing that could explain the late 1970s onwards warming was CO2. But today the CO2 forcing is greater (given that CO2 levels have now reached 400ppm) such that it now has to be recognised that (i) natural variation is stronger than initially envisaged and upon which all the claims of cAGW were made, and (ii) given that natural variation is stronger than they envisaged to be the case, it can no longer be alleged that the only explanation for the post 1970s warming is CO2. It could now be natural variation.
As I see it, the pause at today’s high level of CO2 is fatal for an alarmist theory, and the only salvagable position is low Climate Sensitivity. This would not be a problem but for the political capital invested in the alarmist theory.
PS. I am one of those who considers that Climate Sensitivity is presently impossible to calculate from the limited data sets avilable (all of which have fundamandal issues, some more so than others), and I have yet to see compelling evidence that there is such a concept, or that CO2 at current levels at this stage of the Holocene plays any measurable role in influencing temperature.. .
If anything, higher CO2 concentrations dilutes the strong heat absorbing water vapor, thus reducing the atmospheres ability to retain heat. Other consequence of increasing CO2 is the greening of the planet; impossible to calculate the impact on global temperatures.
Richard Vada says:
July 24, 2013 at 11:18 pm
//////////////////////////////////////////
For many years I have seen people suggesting that if back radiation is increasing this would have an adverse influence on telescopes and that ever increasing corrections would have to be made to these instruments to compensate for/offset the additional DWLWIR being caused by increased GHGs. These people have suggested that there is no findings that ever more corrections are being required, and hence this suggests that DWLWIR is not increasing.
I have not seen any data on the point, but it is a point of interest.
phlogiston said:
“So the emergent wiggles will never exactly match the forcing wiggles and objective proof of the link with traditional linear based arithmetic and statistics will always be elusive. New nonlinear type tools are needed.”
Agreed. The best we can do is try to determine the general trend at any given moment. The interactions between solar and oceanic variability are hugely variable on their own and will be further confounded by inherent chaotic variability.
To determine the general trend we need to find a formula that relates the pattern of global air circulation to a point where the energy budget is approximately in balance.
Measurement of climate zone positions, sizes and intensities plus the total length of all the jet stream tracks would be a good start.
Measurement of the gradient of tropopause height from equator to poles would also be useful.
Henry asked
“more cloudiness as a result of what?””
stephen wilde says
Longer lines of air mass mixing from more meridional jets.
I think the increase in cosmic rays is merely coincidental and not causative.
henry says
I have a theory, although it is not really a theory, it is just common sense,
namely that as global cooling continues, as proven, by my own data set,
http://blogs.24.com/henryp/2013/02/21/henrys-pool-tables-on-global-warmingcooling/
&
http://blogs.24.com/henryp/2012/10/02/best-sine-wave-fit-for-the-drop-in-global-maximum-temperatures/
and that of others,
http://www.woodfortrees.org/plot/hadcrut4gl/from:1987/to:2014/plot/hadcrut4gl/from:2002/to:2014/trend/plot/hadcrut3gl/from:1987/to:2014/plot/hadcrut3gl/from:2002/to:2014/trend/plot/rss/from:1987/to:2013/plot/rss/from:2002/to:2013/trend/plot/hadsst2gl/from:1987/to:2014/plot/hadsst2gl/from:2002/to:2014/trend/plot/hadcrut4gl/from:1987/to:2002/trend/plot/hadcrut3gl/from:1987/to:2002/trend/plot/hadsst2gl/from:1987/to:2002/trend/plot/rss/from:1987/to:2002/trend
the temperature differential between the poles and the equator will become bigger.
This would naturally cause more clouds at lower latitudes and less moisture being available for higher latitudes.
But now, with more clouds at lower latitudes, you get less insolation in total, and this amplifies the cooling of earth. (Therefore sudden strong cooling periods are predictable….)
Never mind that, the logical result is that at higher latitudes it will become both drier and cooler.
I believe that this was the cause of the dust bowl droughts 1932-1939 on the Great Plains. (USA & CANADA)
To check my own “common sense” , I looked at the daily rain reported by a weather station in Wellington, NZ, at -41 latitude. I find that between 1930 and 1939, the average rainfall was 14% lower than that from between 1940-2005. I think that amount is significant and it proves my point. (remember New Zealand are a few islands in the ocean where there is naturally always more moisture, unlike the Great Plains of the USA).
With more than 7 billion people counting on their daily food from mother earth, doing nothing as Lord Monckton of Brenchley has suggested, might perhaps not be such a good idea.
I copy and paste here my answer to him, made on another thread on same issue:
http://wattsupwiththat.com/2013/07/21/ten-years-of-accelerated-global-warming/#comment-1369292
To Richard Vada:
Good information on the Gero & Turner paper. Actual measurements…
WHAT A CONCEPT!
Larry Kirk says:
July 24, 2013 at 10:45 pm
taobabe, I think you started off on the right foot. I’ve never seen anyone get away with the P-word before! Plenty have wished to though, I’m sure. Keep asking those questions.. Cheers, LK
________
🙂 I am reading all the comments and learning so much. Thanks for putting out all this info. I feel like I’m in a room full of scientists and professors. LOL. j/k
Stephen Wilde: I think it will be found that the current recharge is a weak affair due to increased global cloudiness since 2000.
Is there evidence for increased global cloudiness since 2000?
Salvatore del Prete: I think the start of the temperature decline will commence within six months of the end of solar cycle 24 maximum and should last for at least 30+ years.
I always appreciate a nice, unambiguous prediction. You are not of the opinion that cooling began already, I take it.
Matthew Marler asked:
“Is there evidence for increased global cloudiness since 2000?”
Yes.
http://wattsupwiththat.com/2007/10/17/earths-albedo-tells-a-interesting-story/
“Earth’s Albedo has risen in the past few years, and by doing reconstructions of the past albedo, it appears that there was a significant reduction in Earth’s albedo leading up to a lull in 1997. 1998 has been touted as one of the warmest years on record, and the time lag may have had to do with the thermal inertia of the oceans. Then the albedo increased, making the earth more reflective. Clouds have the greatest potential for changing albedo on a short time scale.”
William Astley, I really like those graphs you posted. Makes things really clear. Thanks!!!
Salvatore Del Prete says:
July 25, 2013 at 12:40 pm
Leif Svalgaard, Willis Eschenbach don’t have any understanding of thresholds and why sometimes solar changes will result in a major climate change ,while at other times they will not. Many times solar changes are not to a degree of magnitude great enough to flip the climate into another climatic regime, or even be the dominate factor in promoting which way the climate may go. They can’t grasp that simple fact, and therefore reach all bogus conclusions, when it comes to solar /climate relationships.
You will both however be proven wrong before the decade ends.
Nicola Scafetta , is more with it but is still lacking.
Nicola Scafetta does not understand thresholds (abrupt climate change),does not understand(like his counterparts) how sometimes solar changes might cause a major climatic shift while at other time hardly any.
He does not understand the beginning state of the climate will give a different end result even if the same forcings are applied to the climate.
Does not understand all the secondary effects which will come from a long prolonged solar minimum period.
He tries to fit everthing into a neat cycle, and thinks climate change is slow and gradual ,inspite of all the past evidence to the contary.
He still buys into the greenhouse gas effect (ridiculous) as a factor in the determination of the climate, when the reality is the greenhouse gas effect is a product of the climate.
The state of climate science is a mess and all of you three have made major contributions, to the mess.
The short answer is yes. But, the change will be slow; a trend of only about 0.1K per decade, maybe twice that fast over land.
Nearly everyone who is paying attention is aware that about 95% of the energy retained by the planet is stored in the oceans. What is less well understood is that this means that the planet has a huge effective thermal capacitance (thermal capacitance is like inertia in a mechanical system). This results in a time constant (the time it takes the system to reach 63.2% of its final (asymptotic) value after a step change in forcing) of 5 years or more which absolutely prohibits the rapid year-to year changes that are reported by the several agencies. Thus the reporting contains substantial random uncertainty (equivalent s.d. of approximately ±0.1C). http://climatechange90.blogspot.com/2013/05/natural-climate-change-has-been.html
The IPCC and the consensus have made several egregious mistakes that have misled a lot of people. Some of the mistakes are discussed at http://consensusmistakes.blogspot.com/
Matthew thanks. Time will tell and we will know before this decade is out who was most correct and who was wrong.
I think the cooling will start within 6 months of solar cycle 24 maximum ending, but ocean heat content lag has to always be considered.
This factor however should become less of a factor as we proceed through this decade and very quiet solar conditions prevail.
I am looking for a further decline in the AO oscillation to more negative values once very quiet solar conditions once again start to take effect.
richard verney says:
July 25, 2013 at 7:28 am
++++++++++++++
Richard: This was in incredibly logical and cogent post!
I wonder if any of you guys here actually realize that a “quiet” sun, is actually a hotter sun, especially in terms of UV. Dark spots on the sun mean cooler areas. No spots on the sun mean more high energy, especially lower wavelengths. This affects the production of ozone, peroxides and nitrous oxides, lying TOA, deflecting more sunlight to space.So, a hotter sun, makes earth cooler.
I think there are not too many people who figured it out, though,,,
Let me know if you agree with me on that? If you miss this, you miss the whole global cooling story,
i.e. why it will continue to cool, until ca. 2040
http://blogs.24.com/henryp/2012/10/02/best-sine-wave-fit-for-the-drop-in-global-maximum-temperatures/