OVERVIEW
In a number of posts, we’ve discussed and illustrated the difficulties with ocean heat content data. (There are links to those earlier posts at the end of this one.) The data presented in this post is supported by the 2012 Levitus et al paper World ocean heat content and thermosteric sea level change (0–2000 m), 1955–2010 [8.1 MB].
One topic discussed but not illustrated (until now in Figure 1) was that the annual variations in temperatures at depths between 700 and 2000 meters were in terms of hundredths if not thousandths of a deg C and that it was unrealistic to think we could measure the temperatures of the oceans at depth with that type of accuracy. It turns out that the annual variations are typically in thousandths of a deg C. The total scale of the temperature anomalies of the graph in Figure 1 is two one-hundredths of a deg C.

Figure 1
Keep in mind that Figure 1 presents the approximated changes in annual temperature for the depths of 700-2000 meters—not the anomalies. The annual changes are determined simply: by subtracting the value of the previous year from the value of the year being plotted.
The ocean temperature data for the depths of 700-2000 meters is an important topic. With the surface temperatures no longer warming and with the slowdown in the rate at which the oceans are warming at depths of 0-700 meters, climate scientists are now saying the missing heat is being forced to depths below 700 meters. Of course, that assumes the missing heat actually exists.
DATA AND METHOD
The NODC provides vertically averaged temperature anomalies for 0-700 meters here, and for the depths of 0-2000 meters here. To use that data to determine the variations in temperatures at depths between 700 and 2000 meters we need to know the volume of water in the depth ranges of 0-700 meters and 0-2000 meters. In reality, we don’t necessarily need the volumes. We can work with percentages.
According to an EPA document about ocean heat content data (here):
…the top 700 meters of the ocean (nearly 2,300 feet)…accounts for just under 20 percent of the total volume of water in the world’s oceans.
“[J]ust under 20 percent” could mean many things, so we’ll use the rounded figure of 20%.
Then on the last page of the NOAA presentation here, under the heading of “ARGO Future Possibilities”, they have the bullet point:
-52% of ocean volume below 2000 m
That obviously means that about 48% of the ocean volume is above 2000 meters.
Assuming those percentages are close to being correct, that means 41.66 % of the volume of the oceans to depths of 2000 meters comes from the top 700 meters and 58.33% at 700-2000 meters. I told you this was a rough estimate. So now we can use a simple weighted-average equation, where you solve for one of the components, to determine the changes in ocean temperature for the depths of 700-2000 meters. The result is illustrated above in Figure 1, and the data is presented as the annual change in temperature.
PUTTING THAT IN PERSPECTIVE
Figure 2 compares the annual changes in global sea surface temperature anomalies (HADSST3) and the vertically averaged temperatures of the global oceans to depths of 0-700 and 700-2000 meters.

Figure 2
In Figure 3, the data has been returned to their standard time-series form and I’ve added global land+sea surface temperature anomalies (HADCRUT4) as a reference. All of the data have been zeroed at 1955.

Figure 3
Many persons find it hard to believe that global surface temperatures can be estimated to the values shown. They’ll certainly have difficulty with the warming shown at depths of 700-2000 meters.
THE NODC’S HOCKEY STICK WHEN THEY TRANSITION TO ARGO DATA
Figure 4 presents the vertically averaged temperature anomalies for the global oceans for the depths of 700-2000 meters. They warm at a relatively constant and very slow rate until the ARGO floats begin the have complete coverage of the global oceans around 2003. Then they warm at a rate that’s almost 24 times faster than the rate seen in the 5 decades leading up to it.

Figure 4
It doesn’t look very realistic, now, does it?
IS THE HOCKEY STICK DEPENDENT ON THE PERCENTAGES USED?
Let’s assume that the percentages I discovered online are wrong, and that the relationship of the volumes of the oceans at depths of 0-700 meters and 0-2000 meters is a linear one. That is, we’re going to assume that there are no continental shelves and that the volume of the oceans from 0-700 meters is 35% of the volume from 0-2000 meters (700/2000 = 0.35). Therefore, in our hypothetical example world, the volume of water from 700-2000 meters represents the other 65% of the depths from 0-2000 meters. Plugging those percentages into our standard weighted-average equation presents the curve shown in Figure 5. The hockey stick still exists, but it’s not as pronounced.

Figure 5
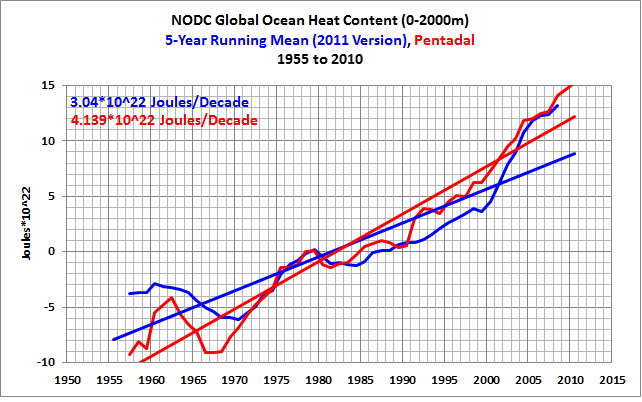
IS THE NODC FOOLING ITSELF WITH THE PENTADAL DATA?
Or are they trying to fool us?
In past posts (here and here), we showed how the NODC increases the warming rate of their ocean heat content data by presenting it in pentadal form. See the comparison graphs at depths of 0-700 meters (here) and 0-2000 meters (here). Figure 6 compares the roughly estimated vertically averaged temperature anomalies for the global oceans, for the depths of 700-2000 meters, from 1955 to 2012, in annual and pentadal forms. The same percentages of ocean volumes at depth (0.4166 for 0-700 meters and 0.5833 for 700-2000 meters) were applied to calculate both. In this comparison, I did not smooth the annual data because I wanted the break point in 2002 to be visible.

Figure 6
Not only does the data in pentadal form have a significantly higher warming rate, but its curve bears little resemblance to that of the annual data.
CLOSING
To account for the slowdown the warming of surface temperatures and in the heat content of the upper 700 meters of the global oceans, the climate science community is claiming manmade global warming is bypassing those levels and warming the oceans at depths below 700 meters. But that warming of the subsurface temperatures of the global oceans from 700-2000 meters represents variations measured in thousandths of a deg C. It is not reasonable to think we can measure the temperatures of the global oceans to that accuracy. Now consider that ocean heat content data have to be adjusted—tweaked, modified, corrected, whatever—in order for it to show warming during the ARGO era. (The UKMO EN3 data in the graph here should represent the uncorrected ARGO era data for depths of 0-2000 meters.)
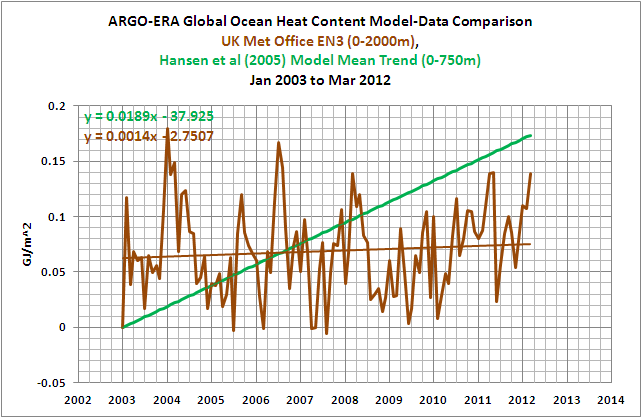
The vertically averaged temperatures for the depths of 700-2000 meters can be approximated from their data for the depths of 0-700 and 0-2000 meters. It shows a very sudden shift in the rate of warming for depths of 700-2000 meters. The shift coincides with the introduction of the ARGO floats to rarely sampled portions of the global oceans—the mid-to-high latitudes of the oceans of the Southern Hemisphere, for example. This suggests that the warming presented by the data at those depths may result from the more-complete sampling of the global oceans.
We’ve discussed the problems with ocean heat content data in numerous posts over the past few months. They include:
Is Ocean Heat Content Data All It’s Stacked Up to Be?
Ocean heat content for the depths of 0-2000 meters is not a dataset in which one should have any confidence. It appears that it was introduced solely so that global warming enthusiasts could claim global warming continues.
Why has the CO2 decided to switch from heating the atmosphere to heating the deep of the oceans? Or, more to the point HOW has CO2 decided to do this? Deep ocean temperature recordings are only recent, and are still isolated, with just a few (thousand or tens of thousands, they are still very isolated) ARGO buoys around the world. Even the surface temperatures were isolated, with the motivation, ability and credibility of the persons taking them highly variable – often, these were obtained from the engine intakes, and these could vary from 2 metres to twenty metres below the surface, with measuring instruments of dubious provenance. And now we are talking about measuring the increases in tenths – or even hundredths! – of a degree. Are the instruments in the field even accurate to that figure?
Finally, is this (newly-discovered?) heat a result of CO2, or perhaps has something to do with the many subsea smoke-stacks? These volcanic sites are surrounded by water heated to temperatures science thought life could not tolerate, at pH levels considered too low for marine life – yet life proliferates! Then there are the other volcanic sites, all along the Atlantic ridge, for a start; that constantly-oozing lava is being cooled, and, by being cooled, is heating the sea water around. Is the temperature increases caused in these ways recordable, or ignorable?
Figure 3
Many persons find it hard to believe that global surface temperatures can be estimated to the values shown. They’ll certainly have difficulty with the warming shown at depths of 700-2000 meters.
================
The money quote. Thanks Bob.
Greg Goodman says: @ur momisugly July 4, 2013 at 6:54 am
Mind you, if Peter Gleick is anything to go by, climate scientists already seem to be beyond the reach of the usual criminal law. At least in the USA.
>>>>>>>>>>>>>>>>>>>>>>>
From personal experience, I can tell you that the cops are not interested in catching crooks and the DA’s office is not interested in bring them to trial if there is no political gain involved or if the crooks have ‘Connections’ BTDT four times with four different thieves caught red handed and not one got tried much less went to jail. I have never seen so much dancing around the facts in my life except in Climate Science.
The Peter Gleick fiasco is about what the average citizen can expect if he does not have political ‘Friends’
This is the manner in which the accuracy of the global ocean temperatures readings are decided – the instrument accuracy is divided by the square root of the total number of observations.
So, if the instrument accuracy is .2 degrees, and the number of observations is 5000, the square root of which is 70.71 which in then divided into .2, that results in an instrument “accuracy” of .0029. Stupid and misleading, but “accepted” statistics.
I do not know the exact measuring quality of the ARGO floats, but if it is measured in tenths, then that to me would indicate the plus/minus of all the measurements to the tenth.
Thanks, Bob. Nice fireworks!
As always, the goal of the climate alarmist is to find some graph that can be interpreted as fearful warming. It is the same old same old. More excellent work, Mr. Tisdale.
As Judith Curry suggested only a few weeks ago on her blog; If the so called “missing heat” is going into the oceans and preventing global temperatures from increasing then it is the oceans and not CO2 that are controlling the global temperatures and climate.
And that would spell the failure of the entire basis in which the CAGW / Gaian worshipping ideology is founded.
Trenberth is going to have to do a lot of explaining to a lot of people on both sides of the equation if he fails to prove his claims very soon..
Chad Jessup says:
July 4, 2013 at 6:39 pm
This is the manner in which the accuracy of the global ocean temperatures readings are decided – the instrument accuracy is divided by the square root of the total number of observations….
>>>>>>>>>>>>>>>>>>>>
Complete and utter fallacy because each reading represents a unique time and place. They are not taking ten samples from the same batch of chemicals or ten widgets from the same cavity in a molding machine where you can increase accuracy by repeated sampling of the object under study and all other factors are held steady. (you hope)
Chad Jessup says: “This is the manner in which the accuracy of the global ocean temperatures readings are decided – the instrument accuracy is divided by the square root of the total number of observations….”
Since the accuracies of the individual components of the ARGO system are known, shouldn’t the system accuracy be the square root of the sum of the squares of the individual accuracies, aka RSS?
If we assume the temperature sensors in the floats have an accuracy of +/- 0.002 deg C, then the approximate system accuracy would equal SQRT((0.002^2)*3300) or +/- 0.11 deg C.
Regards
***
Bob Tisdale says:
July 4, 2013 at 7:45 am
beng says: “I don’t see how CO2 infrared can heat deep water very much, if at all…”
There’s nothing in the ocean heat content records (0-700m) or the satellite era sea surface temperature data to indicate that CO2 contributed to the warming of the oceans. I discussed that here (42MB):
http://bobtisdale.files.wordpress.com/2013/01/the-manmade-global-warming-challenge.pdf
If it doesn’t show up in the sea surface temperature data or the ocean heat content data, then one might suspect that all it does is add to the evaporation.
***
Bob, thinking about that, it seems rather remarkable. If true, it means CO2’s effect on the oceans is similar to land — almost (geologically) immediate. And estimates of long-term equilibrium are overstated. The long-term CO2 equilibrium may be much less than a decade for the entire global system (land+ocean), instead of decades or centuries as some have stated. This would essentially eliminate any “heat in the pipeline” theories — at least concerning CO2’s effect. Any longer-term effects from deep-water would be due to ocean-current changes (thermocline, upwelling/downwelling, etc), independent of CO2.
richard verney, July 4, 2013 at 7:52 am said:...
So the warmists need to explain:
1. What physics and process involved explains why increased CO2 emissions leading to ever increasing amounts of backradiation in the 20th century heated the atmosphere, but not the deep ocean (ie., below 700m), but now (ie., the 21st century) that physics and process leads to heating the deep ocean but not the atmosphere.
2. What physics and process involved explains how the energy which is heating the deep ocean passes through the 0 to 700m range undedected.
3 What physics and process involved explains how the extra energy absorbed in the deep ocean will return to warm the surface and when this will occur and at what rate will the surface layer be warmed.
In other words, their Emperor is naked.
Ok let’s talk about the down-welling of warm water. First some basics; warm water is less dense than cold water and in the Oceans, seawater is layered by density. From this we deduce that the water at the bottom of the ocean is always colder than that above, because the coldest water in a particular water column always has the greatest density. Is this correct?
Well actually this is not correct, because the ocean is not a uniform body of fresh water; it is complex association of salt water bodies with different origins and mixing histories. With seawater it is perfectly possible to have a body of warm haline that is denser than a colder but less haline one. If ocean currents bring these two distinct water bodies together in a zone of convergence, then the warmer saltier and more dense water will sink below the colder but less haline water, in a zone of dense warm water down-welling.
In meteorology we know that air masses are created with distinctive properties of temperature and humidity by the environmental conditions of their source area, so too in the oceans seawater masses are created with distinctive properties of temperature and salinity by their environment of origin. For example the modern Red Sea Bottom Water (RSBW) has a temperature of +21.7C and a salinity of 40.6 psu, this means that the RSBW has a density of 1028.595 kg/m3. By contrast Antarctic Bottom Water (AABW) has a temperature of -0.8C and a peak salinity of 34.7 psu. This means that the coldest sea water on the planet, which has a density of 1027.893 kg/m3, is less dense than Red Sea Bottom Water. In a straight fight between these two marine waters the Red Sea Bottom Water would win and the deeps of the ocean would be filled with warm oxygen poor bottom water from the tropics and not cold oxygenated water from the polar seas.
Sorry to labour the point but this is crucial for what follows next. Ok you say but the Red Sea does not influence the temperature of the ocean deeps in the modern world. True, the Red Sea is restricted in its access to the Indian Ocean, but notice that under modern atmospheric conditions the Red Sea easily creates and maintains a body of warm bottom water more dense than that of the AABW. Notice too that half the surface area of the planet lies between 30N and 30S, so it terms of size the marine Tropics and not the marine Polar region predominates. The controlling Thermo Haline Circulation process (warm Tropics or cold Polar) that determines the temperature of the deeps during a given geological age is merely an accident of ocean basin geography.
I have personal observation and experience of warm water down-welling, which is how I became interested in the whole subject of ocean water movement and the mechanics of the Thermo Haline Circulation (THC). Let me introduce you to a part of the modern tropics, the Atlantic Ocean archipelago of the Turks and Caicos Islands. In 1991 I had the good fortune of going on a geoscience field trip to West Caicos to study a modern open ocean carbonate platform environment. The Caicos archipelago is located on the Tropic of Cancer in a dry part of the West Indies where the climate is dominated by the warm dry North East Trade Winds blowing out from the Horse Latitudes anticyclone of the Hadley Cell situated to the north.
The combination of the dry trade winds, the extensive shallow water platform and the tropical sun means that the Caicos lagoon acts as a giant solar energy collector. In the lagoon, which has an area of some 200 sq. km and a water depth of no more than 10 metres, the tropical sun warms the sea water, the dry trade winds enhance evaporation concentrating the seawater and increasing the salt water density. The trade winds then blow this warm dense water across the platform lagoon to the west, where we find the tiny island of West Caicos,
West Caicos is a superb microcosm of a modern platform island undergoing carbonate deposition. As part of our exploration of the island’s environment we swam out from the west side across the coral reef flat to the platform edge. Over the reef the waters were warm, but as soon as we got the reef limit the water temperature suddenly dropped and I experience severe cramp in both legs. Fortunately I was wearing a life jacket and so no harm was done, but the experience was so dramatic and the impression so strong that I determined to find out what had happened to the warm water.
My researches led me to the following. In her paper: The Maastrichtian Late Cretaceous climate in the Northern Hemisphere Golovneva, L.B. (2000) deals with the high Arctic of the late Cretaceous and clearly establishes the principle of mode of THC at that time. She states (p51):-
As explained by Golovneva, in the absence of a polar ice cap (in either hemisphere) the bottom waters of the world ocean must be dominated by the thermo-haline circulation of warm dense marine brines sourced in the low latitude shallow waters of epeiric seas and continental shelves, for example those seas associated with the tropical margins of the Tethys Ocean.
At Caicos this process occurs today in miniature within an open ocean lagoon in the tropical Atlantic. I now know that the wind driven warm dense water created in the shallow waters of the Caicos lagoon falls away at the western drop off of the platform to be replaced at the surface by colder but less dense open ocean water that surrounds the archipelago and I believe that this marine warm water down-welling process is a fundamental feature of tropical latitude shallow water carbonate shelves located beneath the Hadley Cell. It is probably no coincidence that the world free diving record was set at Providenciales where the surface warm water current exits from the Caicos platform.
The modern Red Sea Bottom Water with its temperature of +21.7C shows how this mechanism of tropical solar energy capture and heat distribution by deep marine water was maintained in the past. The THC process of tropical warm water down-welling accounts for both the high average atmospheric temperature of the global climate for the Cretaceous and also explains the high Carbon Dioxide concentration in the atmosphere at that time.
Gail @ur momisugly 6:11 am – thank you for the amplification of/addition to my remarks.
Bob @ur momisugly 7:29 am – My main gripe with systems accuracy in regard to ocean temperatures occurs when the digits expand to include the ten-thousandths place (as reported in the mass media), when each instrument’s accuracy is only guaranteed to be within .005 degrees C.
Recent googling of ARGO floats reveals studies which accept the individual float temperature error factor of +/- .005 C, so I would conclude the measured accuracy of the systems to be within that parameter, but as Gail stated above, each particular float is measuring a different entity than what other floats are measuring.
My hat is doffed to the excellent engineers who designed and manufactured those fine ARGO machines.
Keep up the good work Bob. Thanks.
Tim Ball @ur momisugly July 4, 2013 at 10:22 am
Thanks for your post. The following link to the Virtual Seismic Atlas shows the seismic response of the warm dense Mediterranean Bottom Water as it exits west through the Gibraltar Strait and flows beneath the colder surface water of the open Atlantic.
Meddy image GOLR012.
Author: Richard Hobbs
Late comment, but isn’t it customary to present figures of data like those above with error bars? Which never happens in climate science. Indeed, there should not only be error bars but a full discussion of the methodology used to obtain them.
Surely this addresses one way or the other the issue of ability to resolve temperatures at 0.001K . Which I would not believe possible for my own back yard, let alone the entire ocean, sure, but part of the REASON I wouldn’t believe it is because a glance at the statistical fluctuations in the actual data would convince me that accuracy of this sort is impossible. Perhaps temperatures don’t fluctuate much in the 700-2000 m range (indeed, below the thermocline, I suspect that they DON’T fluctuate much) and perhaps they don’t even vary much with latitude and longitude, so that one can get a very accurate result from just a few samples in a few locations. But either way, the data itself surely speaks to this. If one is permitted to see the actual data contributing to the numbers themselves, of course, or the paper has a section on accuracy, errors, and methods (as it should, but I don’t have time to read it and find out).
rgb
OK, I glanced at the paper, and no they do not discuss how they arrive at their error bars (which are order of 10% of the effect IIRC). They do, fairly enough, talk about how they create an “anomaly” and compute “heat content” but it is difficult to judge precisely how reliable their results are even with this without knowing more about both data source and the details of the computations. For example, they correct on the basis of density/salinity in the heat computation, but they do not indicate how reliable this data or correction is or how they assign an error estimate to the spatiotemporal volume associated with each measurement or to the global spatiotemporal average over the measurements.
They also admit that their actual data only goes to 1750 meters, not 2000, and they are basing the extrapolation on a much more limited data set. Not unreasonable, but it would have been better (IMO) if they’d presented results only within the range of the actual instrumentation they used instead of effectively extrapolating it this way, especially after disparaging infilling elsewhere in the paper. Infilling sucks, I agree, but it is better than extrapolation.
Either way, I would be very interested in knowing in a lot more detail how they compute errors.
rgb
Bob Tisdale has, as he invariably does, delivered a carefully researched and beautifully presented posting. I do hope he will draw the postings together and submit it for peer review.