Guest post by Dr. Leif Svalgaard
The official sunspot number is issued by SIDC in Brussels http://sidc.be/sunspot-data/ . The [relative] sunspot number was introduced by Rudolf Wolf http://en.wikipedia.org/wiki/Rudolf_Wolf in the middle of the 19th century. He called it the ‘relative’ number because it is rather like an index instead of the actual number of spots on the Sun. Spots occur in groups [which we today call ‘active regions’] and Wolf realized that the birth of a new group was a much more significant event than the emergence of just a single new spot within a group, so he designed his index, R, [for any given day] to be a weighted sum of the number of spots, S, and the number of groups, G, giving the groups a weight of 10: R = S + 10*G. The number of 10 was chosen because on average a group contains about 10 spots, and also because it is a convenient number to multiply by.

Later, Wolf introduced the so-called ‘k-factor’ to compensate for differences in the size of telescope, precise counting method, observer acuity, etc, in order to bring the relative sunspot number determined by another observer on to the same scale as Wolf’s: R = k (10*G + S), where k is 1 for Wolf himself using his ‘standard telescope’ [Figure 1a,b] and his rules [not counting the smallest spots] for counting spots. From the 1860s Wolf had to travel extensively and he used exclusively [for the rest of his life] a much smaller telescope [Figure 1c]. With a smaller telescope Wolf, obviously’ saw fewer spots [and groups!], so he used k = 1.5 to convert his counts to the scale of the standard telescope.
Wolf’s successor, Alfred Wolfer, thought [rightfully] that the rule of ‘not counting the smallest spots’ was too vague and advocated to count all spots and groups that could be seen. This, of course, made his count larger than Wolf’s, so based on overlapping counts during 1876-1893, determined that to place his [Wolfer’s] relative number on to the Wolf scale he should multiply by 0.6 [one could say that his k-factor was 0.6]. This conversion factor of 0.6 has been adopted by all [Zurich] observers ever since. Adopted, not measured, as Wolf is not around any more. SIDC adopts that same factor, thus striving to stay on the Zurich scale.
So far, so good. But at some point in the 1940s, the Zurich observers began to ‘weight’ sunspots according to size and complexity, such that large spots would not be counted just once [as Wolf and Wolfer did], but up to five times, i.e. given a weight of five. There is nothing wrong with that, if one then also adjusts the k-factor to reflect this new way of counting. The director of the Zurich observatory from 1945-1979, Max Waldmeier, may have thought [?] that the weighting was introduced a long time ago [he mentions ‘about 1882’] so that no change of k-factor would be needed. Waldmeier set up a station in Locarno in southern Switzerland [as the weather on the other side of the Alps is often complimentary to that in Zurich] to provide observations when it was cloudy in Zurich. The observers in Locarno [Sergio Cortesi began in 1957 and is still at it] were instructed to use the same weighting scale as Waldmeier in Zurich. Because SIDC to this day normalize all observations they collect from a network of 60-70 observers to the count from Locarno, the weighting scheme carries over unchanged to the modern sunspot number.
We know that Wolfer did not weight the spots [contrary to Waldmeier’s assertion], because Wolfer himself explicitly [in 1907] stated that each ‘spot is counted only once, regardless of size’, and also because Wolfer’s counts as late as in 1924 when compared to other observers’ simply show that single spots are counted only once no matter how large.
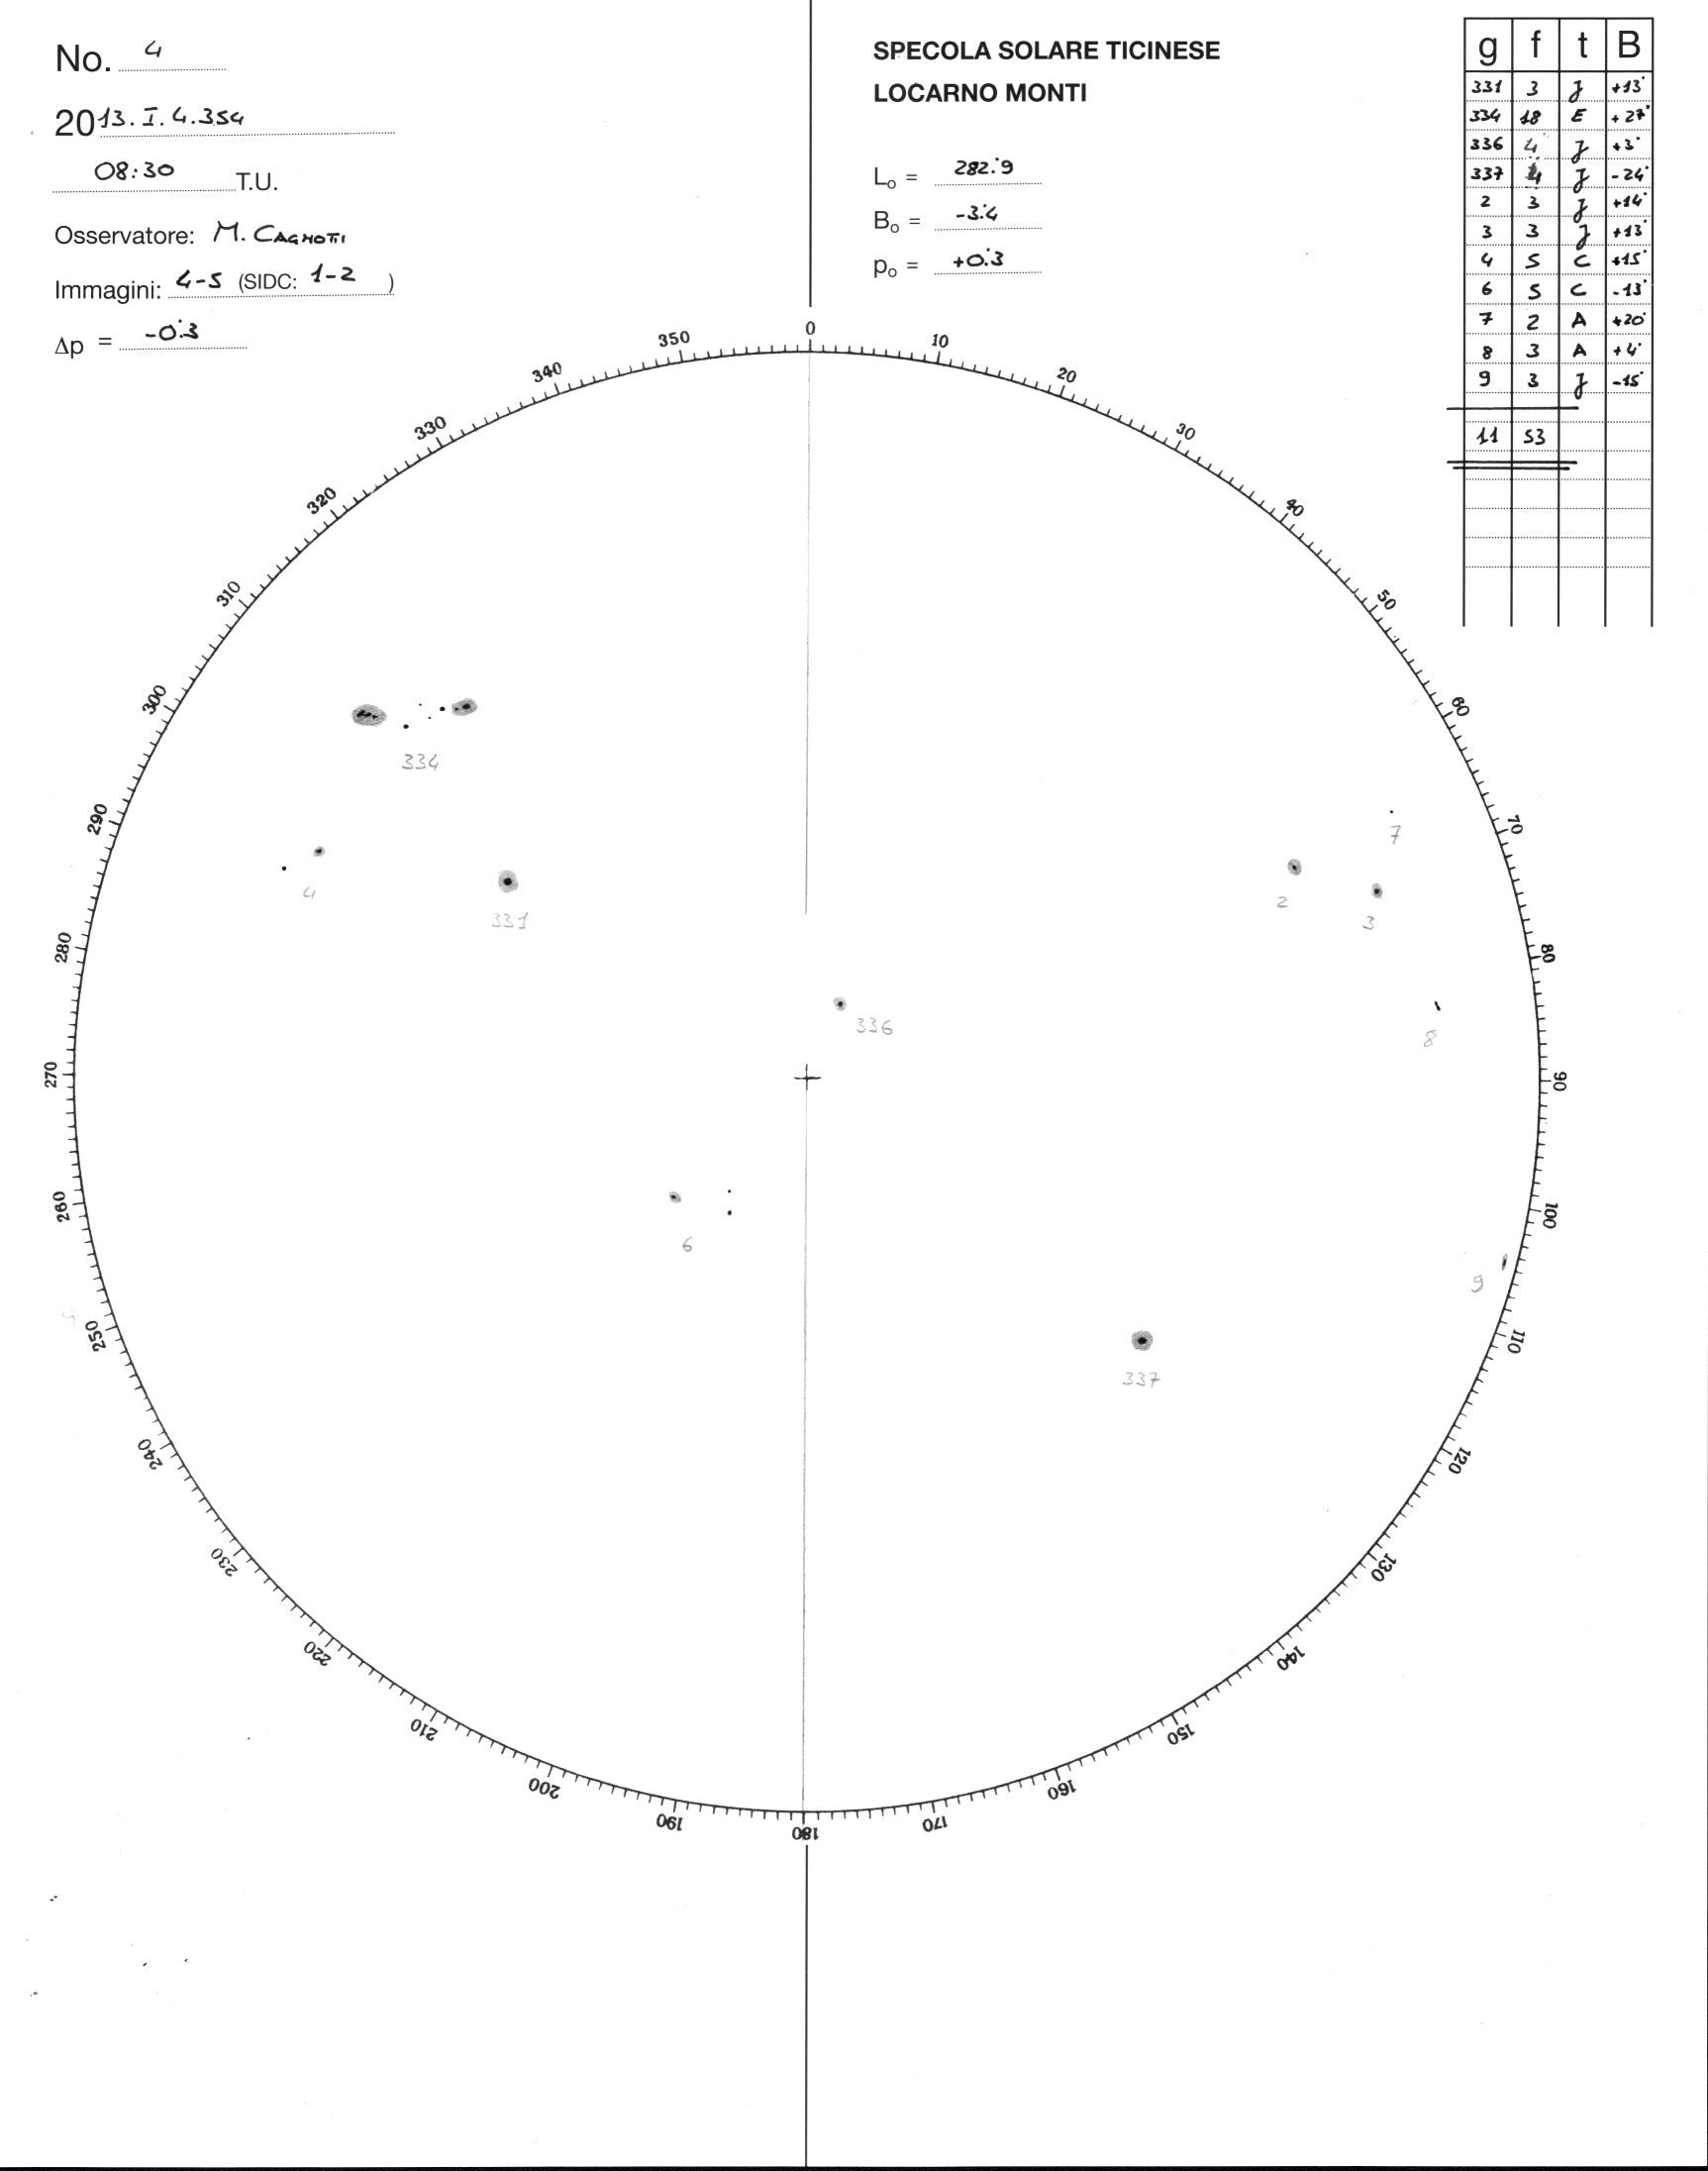
To get a feeling for how the weighting works, try to count the spots on the Locarno drawing for today http://www.specola.ch/drawings/2013/loc-d20130104.JPG and compare your counts with the values given for each numbered group in the little table at the upper right.
![loc-d20130104[1]](http://wattsupwiththat.files.wordpress.com/2013/01/loc-d201301041.jpg?quality=83)
(Note: I did this exercise, and found that my layman’s count was much lower than the “official” count, lending credence to Leif’s premise. Try it! – Anthony)
Marco Cagnotti’s [from Locarno] count is 11 groups and 53 ‘weighted’ spots. My count of the actual number of spots is 23. Try it for yourself. Your count may differ by about one from mine, but that does not change the fact that the weighted relative number 10*11+53=163 is about 23% larger than the ‘raw’, simple count of 10*11+23=133 that Wolfer and Wolf would have reported. For the whole of 2012 the ‘over count’ was 18%. So, it seems that the relative sunspot number suffered a 20% inflation because Waldmeier did not change his k-factor to compensate for the weighting.
Can we verify any of this? Well, one verification you can do yourself: just count the spots. But a better test is to ask the Locarno observers to report two numbers: the weighted count as usual and the unweighted count, where each spot is counted just once. Such a test has been [as is being] done. Figure 2 shows the effect of the weighting. Blue symbols show the official weighted count, and red symbols show Marco and my raw counts. The conclusion should be obvious.

The top panel of Figure 3 shows how well the sunspot number calculated from this formula matches that reporter by the Zurich observers.

Applying the same formula to data after 1945 gives us the lower panel. Under the assumption that the Sun did not know about Waldmeier we would expect the same relationship to hold, but in fact there is an abrupt change of the observed vs. the expected sunspot numbers between 1946 and 1947 of [you guessed it] 20%. Several other solar indicators give the same result. So there are several smoking guns.
What to do about this? One obvious thing would be to simply to remove the inflation [dividing the modern sunspot number by 1.20] and to stop weighting the spots. This turns out to be a bad idea, at least users of the sunspot numbers complain that they do not want to change the modern numbers as they are used in operational programs. The next-best thing is to adjust the old numbers before 1947 by multiplying them by 1.20. This is what we have decided to do [at least for now]. Who are ‘we’? You can see that here http://ssnworkshop.wikia.com/wiki/Home
There is a precedent for this [with the same ‘solution’]. In 1861 Wolf had published his first list of relative sunspot numbers, which he then updated every year after that. But about 1875 he realized that he had underestimated Schwabe’s counts [which formed the backbone of the list before Wolf’s own observations began in 1849]. Consequently, Wolf increased wholesale all the published sunspot numbers before 1849 by 25%. So we are in good company.
A somewhat disturbing [to many people] consequence of the correction of the official sunspot number is that there is now no evidence for a Modern Grand Maximum [‘the largest in 8000 years’ or some such].
NOTE: Figure 4 added 1/5/13 at Leif’s request

John Whitman says:
January 5, 2013 at 1:05 pm
Question for Leif about the length of time it took solar science to begin to focus more on identifying and then addressing rectification of the sun spot count inflation that started circa 1945.
I discovered around 2007 that something was wrong http://www.leif.org/research/CAWSES%20-%20Sunspots.pdf
and worked more on it here http://www.leif.org/research/AGU%20Spring%202007%20SH54B-02.pdf
pinning it down to Waldmeier here http://www.leif.org/research/De%20maculis%20in%20Sole%20observatis.pdf
by 2008 it was clear that the Group Sunspot Number was in trouble http://www.leif.org/research/Napa%20Solar%20Cycle%2024.pdf
by 2011 it was clear what was going on http://www.leif.org/research/History%20and%20Calibration%20of%20Sunspot%20Numbers.pdf
and since then the SSN calibration has been a main interest of mine.
Why is the inflation seemly becoming important (workshopped) starting in the second decade of the 21st century? Do you consider ~65 yrs later as a normal timing to address the inflation?
We got those workshops started because the evidence was beginning to be compelling enough that the solar community woke up. I don’t know about the 65 years delay. Some things just take time: http://www.poemhunter.com/poem/t-t-t/
Sidetrack Question for Leif => I am not being cynical (OK, maybe a little cynical) when I ask if a contributory factor in taking so long to address the ss inflation is the overemphasis by funding bodies on research myopically focusing on AGW by CO2 from fossil fuels? Has a bias toward AGW research funding caused reduced resources/ interest on solar research for things like ss inflation?
No, quite the contrary: a main obstacle is the so-called ‘skeptics’ who need the sun to vary much more than it does. To wit: some comments here.
jcarels says:
January 5, 2013 at 1:17 pm
Are there any plans to stop using the weighted count? Maybe another SIDC station could be the reference station?
I think it is mandatory that SIDC continues as it has done [for some time at least]. NOAA, BTW does not weight, so we do have two parallel counts. Part of the goal of the workshops is to figure what to do about this.
Berényi Péter says:
January 5, 2013 at 1:43 pm
Then we have the usual questions. Is this dataset digitized? Is it available online? Is it available at all?
The paper report is [freely] available, not yet in digital form. Unfortunately the record does not overlap with RGO so the calibration is ‘free-floating’ and we can only calibrate by comparing to other records, e.g. the sunspot number 🙂
Dr Leif
Thanks for all of the time you have spent on this post and the comments.
This may be considered OT, but the second draft of AR5 said:
“Many empirical relationships have been reported between GCR or cosmogenic isotope archives and some aspects of the climate system (e.g., Bond et al., 2001; Dengel et al., 2009; Ram and Stolz, 1999). The forcing from changes in total solar irradiance alone does not seem to account for these observations, implying the existence of an amplifying mechanism such as the hypothesized GCR-cloud link. We focus here on observed relationships between GCR and aerosol and cloud properties.”
Do you have a comment?
The size of sun spots varies hugely and difficult to take into account, so I have never been a fan of sun spot number. A better method would be to change to % surface area of the sun.
Methodology of counting sunspots may be important to specialists. However you count them, though, weak Solar cycles remain weak, and years with the low sunspot count remain as such — and correlate, more or less, with the lower temperatures on Earth.
The relevant question, therefore, is not how to count sunspots but what is the mechanism that links various characteristics of Solar activity to the temperature changes on Earth.
Don B says:
January 5, 2013 at 3:28 pm
We focus here on observed relationships between GCR and aerosol and cloud properties.”
Do you have a comment?
Check out my 217 comments on http://wattsupwiththat.com/2012/12/21/haigh-anxiety-a-psycho-comedy-of-errors/
Matt G says:
January 5, 2013 at 4:06 pm
The size of sun spots varies hugely and difficult to take into account, so I have never been a fan of sun spot number. A better method would be to change to % surface area of the sun.
The sunspot area and the sunspot number track each other very closely when averaged over a month. Check Figure 3.
And the area data only goes back to 1874 [and a few years around 1860], so does not give us the long perspective. Furthermore, the Greenwich data stops in 1975 and recent area determinations vary considerably between them.
Don B says:
January 5, 2013 at 3:28 pm
“an amplifying mechanism such as the hypothesized GCR-cloud link”
The typical tactic for arguing against GCRs affecting cloud trends is a depiction based on ISCCP data of Hansen’s GISS for 2004 onwards, but by then there was severe satellite orbit change skewing as noted in http://tinyurl.com/a8lhzz7 . Other data has cloud cover trends more related to cosmic ray trends, including in recent years, as in http://s7.postimage.org/69qd0llcr/intermediate.gif (enlarging on click), which fits with http://tinyurl.com/cozyte3 .
Alexander Feht says:
January 5, 2013 at 4:45 pm
Years ” with the low sunspot count remain as such — and correlate, more or less, with the lower temperatures on Earth.”
And the solar cycle (/ GCR variation) correlates substantially to the time pattern in atmospheric humidity, among other indicators, as illustrated in http://s7.postimage.org/69qd0llcr/intermediate.gif
While you were arguing, the solstice side of the sun has rotated to face us.. and she is a pocked little thing:)
Leif writes “A somewhat disturbing [to many people] consequence of the correction of the official sunspot number is that there is now no evidence for a Modern Grand Maximum [‘the largest in 8000 years’ or some such].”
You’ve said this many times but have you actually calculated the trend of the integrals of that corrected sunspot data? It does look like it could be increasing to me…
TimTheToolMan says:
January 5, 2013 at 7:25 pm
have you actually calculated the trend of the integrals of that corrected sunspot data? It does look like it could be increasing to me…
I was talking about the sunspot numbers. And the trend of the integral of positive numbers is always increasing…
I applied the 1.2 multiplier to the pre 1947 SSN data back to 1750 and just looking at the graph it does still appear that over the past 60 years, SC’s 17, 18, 19, 21, 22 and 23 have been high in amplitude by comparison to the last 350 years. There were a couple of brief periods that came close. Namely SC’s 2, 3 and 4 and then 8, 9, and 11. The peaks in the graph show that “the blow torch has been on” with greater intensity and consistency so to speak in the last 60 years. Joining the peaks up, there is also still a hint of a sine wave showing an approximate 100 year cycle. This pattern indicates a small SC25 and possibly SC26. I am not an expert in this field, just using historical data to produce a trend.
Leif writes “I was talking about the sunspot numbers. And the trend of the integral of positive numbers is always increasing…”
Then look at the rate of change of that. Or look at integrals per time slice and look at the trend from that. You know exactly what I mean but have avoided answering. I strongly suspect you’ll find that the number of sunspots along with time they’ve “hung around” has increased over time. At least thats what the eyeball method shows.
Sunspot says:
January 5, 2013 at 9:00 pm
The peaks in the graph show that “the blow torch has been on” with greater intensity and consistency so to speak in the last 60 years.
Cycles are different, no doubt about it; the question is if they are different enough to call the last 60 years a ‘Grand Maximum’. And it is clear that they are not. To use your trick of naming cycles may I point out that cycles 3, 4, 8, and 11 are all higher than all the cycles in the past 60 years, except 19.
This pattern indicates a small SC25 and possibly SC26.
Patterns cannot be used to predict future cycles.
TimTheToolMan says:
January 5, 2013 at 10:20 pm
I strongly suspect you’ll find that the number of sunspots along with time they’ve “hung around” has increased over time. At least thats what the eyeball method shows.
Yes, they have increased: from 53 the first half of the period to 60 the 2nd half. This is not a significant long-term trend. The Modern Grand Maximum proponents like an increase by a factor of 2. That is the difference.
Leif writes “The Modern Grand Maximum proponents like an increase by a factor of 2.”
I think a 10% increase over that period is enough to be interested in. Particularly when you factor in the additional and unknown variability of Visible vs UV.
Dear Leif,
Are you trying to say that all the 14C and 10Be reconstructions are nonsense?
What do your colleagues think about that?
And even if they don’t tell us anything about sunspot numbers what are they telling us?
Can there be no link to climate at all?
Regards
Ed (Europe)
Eddy says:
January 6, 2013 at 3:36 am
Are you trying to say that all the 14C and 10Be reconstructions are nonsense?
No, and they are actually consistent with my analysis. See Figure 2 of http://www.leif.org/research/Svalgaard_ISSI_Proposal_Base.pdf
Can there be no link to climate at all?
There is definitely a link, but a weak one.
TimTheToolMan says:
January 6, 2013 at 1:57 am
I think a 10% increase over that period is enough to be interested in.
Yes, that would give us a warming of 0.003 degrees.
Leif says “And some people have speculated that when there are no dark spots to cause dips in TSI, that TSI would be higher during a Grand Minimum.”
This is something we can observe pretty much every cycle, and TSI does not seem to rise when sunspot count equals zero. Are you saying the TSI would rise when comparing MM and current solar maximums, or comparing MM and current solar minimums?
Another question: You repeatedly discount all other potential climate variables (Cosmic Ray, UV, you name it) because you limit your argument to specific portions of the argument, in particular, GW from 1980-2000 (when those variables haven’t really changed on that time scale, until recently). Keeping in that time scale, what is your opinion of the PDO, AMO and both their impact on climate and the source of their variability. Do you think that the 1980-2000 portion of the AMO is unnatural? I think it’s pretty obvious you have to subtract the variability of the PDO/AMO (60yr cycle, non-detrended) before analyzing what’s left in the background, unless you either believe the solar signal is very large compared to the oceanic cycle, or the solar cycle itself drives the oceanic cycle.
ed says:
January 6, 2013 at 8:14 am
Leif says “And some people have speculated that when there are no dark spots to cause dips in TSI, that TSI would be higher during a Grand Minimum.”
This is something we can observe pretty much every cycle, and TSI does not seem to rise when sunspot count equals zero. Are you saying the TSI would rise when comparing MM and current solar maximums, or comparing MM and current solar minimums?
1st: I said it is speculation, 2nd: At minimum, dark sunspots and bright faculae disappear, 3rd: at maximum, bright faculae increase TSI more than dark sunspots decrease it [hence the solar cycle variation of TSI], 4th: if during a Grand Minimum period [where we know that the solar cycle is still going on because cosmic rays are modulated] there were only faculae at sunspot maxima, but no dark sunspots, TSI would be higher during those maxima compared to maxima with lots of dark spots [as we have during non-Grand-Minima conditions].
Another question: You repeatedly discount all other potential climate variables (Cosmic Ray, UV, you name it) because you limit your argument to specific portions of the argument
On the contrary, I reconstruct solar wind and UV back centuries and find that they also do not vary much. Sunspot Number, TSI, and all other ‘potential variables’ vary together.
the PDO, AMO and both their impact on climate and the source of their variability
I would say that PDO etc are climate and that their variations are very natural. I just don’t think the Sun is the major driver. But, this post has a more limited scope, namely to point out that the official sunspot number needs revision [and why] before one begins to speculate on possible solar effects. One thing at at time.
In looking at these graphs (the same image as these graphs ) I immediately come up with the question of “How come all the minima in the ‘before’ graph are shown with minima sky high and all over the place while the ‘after’ graph shows them with minima dragged down to the zero to ten range?”
If I look at the individual cycles (The graphs have been prepared by Jan Alvestad based on data from SIDC, Brussels.) I am not seeing the high minima depicted in your ‘before’ graph.
Cycles 1 – 20 and Solar cycles 21-24
If we take Solar Cycle 19 with a peak of 250 to use for fixing the scale in the before graph, then the whole scale is zero to 250 and six divisions gives a count of ~forty per division. The graph I point to for Solar Cycle 19 shows an average minimum count of five on one side and an average minimum count of 10 on the other not ~80 and ~ 40 as depicted on the ‘Before’ graph WUWT? Heck even the low vs high in the minimum count is reversed!
I am not a physicist but I like graphs and used them all the time in presentations. These two graphs make me shudder.
Gail Combs says:
January 6, 2013 at 8:49 am
In looking at these graphs (the same image as these graphs ) I immediately come up with the question of “How come all the minima in the ‘before’ graph are shown with minima sky high and all over the place while the ‘after’ graph shows them with minima dragged down to the zero to ten range?”
I could have shown the Group Sunspot Number instead, which would have been a more direct comparison. I chose to show a different graph to underscore the real problem [and to provoke comments and discussion like yours]. People that model TSI, UV, cosmic rays, etc [often for the purpose of showing solar influence on climate] employ the following ‘trick’: they compute a ‘background’ from the cycle average sunspot number [usually the Group Sunspot Number as it varies in a convenient way] and then add to that background the annual values based on the annual sunspot numbers [thus effectively double the variation]. With this trick, the Modern Grand Maximum looms really large and significant. The ‘background’ values, of course, make the minima a lot higher.
Slide 18 of http://www.leif.org/research/Solar-Petaluma–How%20Well%20Do%20We%20Know%20the%20SSN.pdf shows how this ‘works’.
These two graphs make me shudder
Make me shudder too
Gail Combs says:
January 6, 2013 at 8:49 am
In looking at these graphs (the same image as these graphs ) I immediately come up with the question of “How come all the minima in the ‘before’ graph are shown with minima sky high …
Slide 8 of http://www.leif.org/research/Solar-Petaluma–How%20Well%20Do%20We%20Know%20the%20SSN.pdf shows the Group Sunspot Number in the lower left [blue curve].
Perhaps if you study temperature data the late 20th century warming will go away as well…..)
“”Leif says “And some people have speculated that when there are no dark spots to cause dips in TSI, that TSI would be higher during a Grand Minimum.”
This is something we can observe pretty much every cycle, and TSI does not seem to rise when sunspot count equals zero. Are you saying the TSI would rise when comparing MM and current solar maximums, or comparing MM and current solar minimums?
1st: I said it is speculation, 2nd: At minimum, dark sunspots and bright faculae disappear, 3rd: at maximum, bright faculae increase TSI more than dark sunspots decrease it [hence the solar cycle variation of TSI], 4th: if during a Grand Minimum period [where we know that the solar cycle is still going on because cosmic rays are modulated] there were only faculae at sunspot maxima, but no dark sunspots, TSI would be higher during those maxima compared to maxima with lots of dark spots [as we have during non-Grand-Minima conditions]. “”
Is there data at present that shows that TSI is higher when there are faculae present with smaller dark spots? Seems like we should be detecting this since the L&P graph seems to be holding, or generate a scatter plot to see if there is correlation, and I would think there is enough variability between cycles to quantify this. Or is it just that our current PMOD/ACRIM composites are not of sufficient quality to quantify for the last three cycles?