Guest post by Dr. Leif Svalgaard
The official sunspot number is issued by SIDC in Brussels http://sidc.be/sunspot-data/ . The [relative] sunspot number was introduced by Rudolf Wolf http://en.wikipedia.org/wiki/Rudolf_Wolf in the middle of the 19th century. He called it the ‘relative’ number because it is rather like an index instead of the actual number of spots on the Sun. Spots occur in groups [which we today call ‘active regions’] and Wolf realized that the birth of a new group was a much more significant event than the emergence of just a single new spot within a group, so he designed his index, R, [for any given day] to be a weighted sum of the number of spots, S, and the number of groups, G, giving the groups a weight of 10: R = S + 10*G. The number of 10 was chosen because on average a group contains about 10 spots, and also because it is a convenient number to multiply by.

Later, Wolf introduced the so-called ‘k-factor’ to compensate for differences in the size of telescope, precise counting method, observer acuity, etc, in order to bring the relative sunspot number determined by another observer on to the same scale as Wolf’s: R = k (10*G + S), where k is 1 for Wolf himself using his ‘standard telescope’ [Figure 1a,b] and his rules [not counting the smallest spots] for counting spots. From the 1860s Wolf had to travel extensively and he used exclusively [for the rest of his life] a much smaller telescope [Figure 1c]. With a smaller telescope Wolf, obviously’ saw fewer spots [and groups!], so he used k = 1.5 to convert his counts to the scale of the standard telescope.
Wolf’s successor, Alfred Wolfer, thought [rightfully] that the rule of ‘not counting the smallest spots’ was too vague and advocated to count all spots and groups that could be seen. This, of course, made his count larger than Wolf’s, so based on overlapping counts during 1876-1893, determined that to place his [Wolfer’s] relative number on to the Wolf scale he should multiply by 0.6 [one could say that his k-factor was 0.6]. This conversion factor of 0.6 has been adopted by all [Zurich] observers ever since. Adopted, not measured, as Wolf is not around any more. SIDC adopts that same factor, thus striving to stay on the Zurich scale.
So far, so good. But at some point in the 1940s, the Zurich observers began to ‘weight’ sunspots according to size and complexity, such that large spots would not be counted just once [as Wolf and Wolfer did], but up to five times, i.e. given a weight of five. There is nothing wrong with that, if one then also adjusts the k-factor to reflect this new way of counting. The director of the Zurich observatory from 1945-1979, Max Waldmeier, may have thought [?] that the weighting was introduced a long time ago [he mentions ‘about 1882’] so that no change of k-factor would be needed. Waldmeier set up a station in Locarno in southern Switzerland [as the weather on the other side of the Alps is often complimentary to that in Zurich] to provide observations when it was cloudy in Zurich. The observers in Locarno [Sergio Cortesi began in 1957 and is still at it] were instructed to use the same weighting scale as Waldmeier in Zurich. Because SIDC to this day normalize all observations they collect from a network of 60-70 observers to the count from Locarno, the weighting scheme carries over unchanged to the modern sunspot number.
We know that Wolfer did not weight the spots [contrary to Waldmeier’s assertion], because Wolfer himself explicitly [in 1907] stated that each ‘spot is counted only once, regardless of size’, and also because Wolfer’s counts as late as in 1924 when compared to other observers’ simply show that single spots are counted only once no matter how large.
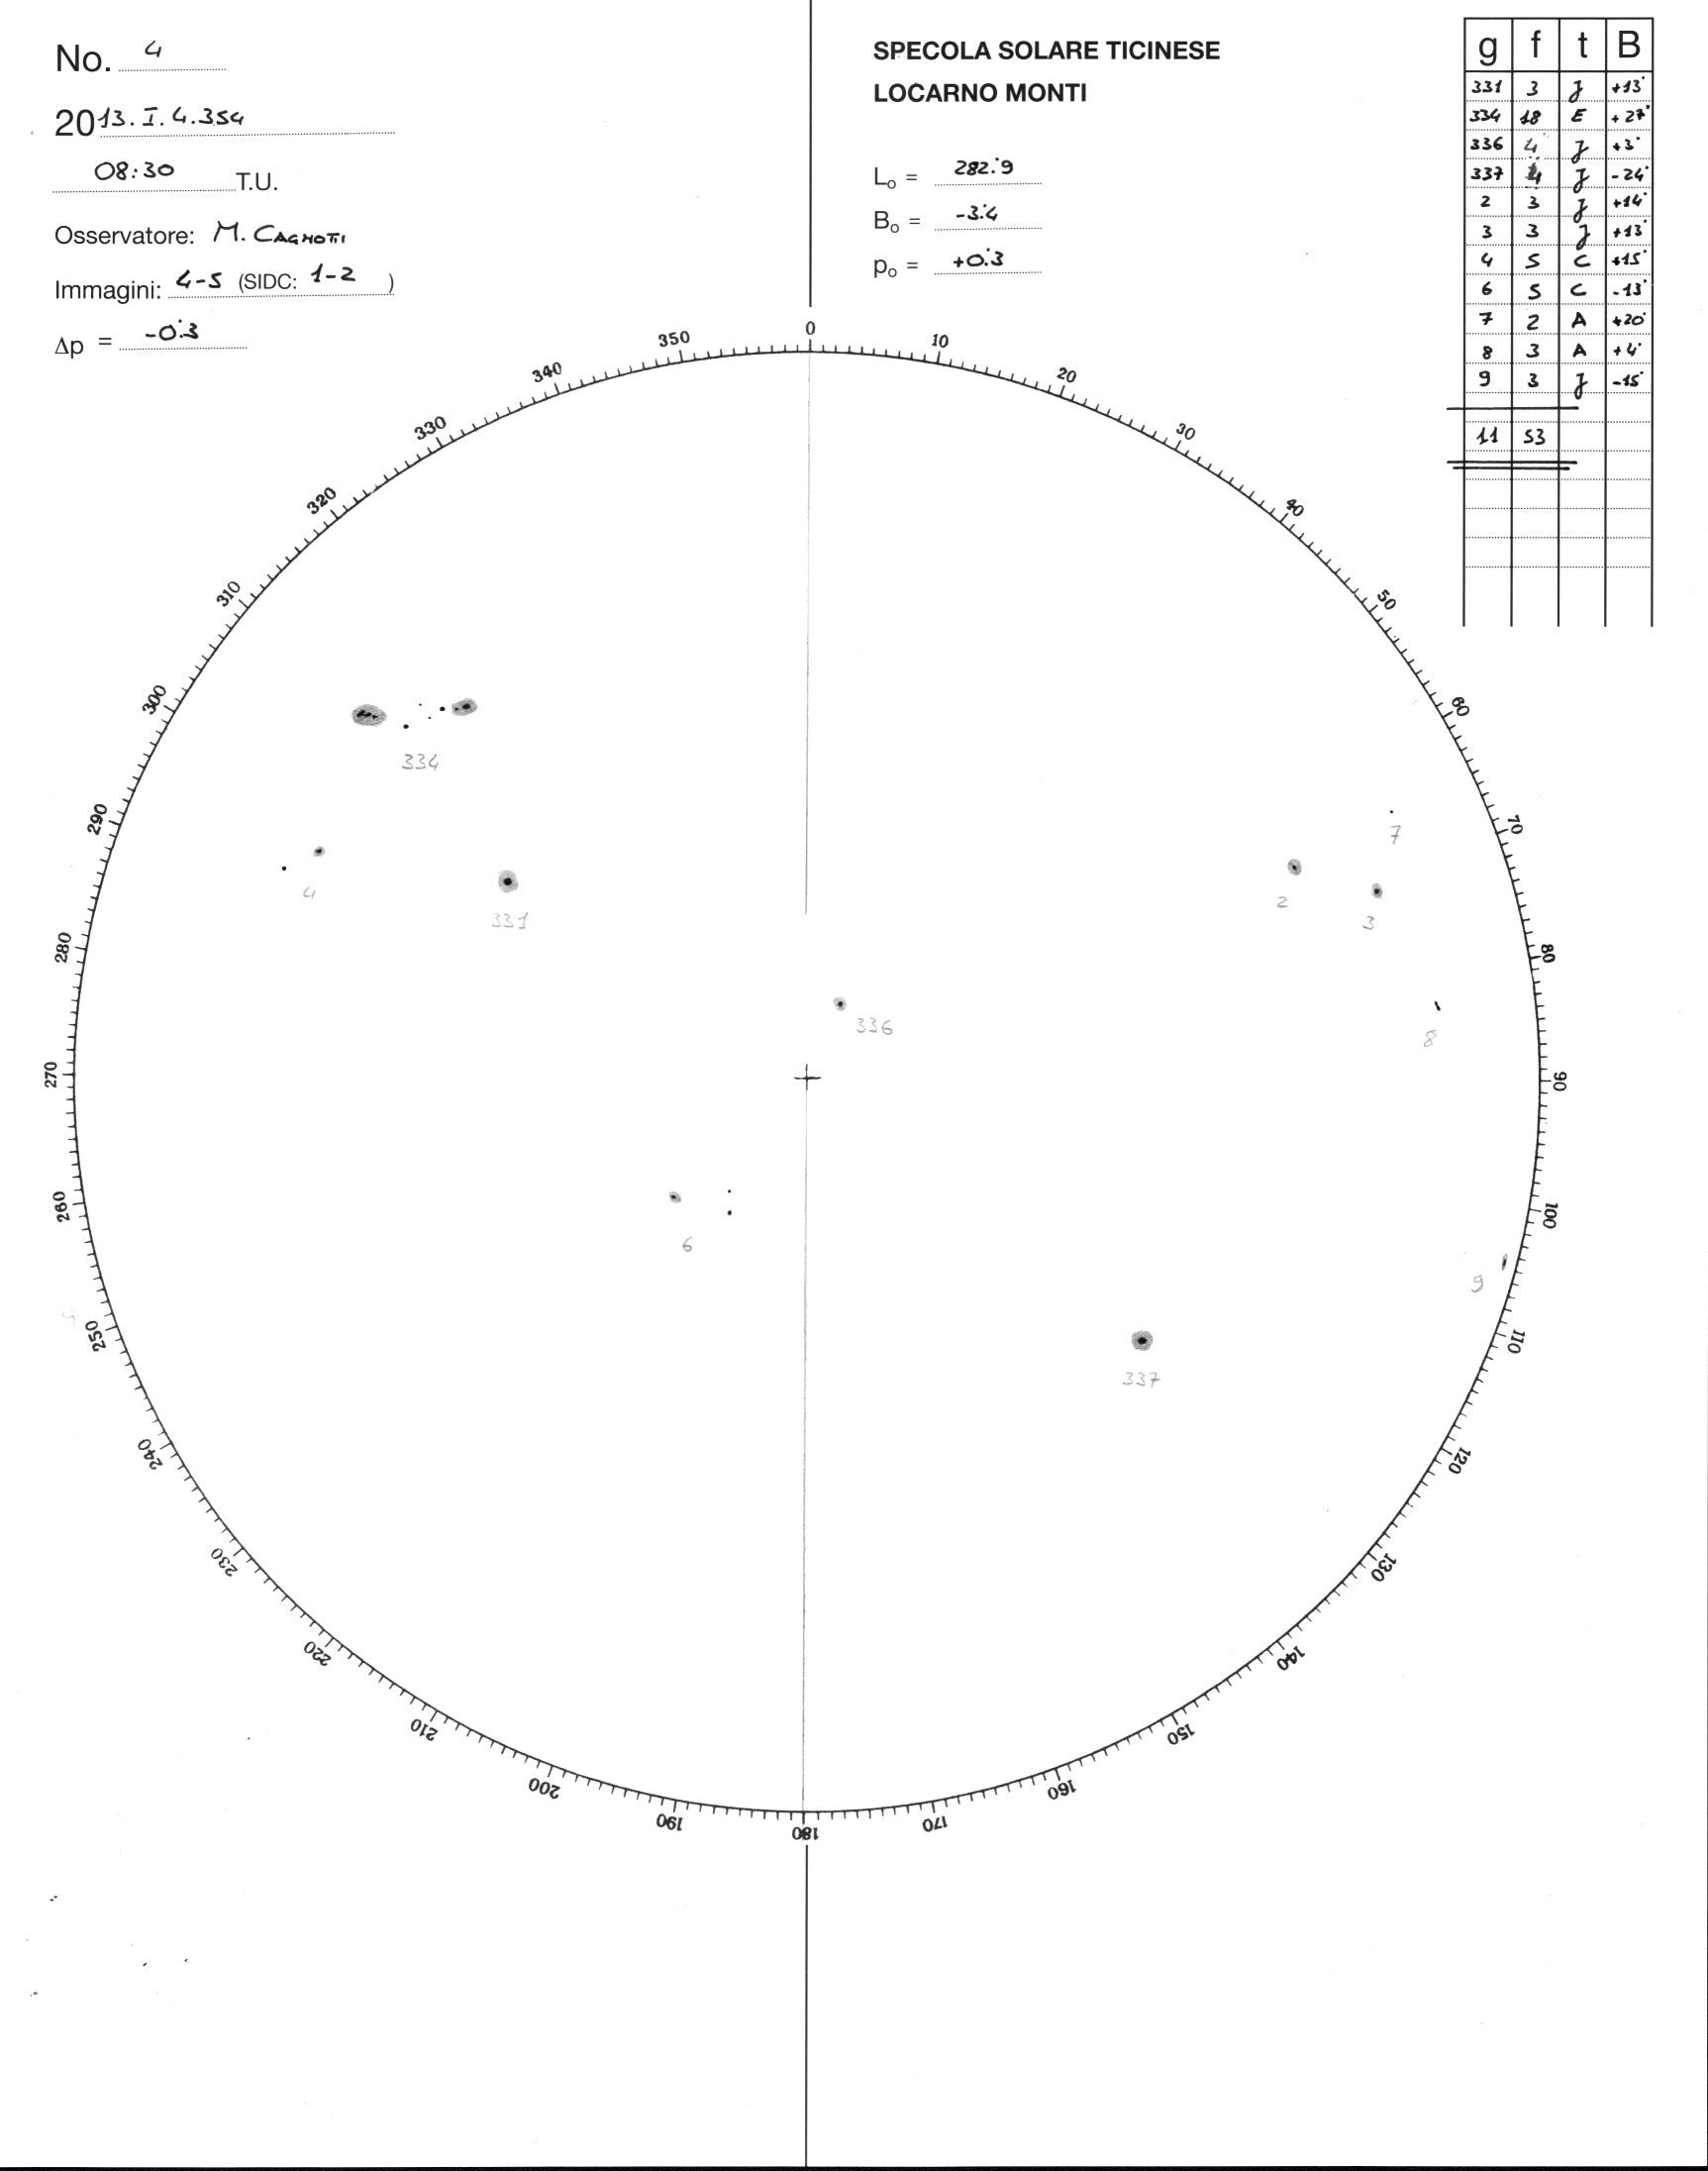
To get a feeling for how the weighting works, try to count the spots on the Locarno drawing for today http://www.specola.ch/drawings/2013/loc-d20130104.JPG and compare your counts with the values given for each numbered group in the little table at the upper right.
![loc-d20130104[1]](http://wattsupwiththat.files.wordpress.com/2013/01/loc-d201301041.jpg?quality=83)
(Note: I did this exercise, and found that my layman’s count was much lower than the “official” count, lending credence to Leif’s premise. Try it! – Anthony)
Marco Cagnotti’s [from Locarno] count is 11 groups and 53 ‘weighted’ spots. My count of the actual number of spots is 23. Try it for yourself. Your count may differ by about one from mine, but that does not change the fact that the weighted relative number 10*11+53=163 is about 23% larger than the ‘raw’, simple count of 10*11+23=133 that Wolfer and Wolf would have reported. For the whole of 2012 the ‘over count’ was 18%. So, it seems that the relative sunspot number suffered a 20% inflation because Waldmeier did not change his k-factor to compensate for the weighting.
Can we verify any of this? Well, one verification you can do yourself: just count the spots. But a better test is to ask the Locarno observers to report two numbers: the weighted count as usual and the unweighted count, where each spot is counted just once. Such a test has been [as is being] done. Figure 2 shows the effect of the weighting. Blue symbols show the official weighted count, and red symbols show Marco and my raw counts. The conclusion should be obvious.

The top panel of Figure 3 shows how well the sunspot number calculated from this formula matches that reporter by the Zurich observers.

Applying the same formula to data after 1945 gives us the lower panel. Under the assumption that the Sun did not know about Waldmeier we would expect the same relationship to hold, but in fact there is an abrupt change of the observed vs. the expected sunspot numbers between 1946 and 1947 of [you guessed it] 20%. Several other solar indicators give the same result. So there are several smoking guns.
What to do about this? One obvious thing would be to simply to remove the inflation [dividing the modern sunspot number by 1.20] and to stop weighting the spots. This turns out to be a bad idea, at least users of the sunspot numbers complain that they do not want to change the modern numbers as they are used in operational programs. The next-best thing is to adjust the old numbers before 1947 by multiplying them by 1.20. This is what we have decided to do [at least for now]. Who are ‘we’? You can see that here http://ssnworkshop.wikia.com/wiki/Home
There is a precedent for this [with the same ‘solution’]. In 1861 Wolf had published his first list of relative sunspot numbers, which he then updated every year after that. But about 1875 he realized that he had underestimated Schwabe’s counts [which formed the backbone of the list before Wolf’s own observations began in 1849]. Consequently, Wolf increased wholesale all the published sunspot numbers before 1849 by 25%. So we are in good company.
A somewhat disturbing [to many people] consequence of the correction of the official sunspot number is that there is now no evidence for a Modern Grand Maximum [‘the largest in 8000 years’ or some such].
NOTE: Figure 4 added 1/5/13 at Leif’s request

lsvalgaard says:
January 4, 2013 at 5:22 pm
“Indeed some cycles are higher than others. The point is that there are high cycles in every century and no long-term trend the past 300 years.”
If that’s your point, as you say, where in your post did you discuss or demonstrate the lack of a trend for the last 300 years?
davidmhoffer says: January 4, 2013 at 6:32 pm. I figured I’d put a red dot with a felt marker on the screen over every sun spot so I don’t count any twice. I checked twice, I was SURE is was dry erase….
Version 1. Let me through the crowd, I’m a chemist. Be very wary using anything on your list above isopropyl alcohol (rubbing alcohol). Use a cloth made for the purpose, computer stores sell them. It it does not work, get a new monitor or go to 2.
Version 2. Let me through the crowd, I’m a skeptic. Get into the file storage section of your monitor program and create artificial values for each red spot, with an interpolation program to infill from surrounding pixels from each succesive image. The basics are in good quality digital cameras to overcome mosaicking and aliasing and pixel drop-outs.
This is the way that proper adjustment proceeds.
(Poorly)
The second SC24 peak may be on the way
http://sdo.gsfc.nasa.gov/assets/img/latest/latest_1024_4500.jpg
‘SIDC count’ for 5th Jan is SSN ~81
It seems to me the grandness in any modern maximum would lie in the not-so-grandness of all those grand minima, if centennially recurrent.
Even with the adjustments, the Maunder and Dalton minima still look like minima, 1959 looks like one heck of a peak, and the current lull still looks like a lull.
Actually, (if you can bypass the stuff about the influence of Neptune,) it seems the “Layman’s Count” has been making this adjustment for some time.
E.M.Smith says:
January 4, 2013 at 6:38 pm
I have to second the notion that if they have photos, a ‘recalibration’ from the original material ought to be possible / done. ( IF they trashed the negatives then “Oh Well”…)
When I learned lab work, we had a notebook in which ALL data and work were recorded. It was forbidden (got you an automatic “F” Fail grade) to have ANY erasure….
>>>>>>>>>>>>>>>>>>>>>>>>
That is what I learned too. Only in my case the FDA would come calling if you used a different method. Our notebooks all had to be signed and dated at the end of the day by us and witnessed by a second person too then placed in the archives when filled.
I sure hope they are keeping track of all the information. using ‘weighing factors’ makes me a bit nervous. Better to dump them into two pots and have a count for apples and another for bananas so you do not lose data that may have meaning down the road.
From what I can see, by trying to get ‘fancy’ with counting methods the data is now mucked up.
davidmhoffer says:
January 4, 2013 at 9:50 pm
Uhm….what makes it right? […] But if there was never a physical basis for defining the system in the first place, why would you expect them to match?
Because the sunspot number empirically turns out to be a good proxy for ‘solar activity’. And there is a physical basis: each spot carries a magnetic field, 100 spots carries 100 times as much field as the average spot, so the sunspot number is a good approximation to the total magnetic field. That said, there is an indication [the Livingston and Penn effect] that this physical relation may not always work. From the UV flux from the Sun, it seems that the L&P effect did not operate 1722-1995. What is happening since may be a repeat of what happened before [the Maunder Minimum].
u.k.(us) says:
January 4, 2013 at 10:10 pm
Projection, upon the audience. Nice.
Indeed, and correctly so.
johnnythelowery says:
January 4, 2013 at 10:17 pm
I am surprised Greenwich had weather clear enough for someone to see the sun and take a picture ‘every day’.
Supplemented by photographs taken at Kodaikanal in India and other places. That is why ‘every’ was in quotes.
What does it mean, to you, that there was no Grand Maximum? What does this tell us, in the context of Climate on earth? AGW? TSI?
It tells me that if people use the sunspot number [which they do] as a basis for reconstructing TSI and correlating with climate, that they will get things wrong [which they do].
Thx Leif… Does this mean you are conceding the electric universe idea then ….hahahahah!!!!
No, the E-U is nonsense.
When is your friend going to publish his findings on decay anomaly/Sun rotation theory?
If you mean Peter Sturrock, then I think he has published something on that.
Rhys Jaggar says:
January 4, 2013 at 10:36 pm
Is it the solar wind modulations affecting entry of cosmic rays into the earth’s atmosphere? Is it the non-random mixing of oceans leading to altered sea surface temperatures?
There is no good evidence that cosmic rays have anything to do with climate or weather.
It has been claimed that large planet-solar interactions can provide a possible explanation for centennial- and Gleissberg cycles. Has the physics of that been worked out yet or has it been comprehensively debunked as a theory??
There has been some attempts, but none are convincing as the forces involved are much too small. Since there are [many] other stars with large planets, one test of the hypothesis would be to see if those stars show magnetic activity synchronized with the revolution of their planets. None have been found.
JJ says:
January 5, 2013 at 12:11 am
By how many different combinations of instrumentations and index methodologies? And what were they?
There are more than 500 observers with all kinds of instruments and methods producing more than a million observations in total. So don’t expect a short comment to do justice to their effort.
Clearly, Wolf himself was not comfortable applying his invented index methodology to the information from prior to “about 1700″, so claiming 400 years is not legitimate.
Hoyt and Schatten and Eddy found more data from before 1700, so we do have observations back to 1610. ‘Legitimate’? We work with what we have.
WRT Wolf’s methodology and its derivatives, what is the criterion for the demarcation of a group?
Basically the proximity of the spots to each other, but also their evolution which clearly shows that the spots in a group are related. But, it is a legit problem because people could [and do] disagree about the details. The k-factor to a large extent compensates for that.
Rather with the notion that a single k-factor is necessarily sufficient to translate from one such index to another. It is not.
Experience shows that it is. If you plot one observer’s count vs. another one’s, you get a straight line going through the origin. The constant slope is the k-factor. This works.
You can’t back out multiple factors
See above.
At any rate, rejiggering the data to conform to a particular invented index methodology (even if done with the mathematical rigor not contained in a single k-factor) cannot say anything whatsoever about the existence of a “Grand Solar Maximum”.
Yet, the same data was used to define the Grand Maximum.
All such indexes are invented and arbitrary.
They are useful as they relate to the actual physics.
Out of curiosity, when you guys do sunspot area, what method do you use to account for spherical geometry?
There are two ways to deal with that: 1) correct for projection and report the actual area of the hemisphere, and 2) report the area of the observed [and foreshortened] area as a fraction of the visible solar disk. Both have a use. The 1st is related to what the Sun does, the 2nd to what the effect might be on the Earth. For a monthly or yearly average the difference does not matter as the areas by the two different methods are simply linearly related [experience shows].
alex says:
January 5, 2013 at 12:20 am
Sorry, who cares about the “sunspot number”? …
We have to measure the cosmic ray intensity that is a much directer proxy.
Apart from the fact that we do not have such reliable measurements before the 1950s.
Richard111 says:
January 5, 2013 at 12:51 am
Okay. I’m lost. So which method of counting sunspots REALLY controls our climate?
The sunspot cycle controls only a very small part of our climate, so the precise method is not so important.
SandyInLimousin says:
January 5, 2013 at 1:27 am
Only history will show what was pseudo-science and what was true-science
Well, most pseudo-science is nonsense on its face. And the examples you mentioned were never pseudo-science to begin with.
Steve C says:
January 5, 2013 at 1:45 am
I wonder whether this won’t introduce its own problems as the Livingston and Penn effect
The L&P effect is a whole new aspect and if real [which I think it is] will lead to better understanding of solar activity. E.g. of the process that compacts the magnetic field to make a visible spot.
Chris Schoneveld says:
January 5, 2013 at 2:12 am
If that’s your point, as you say, where in your post did you discuss or demonstrate the lack of a trend for the last 300 years?
Good point. I’ll add a graph of the data over that period.
Soren F says:
January 5, 2013 at 4:21 am
It seems to me the grandness in any modern maximum would lie in the not-so-grandness of all those grand minima, if centennially recurrent.
There is a certain semantic distinction here. Maxima recur, but only the ones that ‘tower’ over the other ones should be called ‘Grand’.
Caleb says:
January 5, 2013 at 5:03 am
Actually, (if you can bypass the stuff about the influence of Neptune,) it seems the “Layman’s Count” has been making this adjustment for some time.
The ‘Layman’s Count’ does not have a meaningful calibration and IMHO is simply junk [with the purpose of producing a count that supports the author’s ideas].
John West says:
January 4, 2013 at 7:31 pm
@ur momisugly E. M. Smith
Yes, we still cross out, initial, and annotate except now it’s likely to be electronic, but not always (there’s still some archaic regulations that require actual notebooks).
>>>>>>>>>>>>>>>>>>>>>>>>>>>
Actual notebooks are required for a darn good reason.
1. You can not ‘fudge’ the data later especvially if they are signed data and wittnessed. The written notebook will also stand up in court in fights over patents or lawsuits.
2. Notebooks are PERMANENT especially if they are archival paper. Think of how many kids born around this time who will have NO Photographs of their childhood. My neighbors lost all their pictures when their computer burped and there went all the babyhood pictures.
3. Oak Ridge laboratory had their computer hacked in 2011. The Oak Ridge National Laboratory was forced to disconnect internet access for workers on Friday after the federal facility was hacked, and administrators discovered data being siphoned from a server. and China-Based Hacking of 760 Companies Shows Cyber Cold War
China and Russia want the technology and they want the patents but they do not want to pay royalties. U.S. intelligence report blamed Russia and China for hacking into private computer networks, likely seeking patent and technology information.
What rather amazes me is the detail and sophistication of the early observers using only primitive equipment.
So no recent Grand Maximum but instead a series of multi cycle maxima since the Maunder with a few dips along the way each of which seems to coincide with a cooling scenario give or take 60 years due to interference from the Pacific Multidecadal Oscillation.
And now a dip to Dalton and maybe Maunder levels.
And increasing numbers of observations and papers suggesting that something about solar variations does affect global air circulation patterns.
Add all that to paleo data based on various isotopes and the climate link still seems to be intact despite Leif’s work.
Maybe this is the place to ask this question. Today there are 12 sunspot groups, but the report notes that after a long time, there has finally been a 1.7 M class solar flare. Is it unusual to have so many sunspot groups, and so little in the way of solar flares?
E.M.Smith says: @ur momisugly January 4, 2013 at 6:38 pm
I have to second the notion that if they have photos, a ‘recalibration’ from the original material ought to be possible / done. ( IF they trashed the negatives then “Oh Well”…)
This is being done, but only gets us back to 1874. And the RGO photographs don’t have a constant ‘calibration’ themselves so don’t really help much. But were good enough to show the discontinuity in 1946.
…………………………………………….
lsvalgaard replies: @ur momisugly January 4, 2013 at 7:44 pm
It is sad to say, but it seems that Waldmeier destroyed or ‘disappeared’ all the archives from observatory. I have been there to check and the material is gone.
……………………………………………
Waldmeier was director until 1979 and was a professor until 1982. He had a stroke in 1985 and died in September of 2000.
Why is the issue of the missing observatory archives coming up now instead of in 1980? There was a five year window in which pointy little questions should have been asked. We are not in the medieval period dealing with secretive Alchemists are we?
The information on the internet on Waldmeier indicates he did have something of the character of a secretive Alchemist. The man may have been brilliant but he was a poor scientist and a worse director.
Chris Schoneveld says:
January 5, 2013 at 2:12 am
If that’s your point, as you say, where in your post did you discuss or demonstrate the lack of a trend for the last 300 years?
Good point. I have added a graph of the data over that period. The left panel of Figure 4 shows how the MGM has been portrayed by various people. The right panel shows the corrected Wolf sunspot number. As I have explained, there are maxima and minima, but none that towers over the rest like in the left panel.
Gail Combs says: January 5, 2013 at 5:52 am
…..computer burped and there went all the babyhood pictures.
I use a portable (pocket size) USB 500GB hard drive, where I back up all of my work and all the snaps from 4 digital cameras in use by rest of my family. Now I have to get another one. Selection of the more important photos are occasionally burned onto CDs.
Rhys Jagger says:
It has been claimed that large planet-solar interactions can provide a possible explanation for centennial- and Gleissberg cycles. Has the physics of that been worked out yet or has it been comprehensively debunked as a theory??
Dr. S replies:
There has been some attempts, but none are convincing as the forces involved are much too small. Since there are [many] other stars with large planets, one test of the hypothesis would be to see if those stars show magnetic activity synchronized with the revolution of their planets. None have been found.
http://libra.msra.cn/Publication/27702964/hot-jupiters-and-stellar-magnetic-activity
??
Jim Cripwell says:
January 5, 2013 at 6:28 am
Is it unusual to have so many sunspot groups, and so little in the way of solar flares?
The groups are simple, many of them with only one spot. Flares occur in complex groups with many interacting spots. The lack of complex groups without many small spots in them may be a symptom of the Livingston & Penn effect, that has to do with losing the small spots.
rstritmatter says:
January 5, 2013 at 6:54 am
“if those stars show magnetic activity synchronized with the revolution of their planets. None have been found”
http://libra.msra.cn/Publication/27702964/hot-jupiters-and-stellar-magnetic-activity
??
A distinction has to be made between planets so close to their star that they are within the ‘magnetosphere’ of the star as is the case with the stars in that paper and planets in the stellar wind further out [as the Sun’s planets]. In the case of planets within the magnetosphere, the planets cause ‘aurorae’ on the star. An analog is Jupiter’s moon Io that does the same. This is very distinct from the claim that the planets [by way of tides and the like] modulate the stellar cycles that originate deep within the stars [as sunspots do]. I should perhaps have been more specific about that. See slide 19 of http://www.leif.org/research/AGU%20Fall%202011%20SH34B-08.pdf
Gail Combs says:
January 5, 2013 at 6:37 am
Why is the issue of the missing observatory archives coming up now instead of in 1980? There was a five year window in which pointy little questions should have been asked. We are not in the medieval period dealing with secretive Alchemists are we?
I have asked the same question, and the answer was that ‘all material has been transferred to SIDC’. However, when you go look, there is nothing. I have not given up yet, but so far the search has come up blank. All data after 1937 [when Waldmeier became assistant observer] is missing.
The information on the internet on Waldmeier indicates he did have something of the character of a secretive Alchemist. The man may have been brilliant but he was a poor scientist and a worse director.
In many respects Waldmeier was a very good scientist, but as all humans had flaws. One was his secretiveness.
davidmhoffer says:
January 4, 2013 at 9:08 pm
….Uhm, hold on, I be a bit confused. Am I to understand that the entire system is predicated on an artificial math construct that started out as a judgment call?
>>>>>>>>>>>>>>>>>>>>>>>>
You might want to read Dr. David H. Hathaway’s paper The Solar Cycle
rstritmatter says:
January 5, 2013 at 6:54 am
“if those stars show magnetic activity synchronized with the revolution of their planets. None have been found” ??
Once the planet is outside the ‘magnetosphere’ there is no effect:
http://onlinelibrary.wiley.com/doi/10.1111/j.1365-2966.2010.16715.x/abstract
“HD 189733 is a K2 dwarf, orbited by a giant planet at 8.8 stellar radii. In order to study magnetospheric interactions between the star and the planet, we explore the large-scale magnetic field and activity of the host star…. The study of the stellar activity shows that it is modulated mainly by the stellar rotation (rather than by the orbital period or the beat period between the stellar rotation and the orbital periods). We report no clear evidence of magnetospheric interactions between the star and the planet.
lsvalgaard says:
January 4, 2013 at 9:38 pm
Yes, but also backed up by extensive observations, and time has proven that Wolf made the right choices. Lucky, perhaps. But it is always better to be lucky than merely to be right.
>>>>>>>>>>>>>>>>>>>>>>>
perhaps not just luck…
@lsvalgaard: Thanks for the additional graph, which makes your final point much clearer. Question, though: what is displayed in the left-hand graph? If sunspot numbers, why are yours so dramatically different in the first cycle or two? (Or is the bottom of the unlabeled Y-axis in the left-hand graph not zero?)
@ur momisugly Dr. Leif Svalgaard
First, thank you for spending time with us.
Per your suggestion I dropped the sunspot numbers from SIDC into excel, X1.2 pre-1947, and plotted an running 11 yr average.
IF (your input requested) the sunspot numbers from say 1650 to 1700 that I’ve seen are close to “right” being next to if not nil, nada, zilch …..
Then a fourth order polynomial fit to the plot above shows a pattern quite in line with Alec Rawls hypothesis, in other words, a “Grand Maxima” is not required considering the 1600’s Grand Minima (if true).
In the added figure 4 can someone explain to me what is plotted in the graph on the left. Is it sunspot number (SSN) or some other measure of solar activity? It looks as though it is some other proxy for solar activity (?) but if it is SSN then why are the minima (which all are very close to zero in the plot on the right) not plotting close to zero on that on the left. They should since the correction k factors that Leif has outlined are linear multipliers.