Guest post by Dr. Leif Svalgaard
The official sunspot number is issued by SIDC in Brussels http://sidc.be/sunspot-data/ . The [relative] sunspot number was introduced by Rudolf Wolf http://en.wikipedia.org/wiki/Rudolf_Wolf in the middle of the 19th century. He called it the ‘relative’ number because it is rather like an index instead of the actual number of spots on the Sun. Spots occur in groups [which we today call ‘active regions’] and Wolf realized that the birth of a new group was a much more significant event than the emergence of just a single new spot within a group, so he designed his index, R, [for any given day] to be a weighted sum of the number of spots, S, and the number of groups, G, giving the groups a weight of 10: R = S + 10*G. The number of 10 was chosen because on average a group contains about 10 spots, and also because it is a convenient number to multiply by.

Later, Wolf introduced the so-called ‘k-factor’ to compensate for differences in the size of telescope, precise counting method, observer acuity, etc, in order to bring the relative sunspot number determined by another observer on to the same scale as Wolf’s: R = k (10*G + S), where k is 1 for Wolf himself using his ‘standard telescope’ [Figure 1a,b] and his rules [not counting the smallest spots] for counting spots. From the 1860s Wolf had to travel extensively and he used exclusively [for the rest of his life] a much smaller telescope [Figure 1c]. With a smaller telescope Wolf, obviously’ saw fewer spots [and groups!], so he used k = 1.5 to convert his counts to the scale of the standard telescope.
Wolf’s successor, Alfred Wolfer, thought [rightfully] that the rule of ‘not counting the smallest spots’ was too vague and advocated to count all spots and groups that could be seen. This, of course, made his count larger than Wolf’s, so based on overlapping counts during 1876-1893, determined that to place his [Wolfer’s] relative number on to the Wolf scale he should multiply by 0.6 [one could say that his k-factor was 0.6]. This conversion factor of 0.6 has been adopted by all [Zurich] observers ever since. Adopted, not measured, as Wolf is not around any more. SIDC adopts that same factor, thus striving to stay on the Zurich scale.
So far, so good. But at some point in the 1940s, the Zurich observers began to ‘weight’ sunspots according to size and complexity, such that large spots would not be counted just once [as Wolf and Wolfer did], but up to five times, i.e. given a weight of five. There is nothing wrong with that, if one then also adjusts the k-factor to reflect this new way of counting. The director of the Zurich observatory from 1945-1979, Max Waldmeier, may have thought [?] that the weighting was introduced a long time ago [he mentions ‘about 1882’] so that no change of k-factor would be needed. Waldmeier set up a station in Locarno in southern Switzerland [as the weather on the other side of the Alps is often complimentary to that in Zurich] to provide observations when it was cloudy in Zurich. The observers in Locarno [Sergio Cortesi began in 1957 and is still at it] were instructed to use the same weighting scale as Waldmeier in Zurich. Because SIDC to this day normalize all observations they collect from a network of 60-70 observers to the count from Locarno, the weighting scheme carries over unchanged to the modern sunspot number.
We know that Wolfer did not weight the spots [contrary to Waldmeier’s assertion], because Wolfer himself explicitly [in 1907] stated that each ‘spot is counted only once, regardless of size’, and also because Wolfer’s counts as late as in 1924 when compared to other observers’ simply show that single spots are counted only once no matter how large.
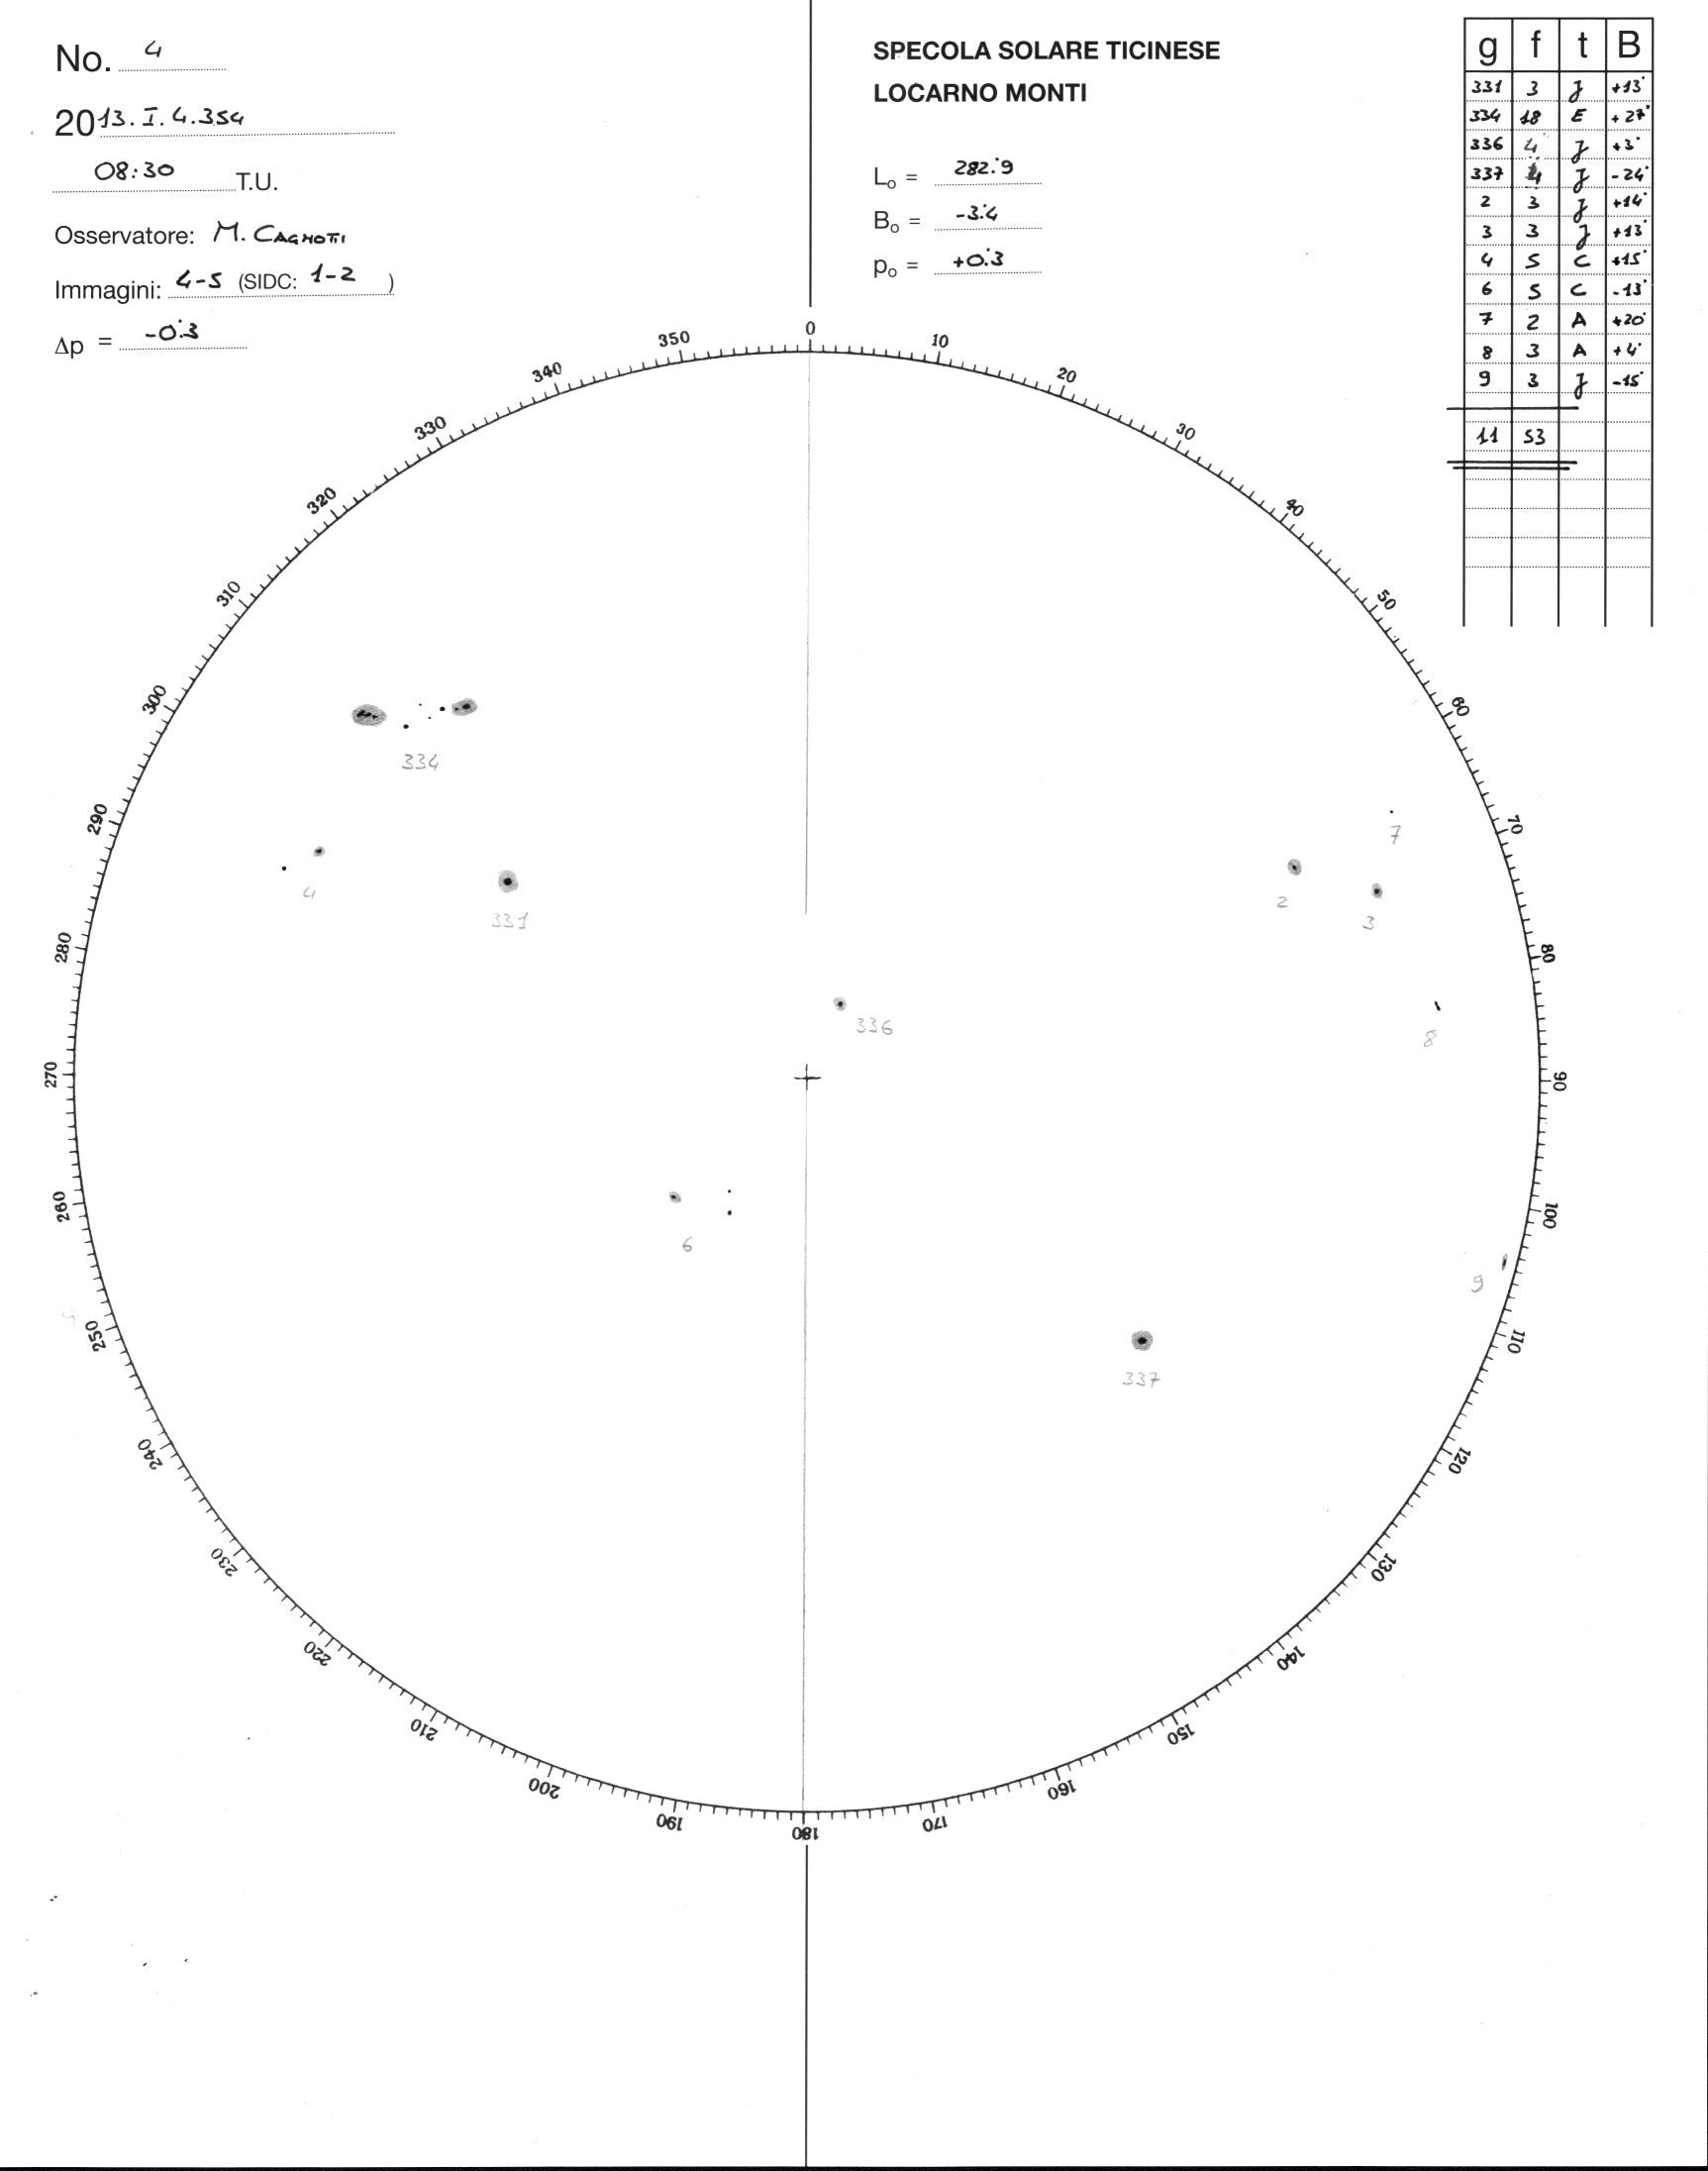
To get a feeling for how the weighting works, try to count the spots on the Locarno drawing for today http://www.specola.ch/drawings/2013/loc-d20130104.JPG and compare your counts with the values given for each numbered group in the little table at the upper right.
![loc-d20130104[1]](http://wattsupwiththat.files.wordpress.com/2013/01/loc-d201301041.jpg?quality=83)
(Note: I did this exercise, and found that my layman’s count was much lower than the “official” count, lending credence to Leif’s premise. Try it! – Anthony)
Marco Cagnotti’s [from Locarno] count is 11 groups and 53 ‘weighted’ spots. My count of the actual number of spots is 23. Try it for yourself. Your count may differ by about one from mine, but that does not change the fact that the weighted relative number 10*11+53=163 is about 23% larger than the ‘raw’, simple count of 10*11+23=133 that Wolfer and Wolf would have reported. For the whole of 2012 the ‘over count’ was 18%. So, it seems that the relative sunspot number suffered a 20% inflation because Waldmeier did not change his k-factor to compensate for the weighting.
Can we verify any of this? Well, one verification you can do yourself: just count the spots. But a better test is to ask the Locarno observers to report two numbers: the weighted count as usual and the unweighted count, where each spot is counted just once. Such a test has been [as is being] done. Figure 2 shows the effect of the weighting. Blue symbols show the official weighted count, and red symbols show Marco and my raw counts. The conclusion should be obvious.

The top panel of Figure 3 shows how well the sunspot number calculated from this formula matches that reporter by the Zurich observers.

Applying the same formula to data after 1945 gives us the lower panel. Under the assumption that the Sun did not know about Waldmeier we would expect the same relationship to hold, but in fact there is an abrupt change of the observed vs. the expected sunspot numbers between 1946 and 1947 of [you guessed it] 20%. Several other solar indicators give the same result. So there are several smoking guns.
What to do about this? One obvious thing would be to simply to remove the inflation [dividing the modern sunspot number by 1.20] and to stop weighting the spots. This turns out to be a bad idea, at least users of the sunspot numbers complain that they do not want to change the modern numbers as they are used in operational programs. The next-best thing is to adjust the old numbers before 1947 by multiplying them by 1.20. This is what we have decided to do [at least for now]. Who are ‘we’? You can see that here http://ssnworkshop.wikia.com/wiki/Home
There is a precedent for this [with the same ‘solution’]. In 1861 Wolf had published his first list of relative sunspot numbers, which he then updated every year after that. But about 1875 he realized that he had underestimated Schwabe’s counts [which formed the backbone of the list before Wolf’s own observations began in 1849]. Consequently, Wolf increased wholesale all the published sunspot numbers before 1849 by 25%. So we are in good company.
A somewhat disturbing [to many people] consequence of the correction of the official sunspot number is that there is now no evidence for a Modern Grand Maximum [‘the largest in 8000 years’ or some such].
NOTE: Figure 4 added 1/5/13 at Leif’s request

TomRude says:
January 4, 2013 at 5:07 pm
Is this spurious or the reality?
The red curve [upper right] on slide 7 of
http://www.leif.org/research/The%20long-term%20variation%20of%20solar%20activity.pdf
shows the series since 1700. The 20th century does not any longer qualify as a ‘Grand Maximum’
[at least I would not call it that, perhaps you would cling to the notion that it is?].
Big D in TX says:
January 4, 2013 at 4:02 pm
“A somewhat disturbing [to many people] consequence of the correction of the official sunspot number is that there is now no evidence for a Modern Grand Maximum [‘the largest in 8000 years’ or some such].”
What does that mean?
Rather, what are the implications of that statement? (The consequences of not having had a Modern Grand Maximum.)
I am aware I may be showing some ignorance here; humor me, please.
No need to worry ,Big D. That’s what a lot of us guys/gals come here for…..to learn. You can teach to ignorance ,stupidity is terminal.
And BTW…..had the same myself….you just beat me to it :):)
Since Wolf started his observation in the middle of the 19 century and that “At the Royal Greenwich Observatory photographs of the Sun have been taken ‘every’ day since 1874 until they stopped in 1975. From these photographs the RGO determined the area of all sunspots for every day”, we are only talking about 25 years of observation –roughly two solar cycles- at most that are litigious, i.e. without any other objective source of information such as photographs than Wolf’s. Would it be so difficult to recount the data once for all, introduce an uncertainty factor for the earliest two cycles observed by Wolf and, publish two reference datasets: the raw count and with today’s benefit of understanding solar physics and processes, offer an acceptable weighting for clusters versus spots if need be in a second dataset?
Also, in one comment, the author writes “Indeed some cycles are higher than others. The point is that there are high cycles in every century and no long-term trend the past 300 years”… Since sun spot counts was introduced by Wolf “in the middle of the 19th century”, it will only be 200 years of sun spot counting by 2050. What other dataset is used for the remaining 100 years of so of this trend, or absence of thereof?
IanH
‘Leif is a true scientist. He doesn’t make extravagant claims about things he doesn’t know. He makes conservative statements about things he is sure about. He openly states the limits of his knowledge, and if challenged can explain absolutely everything he does in as much detail as his audience can comprehend. He never appeals to authority or talks down to people. He doesn’t need to do that. He just knows more about sunspots than just about anyone else in the world. That what a scientist should be like and indeed what most scientists are like. ‘
+10 (on a scale of 1 to 10)
Why is it that every single data series has to be tampered with?
Perhaps it’s worth remembering that our host, Anthony Watts, is involved in a project that may “tamper” with a data series. His assessment of the changing standards of weather surface stations with time (I hope that’s a close description) might result in a re-examination and adjustment of the temperature record towards accuracy.
This is generally regarded around these parts as a good thing. Yet some dismiss Dr Svalgaard’s project as “sunspot fiddling”. Very unfair and not conducive to clear thinking.
If scientific records have become distorted for any reason, we need to know and should welcome any properly conducted studies that reveal and correct the distortions.
Thank you. As usual, very in formative..
This is what drives me crazy, start with an inexact system and proceed to twist it this way and that to suit whatever the current think wants it to be. I understand the desire to have a continuous record but in the many adjustments, one improper figure throws the whole thing off. Your system also assumes, that is a recipe for failure.
Considering that the Holocene has been underway for quite some time now I suspect that a 300 year record matters very little in the full scope of the suns life or cycles. Your “hasn’t changed in the last three hundred year” line.. is averaging?? Because if not you seem to be ignoring times when the sun has been active and inactive in our current times and recent past and if we have seen anything clearly, its that when the sun gets quieter for some reason it gets colder, and pretty darn quickly…. until you can explain this phenomenon keep at that drawing board because you are missing something EXTREMELY fundamental in the process.
@ur momisugly Dr. Leif Svalgaard
Is there a place we can get raw sunspot data back to as close to 1600 as possible, numbers that you would consider “good”?
Please do not put words in my mouth. I was just asking and, just like Mobihci or Keith DeHavelle noticing the intensity of these 20C cycles, still stronger -according to properly accounted for sun spot counts- than 19C cycles. If not MGM why not Paramount for a naming?
BTW given these observed sun variations and the relatively short period of direct observation compared to let’s say the last glacial/interglacial time frame, what magnitude of variation would make you consider some direct control on Earth climate a possibility? In other words, for instance cycle 20 versus 21: top 140 spots versus top 80 spots, that is quite a serious variation – 43% in one cycle. Meteorologically the climatic shift of the 1970s is well documented -including in atmospheric pressure series all over the globe. Yet, we did not go to widespread glaciation, suggesting either buffering or a tamed role.
Great read!
Thanks
i have learned a supplemental lesson with respect to the exercise of counting sun spots on a white background above. Ensure the monitor is properly cleaned prior to counting 🙂
@John West, File 1520 at his http://www.leif.org/research/?
AAAAAAAAAAAAAAAARGH!
I figured I’d put a red dot with a felt marker on the screen over every sun spot so I don’t count any twice. I checked twice, I was SURE is was dry erase….
[Reply: Hopefully a /humor;> but if not: Try increasing strength of solvents starting with water, then soap and water, then rubbing alcohol, then acetone (nail polish remover), then ‘organic solvent’ (hexane, gasoline). Hopefully it is a glass monitor and has no anti-reflection coating. If a flat screen / plastic, be very cautious with any thing beyond soap and water and test a corner / edge area first. On a flat screen / LCD hardening the ink and flexing the surface can sometimes flake it off (ice cube – as used with gum in hair). Good luck. -ModE]
Ensure the monitor is properly cleaned prior to counting 🙂
OMG, I might have to go back and tamper with my data series. 😉
I have to second the notion that if they have photos, a ‘recalibration’ from the original material ought to be possible / done. ( IF they trashed the negatives then “Oh Well”…)
When I learned lab work, we had a notebook in which ALL data and work were recorded. It was forbidden (got you an automatic “F” Fail grade) to have ANY erasure. If something needed changing, you put a line through and annotated why the following replacement was to be used. Does no-one do that any more? Is there no record of “Original raw counts and sizes, then factors applied, then resultant ‘counts'” sitting in some lab book archive at the observatory?
Seems like a pretty simple and very effective protection against just this kind of “Aw Shoot” retrospective oopsy fixing…
( The more I experience the product of professional science, the more I appreciate what was taught to me in High School Science classes… by a retired Lt. Colonel from the Air Force W.W.II who was also a retired research chemist from U.S. Steel. Had rather, um, strict rules about things… rules that prevented an awful lot of ‘issues’…)
Sunspot count is only a proxy for what happened to the sun in the past and what is happening to the sun currently.
What is currently happening to the sun? (i.e. Say the last three or four cycles which are fully instrumented.)
Why are the solar cycle 24 sunspots getting smaller? Why the abrupt change in the solar magnetic cycle? What are the theoretical implications of no sunspots?
How would the solar magnetic cycle restart if there were no sunspots?
http://www.solen.info/solar/
Why is the solar large scalar polar field declining? How low can it go?
http://www.solen.info/solar/polarfields/polar.html
Are there any other anomalous solar observations?
@Justthinking
>…what are the implications of that statement?
> (The consequences of not having had a Modern Grand Maximum.)
The lack of solar grand maxima is not devastating to the functioning of the Universe. But it does devestate certain pet theories of climate scientists/buffs, which claim to prove/disprove AGW or similar stuff.
😐
I got 22. I was so hoping for 42 so we would all have the meaning of life but that is another story. Great history and lucid description of a very interesting problem. Thanks.
[Reply: Hopefully a /humor;> but if not: Try increasing strength of solvents starting with water,
>>>>>>>>>>>>>
Nah, I do some really dumb things sometimes…OK, really often. I’m a continuous stream of mishaps.
Isopropyl alcohol cleans permanent marker up lickety split I’ve discovered.
@ur momisugly E. M. Smith
Yes, we still cross out, initial, and annotate except now it’s likely to be electronic, but not always (there’s still some archaic regulations that require actual notebooks).
Rubbing permanent marker ink with a dry erase marker will result in a wipe-off-clean blob on most surfaces.
“A somewhat disturbing [to many people] consequence of the correction of the official sunspot number is that there is now no evidence for a Modern Grand Maximum [‘the largest in 8000 years’ or some such].”
I knew as soon as I started reading this that this was going to be about the highest sunspot activity in the last 8000 years. Why? Because quite a few weaknesses in the science skeptics have been pointing out have been getting adjusted or modeled out by scientists later on.
I find it hard to believe that the science that worked against or weakened the case for AGW was wrong in all those cases.
TomRude says:
January 4, 2013 at 5:36 pm
Since Wolf started his observation in the middle of the 19 century and that “At the Royal Greenwich Observatory photographs of the Sun have been taken ‘every’ day since 1874 until they stopped in 1975. From these photographs the RGO determined the area of all sunspots for every day”, we are only talking about 25 years of observation
The RGO data is a 100 years and Wolf’s series is 160 years plus the data back to 1610, 400 years.
Since sun spot counts was introduced by Wolf “in the middle of the 19th century”,
Wolf invented his relative sunspot number around 1850, but dug up observations back to 1610 and constructed sunspot numbers back to about 1700. Wolf continued to 1893 and after that his successors have brought it up to the present day.
PJF says:
January 4, 2013 at 5:38 pm
This is generally regarded around these parts as a good thing. Yet some dismiss Dr Svalgaard’s project as “sunspot fiddling”. Very unfair and not conducive to clear thinking.
If scientific records have become distorted for any reason, we need to know and should welcome any properly conducted studies that reveal and correct the distortions.
Exactly, and that goes for any data set.
pkatt says:
January 4, 2013 at 5:47 pm
This is what drives me crazy
I don’t deal with crazy people. Come back when you have something substantial.
John West says:
January 4, 2013 at 5:48 pm
Is there a place we can get raw sunspot data back to as close to 1600 as possible, numbers that you would consider “good”?
No, not yet. But you can get a good approximation back to 1700 from SIDC’s website. Then multiply every number prior to the year 1947 by 1.2 and you’ll be close to what I think we will end up with.
TomRude says:
January 4, 2013 at 6:04 pm
BTW given these observed sun variations and the relatively short period of direct observation compared to let’s say the last glacial/interglacial time frame, what magnitude of variation would make you consider some direct control on Earth climate a possibility?
I think we have within the observed series about the full range the sun can do. There are other stars with much more violent cycles, but solar-type stars are rather sedate.
Doug Huffman says:
January 4, 2013 at 6:16 pm
I figured I’d put a red dot with a felt marker on the screen over every sun spot so I don’t count any twice.
just click on the image and you get a much bigger version.
E.M.Smith says:
January 4, 2013 at 6:38 pm
I have to second the notion that if they have photos, a ‘recalibration’ from the original material ought to be possible / done. ( IF they trashed the negatives then “Oh Well”…)
This is being done, but only gets us back to 1874. And the RGO photographs don’t have a constant ‘calibration’ themselves so don’t really help much. But were good enough to show the discontinuity in 1946.
then resultant ‘counts’” sitting in some lab book archive at the observatory?
It is sad to say, but it seems that Waldmeier destroyed or ‘disappeared’ all the archives from observatory. I have been there to check and the material is gone.
William says:
January 4, 2013 at 6:45 pm
Why are the solar cycle 24 sunspots getting smaller? Why the abrupt change in the solar magnetic cycle? What are the theoretical implications of no sunspots?
Many questions. We don’t know all the answers.
How would the solar magnetic cycle restart if there were no sunspots?
No sunspots does not mean the solar magnetic cycle has gone away. On the contrary, during the Maunder Minimum cosmic ray modulation was a strong as ever.
Why is the solar large scalar polar field declining? How low can it go?
It is declining becasue there are fewer spots to feed the field. Why there are fewer spots, we don’t know.
Are there any other anomalous solar observations?
Yes: http://www.leif.org/research/Disappearance-of-Visible-Spots.pdf
John Day says:
January 4, 2013 at 6:54 pm
The lack of solar grand maxima is not devastating to the functioning of the Universe. But it does devastate certain pet theories of climate scientists/buffs, which claim to prove/disprove AGW or similar stuff.
Yep.
EM Smith said:
Here here! I learned that working in Aerospace. Every change, including serializing parts had to be lined out but still legible and identified with our Inspector/Engineer ID. On documents relating to them, same thing with date and annotations for the edit; virtually everything documented. Oh, and absolutely NO RED INK. Red=scrap. Pencils? Pack your things.
Being under FAA jurisdiction we would get in very big trouble scribbling, erasing or deleting data even if for tests being done incorrectly needing redoing; unacceptable and actionable if violated.
When discovering how things were done in climate science it was appalling to say the least the sloppiness and lack of archiving data, including Mulligans.
davidmhoffer says:
January 4, 2013 at 6:32 pm
“AAAAAAAAAAAAAAAARGH!
I figured I’d put a red dot with a felt marker on the screen over every sun spot so I don’t count any twice. I checked twice, I was SURE is was dry erase….”
Next time use alt printscreen to copy the image into the clipboard. Use shift insert to copy into MS Paint or other paint program. Erase every spot you count with the eraser tool of the paint program.
That’s how I would do it at least. Avoid physical objects like felt markers when possible.
Have been Schwabe’s original counts been preserved, or are we in a position of just correcting Wolf’s corrections? In other words, can we always access the original uncorrected data?