Guest post by Tom Fuller
The physics behind the theory of global warming are solid. CO2 is a greenhouse gas, we’re emitting industrial levels of it, with China now in the lead for emissions. A significant portion remains in the atmosphere for a fairly long time, though the residence time is widely disputed. This residence of CO2 retards the cooling of the Earth and temperatures warm as a result.
One of the few non-controversial datasets in climate change is the Keeling curve, the graph of the concentrations of CO2 in the atmosphere reproduced here:

We see concentrations rising steadily from 315 parts per million in 1960 to 395 ppm last year. It’s close to 400 ppm now.
Human emissions of CO2 caused by burning of fossil fuels and production of cement have risen similarly:

Emissions have climbed at an even higher rate than concentrations.
And the third data source to look at (for simplicity’s sake–we could actually look at dozens of data sources) is temperature changes. This chart shows the global average temperature change from a ‘normal’ 30-year range from 1950-1980. It comes from the Goddard Institute for Space Studies, led by scientist James Hansen.
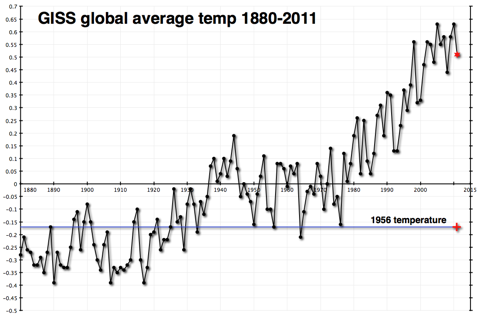
This shows a fairly constant rise in temperatures since 1978.
Once again, you don’t have to be a climate scientist to think that there seems to be a connection. The physical theory published first by Svante Arrhenius over 100 years ago and elaborated on by a century’s worth of scientists has observational evidence that tends to confirm it. I certainly believe in it.
In fact, I believe that global temperatures will probably rise by about 2 degrees Celsius over the course of this century. The difference in estimated temperature rises from different sources almost always comes from the differences in estimated atmospheric sensitivity to concentrations of CO2 in the atmosphere. Having extra CO2 in the atmosphere warms the atmosphere, which is presumed to produce more water vapor, which is also a greenhouse gas and would contribute more warming than the CO2 by itself. How much extra warming would ensue is pretty much the heart and soul of the debate over global warming.
Those who think that there isn’t much of an additional effect (that sensitivity of the atmosphere is low) have been chuckling very publicly because temperatures haven’t risen very much (if at all) since the big El Nino year of 1998. This is not hugely surprising, as the shape of the data is uneven, a sawtooth with ups and downs that can last a decade or longer. But it is happening at an inconvenient time politically for those who are worried that sensitivity is high. They are trying to get the world to prepare for warming of 4.5C or higher, without much success.
Here’s what temperatures look like more recently.

By itself, this chart doesn’t explain very much. As I said, it is not uncommon or unexpected for the temperature record to have flat or declining periods that last a decade or more.
However, I have a problem. The Carbon Dioxide Information Analysis Center (CDIAC) has estimates of how much CO2 humans have emitted since 1750. (Confusingly, they convert the CO2 to tons of carbon with a fixed formula.) That chart is the first one way up there at the top of the post. It rises dramatically
But looking at the data global.1751_2009 (3), one thing jumps out at me. CDIAC writes “Since 1751 approximately 356 billion metric tonnes of carbon have been released to the atmosphere from the consumption of fossil fuels and cement production.” And they helpfully provide an Excel spreadsheet showing their estimates by year.
And almost one-third of that number, 110 billion metric tonnes, have occurred since that time in 1998 when temperatures reached their temporary plateau.
| 1998 | 6644 |
| 1999 | 6611 |
| 2000 | 6766 |
| 2001 | 6929 |
| 2002 | 6998 |
| 2003 | 7421 |
| 2004 | 7812 |
| 2005 | 8106 |
| 2006 | 8372 |
| 2007 | 8572 |
| 2008 | 8769 |
| 2009 | 8738 |
Above: Table1, CO2 emissions by years, million metric tonnes – data CDIAC
Because heat moves somewhat sluggishly through the earth’s oceans, and because there is a lag factor in other earth systems, we do not expect a hair-trigger reaction to increases in CO2 emissions and concentrations.
But one-third of all human emissions of CO2 have occurred since 1998. And temperatures haven’t budged as a result.
This does not ‘disprove’ global warming–at all. I still believe that temperatures will climb this century, mostly as a result of the brute force effect of the 3,000 quads of energy we will burn every year starting in 2075–the reason I started this weblog.
However it makes it exceedingly difficult to use the past 15 years as evidence of a very high sensitivity of the atmosphere to CO2 concentrations. And it makes me feel more comfortable about my ‘lukewarm’ estimate of 2C temperature rises as opposed to the more alarming 4.5C rises put forward by some of those who are most active in the movement to reduce emissions drastically.
And it makes me wonder about why people don’t include relevant data when they discuss these issues. Is it really that politically incorrect to show real data, even if that data doesn’t advance your case?
Tom Fuller blogs at: 3000Quads and is co-author with Steve Mosher of the CRUTape Letters.
Discover more from Watts Up With That?
Subscribe to get the latest posts sent to your email.
flyfisher says:
December 7, 2012 at 9:46 am
What strikes me about the trend of the CO2 graph is that it is linear and not logarithmic…. Can anyone help me out with what I’m missing here?
>>>>>>>>>>>>>>>>>>>>>>>>>>>>>>>>>>>>>>>>
In a Nutshell: No one considers the fact that the CO2 data is just as manipulated as the temperature data. Those who are measuring CO2 elsewhere learned at Mauna Loa BTW.
…You say there are independent measurements. Once I had managed to find a link and publications for those measurements. The were all Keeling and another fellow, possibly the graduate student going through the loops. I do not call that independent….
Remember CO2 is released by the Mauna Loa and the adjacent Kilauea volcanoes.
From Mauna Loa:
When Zbigniew Jaworowski started asking pointy little questions he was denied funding and fired
Links:
Fred H. Haynie, a retired EPA research scientist, has devoted the past four years to a study of global climate change, and in particular the relationship to CO2… One reason I retired early from research at EPA years ago was good science was beginning to be sidetracked for political purposes. In this case EPA has been completely derailed. http://www.kidswincom.net/CO2OLR.pdf
Questioning the CO2 Ice Hockey Stick
WUWT: http://wattsupwiththat.com/2010/12/26/co2-ice-cores-vs-plant-stomata/
Comment on CO2: http://wattsupwiththat.com/2010/06/04/under-the-volcano-over-the-volcano/#comment-403545
and this
New Paper With Stunning Admission By Climate Alarmist Scientists: Actual CO2 Emissions Are Unknown; Please Send Money!
And here comes Englebeen to defend the sacred CO2 data…..
So any carbon tax needs to retroactive to the dinosaurs!
Gail Combs says:
Gail, thanks for all your well thought out comments that include links to support your “writings”
The following argument**, which is ubiquitously used by those extremely concerned about climate and those lukewarmingly concerned about climate, is unfixable in principle; it is reasonably beyond repair:
So, dear WUWTers, have fun with it during the holidays ahead.
** In another future post a case can be discussed that it is not an argument (reasoning) at all, but instead it could be viewed as just a convenient collage of rhetorically useful statements.
John
John,
You forgot to add the part which says:
Pretend that alternative non carbon, renewable energies will be plentiful, cheap, uninterruptable, and are are a viable subsitute for carbon based fuels that currently power our industries, transportation and electricity needs. The economies of the world will not be impacted and our homes warmer. There will be no Hurricanes, tornadoes, earthquakes, or wars.
– – – – – – –
Catcracking,
Hey, thanks for the additional thought to be incorporated into the ‘argument’.
We can temporarily stick your idea in the current ‘argument’s’ statement ‘g’. [which is: “g. End of argument**, but the beginning of the unfortunate precedent it sets in other areas like biodiversity . . . or any cause.”] So, that way your item can be considered a consequent from the whole of the ‘argument’. Right?
John
John, exactly, the irrational belief in alternative energy would not be needed without the fabrications you site.
Gail Combs says:
December 9, 2012 at 8:26 am
Gail, we have been there many times.
If you don’t like the “cleaning” procedure used at Mauna Loa (after all, we are interested in “background” CO2 data, not what a local volcano or vegetation emits or absorbs), simply plot the raw data, they give you exact the same yearly average and trend within 0.1 ppmv. Or if you think that the data are skewed by the local volcano or vegetation, use the data from the South Pole, no volcano or vegetation in the first 1,500 km. Desite that, exact the same trend, but with a lag of about a year, compared to Mauna Loa:
http://www.ferdinand-engelbeen.be/klimaat/klim_img/co2_trends_1995_2004.jpg
And let Jaworowsky rest in peace, together with his ideas about the ice cores CO2. If you can explain me how CO2 can migrate from 180 ppmv inside the ice core towards 395 ppmv outside the ice core, then I may start to believe him. And if you can show me that there is no difference between the age of the ice layers and the age of the enclosed air bubbles, then you may have convinced me completely…
Once again Steven Mosher (12/6 21:00) proves to others the fuzziness of his thinking.
It takes ENERGY to melt ice: 334 kJ/kg ice (Enthalpy of Fusion of Ice,
plus 2.1 kJ/kg/deg C to raise its temperature to the melting point. 1 kJ = 1000 Joules.
Watts are POWER (Re: kadaka above), energy per time: 1 Watt = 1 Joule/sec.
Watts/m^2 is a power surface density.
What Joules are to distance, Watts are to velocity.
So asking how “many excess watts does it take to melt Greenland” makes no more sense than to ask “what excess air speed do I need to get to the South Pole?” How long do you have? Where are you now? What is your heading? What is the velocity of the wind over the ground and how much does it gust and vary by day, season, and year?
A different question that HAS an answer is: How LONG will it take an “excess” 3.4 Watts/m^2 to melt a m^2 of ice cap 1 km think? Actually we can estimate the MINIMUM time to do this, assuming all heat goes into melt, perfect thermal insulation, iso-thermal conditions, no night and day, no sublimation, no evaporation, no precipitation:
Per m^2 of ice, 1 km thick, (2 to 3 sig. figs.)
Volumne of Ice = 1000 m^3
Density of ice = 920 kg/m^2
Mass of Ice = 920000 kg
Enthalpy of Fusion (ice) = 334000 J/kg
Energy required to melt = 3.07E+11 J
convert to Watt-sec = 1 (J/sec)/watt = J/watt-sec
Energy required to melt = 3.07E+11 watt-sec
sec/year = 3.16E+07 sec/year
Energy required to melt = 9740 watt-years
With: “Excess” 3.4 Watts/m^2 = 3.4 watts/m2
Minimum Time required to melt = 2860 years
A maximum melt rate of about a foot per year, which will not keep up with the precipitation we ignored along with a lot of other things.
@Johanus Dec 7, 06:36: +1
@Mostly Harmless 04:24: +1
@markx, 04:26: +1
@Spector 12:53: +1
@Gail Combs Dec 9, (05:48, 06:08, 06:55, 08:26) +2 for the lot.
Tom Fuller, in his main post, shows Figure1 ‘The Keeling curve Image: Scripps Institute’; which is all of the Mauna Loa Observatory’s Monthly Average Carbon Dioxide Concentration ‘data’ from from its beginning of measurements just before 1960 .
First, it looks like the vertical axis is somewhat inaccurately labeled as CO2 Concentration (ppm). The correct axis label should be CO2 Mixing Ratio (ppmv). I am surprised Scripps does not have it labeled accurately and resorts to an insufficiently specific labeling.
Second, the chart has little explanatory power about yearly short variations over ~6 decades of CO2 versus GMT without analysis of details all the specific annual variations of that figure which would show a strong relationship with the detailed annual variation of the anomalous GMT. Namely, temperature causes CO2 variation over very short times scales. Natural variations in temp can explain the dominate change in CO2. Attribution of a significant part of the CO2 changes to anthropogenic CO2 is inconsistent with the details of the CO2 data. NOTE: This is my interpretation of Murray L. Salby, “Physics of the Atmosphere and Climate” (January 2012, Cambridge University Press) section 1.6.2 figure 1.43.
John
For me, the temperature difference between the earths surface and the stratosphere drives the massive convection cycles that constitute the troposphere. This temperature difference is more or less a constant; it varies very little with the amount of heat it transfers. So the only possibility of warming is if the stratosphere warms. This region of the atmosphere has the curious property that the more co2, the more it cools, as it tends to radiate more heat to outer space. So while adding co2 should not produce cooling, there are powerful negative feedback mechanisms that ameliorate any small increases.
pouncer says:
December 7, 2012 at 3:44 pm
……The role of humanity in de-fossilizing sequestered carbon and returning it from geological graveyards into living breathing growing and evolving ecosystems seems under-reported. Nor is carbon the only such resource so redistributed. Thousand year deposits of guano — bats and seagulls removing phosphorous from the ecology and excreting it into useless piles — have been extracted and restored by humans. Vital “trace” minerals are mined, purified, and added to human foodstuff and are then distributed, via our sewers, to the rivers and oceans…..
___________________________________
Best comment on the whole mess that I have seen so far. Thank you.
C3 plants:
So it looks like an evolutionary transition from C3 to C4 was taking place because of carbon dioxide starvation.
RE: HenryP says: (December 7, 2012 at 10:14 pm )
[Spector says
The difference in watts indicates that the net upward irradiance from the Earth would be 3.39 watts per square meter less with 600 PPM CO2 concentration (blue curve) than with 300 PPM (mostly hidden green curve.) These are plots of Terrestrial Irradiance (‘Earthshine’) looking down from 20 km up with the Earth at an assumed identical constant surface temperature in each case.
Using the standard settings for the MODTRAN webtool]
“Henry says
you cannot “calculate” that which has never been measured first (and put in a balance sheet)”
I think we do this all the time. The first trip to the moon was based on calculations for an event that had never happened before. I believe the MODTRAN code is based on the detailed HITRAN spectrum line absorption data base and an assumed atmosphere. I usually qualify these as raw measurements that exclude feedback effects.
If you assume that the rapid temperature increase from 1965 to 1995 was *ALL* do to the CO2 increase, then I believe you do indeed get a much higher sensitivity than MODTRAN predicts. Perhaps so much higher than the raw sensitivity that it is easy to understand why there is talk catastrophic thermal runaway due to positive feedback in the atmosphere.
I believe MODTRAN has been validated, at least, with near current atmospheric conditions, as a predictive tool to estimate atmospheric infrared radiation levels to calibrate and design Air Force weapon systems.
The UK Climate Research Unit, HadCrut3 data indicates over the past 130 years, there has been only about 0.8 degrees C total total increase in average global temperature. MODTRAN results suggest that CO2 may be responsible for a relatively harmless 0.5 deg C. Based on the known temperature fluctuations of past history, I do not think it is reasonable to attribute all of observed temperature increases to CO2 even though these are ‘measured’ data.
The MODTRAN spectrum plot shows two interesting things. First, the effect of CO2 is limited to a relatively narrow region at the center of the terrestrial emission band and Second, there are no ‘holes’ in the radiation pattern due to water vapor. This suggests that the continual process of condensing accelerated convection makes water vapor a leaky greenhouse gas. There is very little water vapor left in the atmosphere above the 20 km sensor level.
REF: Validating MODTRAN for Climate Studies
By P Gosselin on 11. August 2012
By Ed Caryl
http://notrickszone.com/2012/08/11/validating-modtran-for-climate-studies/.
Spector said
I believe MODTRAN has been validated, at least, with near current atmospheric conditions, as a predictive tool to estimate atmospheric infrared radiation levels to calibrate and design Air Force weapon systems.
Henry says
yes, I was saying that that atmospheric infra red is only half the story. What is relevant there is the spectrum of the molecule from 5-15 um, which is the radiation coming up from earth 210-310 K (24/7)
So now what about the 0-5 um part of the spectrum where there are places in the molecule with absorption? They back radiate the sun’s incoming 5525K (12hrs/day)
I was asking for the balance sheet?
I don’t think you understand the behavior of a gas in the atmosphere yet.
Namely, in the case of CO2,
there is also radiative cooling, due to absorption of the molecule in the UV (which is why we can identify it on other planets!), in 1-2 um, and 4-5 um bands. I am saying that the cooling due to back radiation in these regions of the molecule that goes on 12 hours per day might be just as much as the warming (or:delay in cooling) due to the back radiation coming from earth 14-16 um, that goes on 24/7. So WHERE is the balance sheet that would show us that the physics is solid?
(never mind the whole problem that water vapor also absorbs in the 14-16 um and that there are also HxOx compounds lying on top of the atmosphere, just like ozone)
On top of that we have an increase in vegetation over the past 50 years which has been considerable.
Plants and trees need both warmth and CO2 to grow. Or did you ever see a tree grow where it is very cold? So how much biological cooling was caused by the CO2 due to the increase in vegetation over the past 50 years?
.
You see what the problem is? You cannot say: if there is an increase in CO2 it must be getting warmer (even though that increase in warming might be very small) until you have first proven it by doing some physical testing. The closed box experiments do not tell you how much radiative cooling is caused by the increase in CO2.
You cannot “calculate” that which has never been measured. (which is what they have been doing by applying as correct the inverse relationship which might not be causal. i.e. smoking causes cancer but cancer does not cause smoking.
For a better understanding of the physics, I advise you all to read this:
http://blogs.24.com/henryp/2011/08/11/the-greenhouse-effect-and-the-principle-of-re-radiation-11-aug-2011/
[“biological cooling” … or “biogical heating” (caused by increased plant growth increasing albedo) ? Mod]
RE: HenryP: (December 11, 2012 at 4:38 am )
.
“Henry says
“yes, I was saying that that atmospheric infra red is only half the story”
For thermal energy *leaving* the earth, it is almost the whole story, given the current temperature of the planet. What MODTRAN calculates is electromagnetic radiation in the atmosphere either going up or down over a wave-number spectrum range of 100 cycles/cm (100 microns) to 1500 cycles/cm (6.67 microns.) For a state of local equilibrium, the average radiation leaving the Earth (W/m2) must be the same as that being absorbed by the planet from the sun, an assumed constant (W/m2) level.
The intent here is to estimate the raw effect that changing the chemical composition of the atmosphere has on heat (W/m2) escaping given a fixed surface temperature, or on the value surface temperature given a fixed amount of heat leaving the atmosphere required for local equilibrium.
MODTRAN is not a climate prediction program; it is an isolated effect estimator. Cause and effect can become confused in measurements made, where all that is really known is that both things happened at the same time or in the same data set. We do know the absorption-emission spectra of the greenhouse gases and can calculate their effect on radiation leaving the atmosphere.
Henry@mod
(more) UV (=energy) + (more) CO2 + photosynthesis => (more) trees + plants + (more) food + drinks
The extra greenery in the past 50 years extracts energy (warmth) from the system.
Spector says
We do know the absorption-emission spectra of the greenhouse gases and can calculate their effect on radiation leaving the atmosphere.
henry says
if you want to continue this argument, without understanding what the argument is about, be my guest. I am not only interested in the effect it has on leaving earth. I am also interested to know how much cooling it causes?
For comprehensive proof that CO2 is (also) cooling the atmosphere by re-radiating sunshine, see here:
http://www.iop.org/EJ/article/0004-637X/644/1/551/64090.web.pdf?request-id=76e1a830-4451-4c80-aa58-4728c1d646ec
They measured this re-radiation from CO2 as it bounced back to earth from the moon. So the direction was sun-earth (day)-moon(unlit by sun) -earth (night). Follow the green line in fig. 6, bottom. Note that it already starts at 1.2 um, then one peak at 1.4 um, then various peaks at 1.6 um and 3 big peaks at 2 um. You can see that it all comes back to us via the moon in fig. 6 top & fig. 7. Note that even methane cools the atmosphere by re-radiating in the 2.2 to 2.4 um range.
So, my proposal is, try first to understand how a gas behaves in the atmosphere.
http://blogs.24.com/henryp/2011/08/11/the-greenhouse-effect-and-the-principle-of-re-radiation-11-aug-2011/
If you want to present me with that balance sheet, you have to get the dimensions right.
(W/m2/m3? time? concentration change of the CO2? etc, etc)
Only “Watts Up With That?” would accept submissions/publications from anonymous sources (“Guest Blogger”?). Who wrote this?
And the commentors . . . that link us to THEE alarmist AGW gatekeepers, wikitrash, spare me! Use another reference please.
IanG (says @ur momisugly December 7, 2012 at 5:15 pm) : Great question. I thought the delay was 600 years.
[Reply: The Guest Blogger is Tom Fuller, a regular contributor here. His name appears at the top of the article. — mod.]
RE: HenryP: (December 11, 2012 at 9:56 am)
“[Spector says
[We do know the absorption-emission spectra of the greenhouse gases and can calculate their effect on radiation leaving the atmosphere.]
“henry says
“if you want to continue this argument, without understanding what the argument is about, be my guest. I am not only interested in the effect it has on leaving earth. I am also interested to know how much cooling it causes?
Most cooling due to radiation emitted from CO2 occurs above the 20 km level, which is the standard level used to measure ‘Radiative Forcing’ of the troposphere–the graph that I referenced. As the CO2 absorption and emission lines are all at the same wavelengths, CO2 is a very efficient absorber of its own emissions.
A MODTRAN plot made at the default 70 km level does show a tall, thin spike in the middle of the CO2 band that is due to radiation from the mesosphere. Only at that altitude, is there so little CO2 left in the atmosphere that CO2 can have a cooling effect. If you look at a temperature profile of the atmosphere, you first see a cooling trend with altitude that is enabled by radiation from water vapor, then from the tropopause through the stratopause there is a warming trend and above the stratopause, cooling with increased altitude begins again, as CO2 is now so thin that it will not reabsorb its own emissions. Neglecting this upper region may cause a ten percent upside error on the MODTRAN estimates using the 20 km sensor level.
I have referenced this Wikipedia Radiative Forcing plot, as it is the only one I have found that clearly shows how little, doubling the CO2 content in the atmosphere would affect thermal infrared radiation leaving the Earth’s atmosphere.
The 350 Organization would have us believe that man has added far too much CO2 to the atmosphere already, and actually *doubling* the CO2 content would forever alter the world we know. These fears are easy to understand by those who see CO2 as a thickening gray cloud getting progressively darker as more CO2 is added, until it eventually blocks all cooling radiation from the Earth. That was the model I saw Bill Nye present in a global warming debate with Joe Bastardi.
MODTRAN shows that the effect of CO2 is limited to a narrow band that is already as dark as it can ever get, except for those narrow regions on the fringes of the band. As far as stopping the flow of heat from the atmosphere, CO2 is not like an ever-rising dam, as most people believe, it is more like a one-foot wide tree in the middle of a ten-foot wide stream. Perhaps the ‘tree’ also has a small crack in the middle due to mesospheric CO2 radiation.
REF: http://en.wikipedia.org/wiki/Mesosphere
“Within the mesosphere, temperature decreases with increasing altitude. This is due to decreasing solar heating and increasing cooling by CO2 radiative emission. The top of the mesosphere, called the mesopause, is the coldest part of Earth’s atmosphere.”
Just for further reference, here is a picture I found of a MODTRAN plot at the default 70 km altitude showing the spike due to radiation from the mesosphere. These plots show most cooling occurs at wavelengths longer than 6.667 microns, (wavenumber:1500 cycles/cm) with the majority being between 8.333 microns (1200 cycles/cm) and 40 microns. (250 cycles/cm) It is important to note that the CO2 ‘hole’ does not go down to zero energy flow, but drops to a value that corresponds to a temperature of 220 K from a peak that corresponds to a temperature of 280 K, this indicates, roughly, a 60 percent reduction in energy flow at the base. Increasing CO2 does not appear to reduce this threshold, but it only, ever so slightly, widens the gap on a logarithmic basis.
The other small gap off to the right at 1100 cycles/cm is due to ozone.
http://calvin-m-wolff.com/rad.02161212.gif
Unless it is in solid crystal form, CO2 only absorbs or emits photons. While CO2 may absorb shorter wavelength photons, I believe emission is most likely to occur in the base 15 micron band. Most solar energy is received at wavelengths shorter than one micron in the optical band where CO2 is transparent.
The website for the image is:
USING MODTRAN
http://calvin-m-wolff.com/Using_Modtran.html
Spector says
Most cooling due to radiation emitted from CO2 occurs above the 20 km level,
Henry says
Clearly, you still don’t understand how a gas behaves in the atmosphere;
here is another graph that shows. The red is the incoming solar arriving at sea level on a cloudless day
http://en.wikipedia.org/wiki/File:Solar_Spectrum.png
the yellow marked areas is all that is being “absorbed” by the gases in the atmosphere before it reaches earth…..
Unfortunately a gas has little mass. So it is impossible for the air to “absorb” (as heat) 25-30 % of incoming solar. I have been at length to explain, the term “absorption” is a bit unfortunate here. As I explained in my blog
http://blogs.24.com/henryp/2011/08/11/the-greenhouse-effect-and-the-principle-of-re-radiation-11-aug-2011
the yellow marked amount of radiation of that solar spectrum is what is being back radiated, mostly by the O3, H2O, O2, HxOx and NxOx, and lastly also by CO2. Study the spectra of what we measured coming back from the moon? .
So this back radiation (“cooling”), particularly of the CO2, (seeing that it is evenly distributed in the air) goes on from the bottom of the atmosphere to the top of the atmosphere…..surely you must be able to understand that?
I don’t know how to give a better explanation of what happens with gases in the atmosphere than what I have tried to give here:
http://blogs.24.com/henryp/2011/08/11/the-greenhouse-effect-and-the-principle-of-re-radiation-11-aug-2011
and I am stunned to find that people still do not understand it.
Surely, if there is more CO2, the yellow dents it makes in the incoming solar spectrum will become bigger? (i.e. more will go to the moon and more to outside earth……)
That is 5525K coming in there. Why climate scientist would only worry about the 210-310K going out from earth,is a total mystery to me….Surely, if they claim CO2 causes warming, they have to present us with a balance sheet?
The total confusion on – and total misunderstanding of – this whole subject, is quite unbelievable to me.
the key to understanding is the report measuring the radiation coming back from the moon
http://wattsupwiththat.com/2012/12/06/a-problem-nearly-one-third-of-co2-emissions-occured-since-1998-and-it-hasnt-warmed/#comment-1170447
RE: HenryP: (December 12, 2012 at 10:19 pm)
“Henry says
“Clearly, you still don’t understand how a gas behaves in the atmosphere;
here is another graph that shows. The red is the incoming solar arriving at sea level on a cloudless day . . . the yellow marked areas is all that is being “absorbed” by the gases in the atmosphere before it reaches earth….”
Yes, that is all true. That graph shows how the atmosphere is heated by solar radiation that does not reach the ground. Not how it is heated by radiation back from the ground. Most of that heat is bounced around and shared with other molecules in the atmosphere. The longest wavelength shown is 2500 nm (2.5 microns or 4,000 cycles per cm) which is far shorter than the 15,000 nm wavelength that CO2 tries to cool itself with.
Photons arriving from the sun were emitted at 5525 K. Luckily, the atmosphere of the Earth is far too cold to re-emit those wavelengths (except, perhaps as a result of transient molecular attachment.) Even though some of that energy does not reach the ground, it still adds to the heat that the Earth must return to outer space.
I have regarded cooling as an independent issue on the assumption that CO2 heating is minimal due to its transparency. I do not know if MODTRAN includes the effect of solar heating, but I suspect there would be major inaccuracies in its calculations if it did not. I believe that solar radiation is insignificant over the 6.667 to 100 micron band MODTRAN uses.
The standard Trenberth Global Energy Flows Diagram is useful here:
http://iedro.com/blog/wp-content/uploads/2012/04/RBRWuG0086_Trenberth_Radiative_Balance_BAMS_2008
What you are referring to are elements of the left side of this diagram showing how energy arrives on earth. The MODTRAN calculations apply to the right side showing how heat leaves the Earth. Because the Earth is so much colder than the sun, there is little overlap between the two. Solar energy that heats the atmosphere can only be returned to outer space via the pathways on the right side of the diagram. And yes, most heat is returned from the atmosphere. The 396 W/m2 surface radiation is replaced by 333 W/m2 back radiation for a net 63 W/m2 from the surface while the Earth, as a whole, is radiating 238.5 W/m2 to outer space. Only reflection returns shortwave solar energy directly to outer space and solid or liquid particles are usually required for that.
Spector says
That graph shows how the atmosphere is heated by solar radiation that does not reach the ground.
henry says
Only a small % of the 30% is used by heating the air. Most of it is back radiated, due to absorption and subsequent re-radiation, by the GHG gases, to outer space.
Hence we can measure it even after it has bounced back to us from the moon.
You have not understood how the GH effect works, precisely.
read the definition at the beginning here:
http://blogs.24.com/henryp/2011/08/11/the-greenhouse-effect-and-the-principle-of-re-radiation-11-aug-2011
and then you try to understand how the GH effect works. Do the forest experiment. We have a gas in the air where you can actually see the re-radiation!!
Other simple experiment:
\cold night in winter
clouds arrive
warmth is back radiated from the clouds
night feels a bit warmer
Spector says
I have regarded cooling as an independent issue on the assumption that CO2 heating is minimal due to its transparency.
Henry says
CO2 is not transparent, like nitrogen is, that is my whole point.
Spector says
I do not know if MODTRAN includes the effect of solar heating, but I suspect there would be major inaccuracies in its calculations if it did not. I believe that solar radiation is insignificant over the 6.667 to 100 micron band MODTRAN uses.
henry says
You cannot calculate that which has never been measured, never mind correctly understood, in the first place. MODTRAN is a fraud.
Sorry, but I have tried my best to re-educate you.
Spector says
That graph shows how the atmosphere is heated by solar radiation that does not reach the ground.
henry says
Only a small % of the 30% is used by heating the air. Most of it is back radiated, due to absorption and subsequent re-radiation, by the GHG gases, to outer space.
Hence we can measure it even after it has bounced back to us from the moon.
You have not understood how the GH effect works, precisely.
read the definition at the beginning here:
http://blogs.24.com/henryp/2011/08/11/the-greenhouse-effect-and-the-principle-of-re-radiation-11-aug-2011
and then you try to understand how the GH effect works. Do the forest experiment. We have a gas in the air where you can actually see the re-radiation!!
Other simple experiment:
\cold night in winter
clouds arrive
warmth is back radiated from the clouds
night feels a bit warmer
Spector says
I have regarded cooling as an independent issue on the assumption that CO2 heating is minimal due to its transparency.
Henry says
CO2 is not transparent, like nitrogen is, that is my whole point.
Spector says
I do not know if MODTRAN includes the effect of solar heating, but I suspect there would be major inaccuracies in its calculations if it did not. I believe that solar radiation is insignificant over the 6.667 to 100 micron band MODTRAN uses.
henry says
You cannot calculate that which has never been measured, never mind correctly understood, in the first place. MODTRAN is a fraud.
Sorry, but I have tried my best to re-educate you.
RE: HenryP says: (December 13, 2012 at 6:15 am )
“Henry says
CO2 is not transparent, like nitrogen is, that is my whole point.
CO2 is generally described as a colorless gas. It is transparent to electromagnetic radiation at all frequencies that do not resonate with its internal structure. Most transparent gases have fine absorption-emission lines, which correspond to their particular internal structures and molecular state of rotation. It is true that nitrogen is transparent to both optical and infra-red radiation because it is a ‘homonuclear’ molecule with no dipole moment to couple its vibrations to electromagnetic radiation.
Transparent does not mean perfectly transparent as rare abnormal absorption-emission events can occur during molecular collisions. There is also a complication caused by rare molecules with alternate isotopes, which have slightly different spectra.
The issue of what happens with shorter wavelength absorption bands of CO2 and other gases can absorb solar photons is both more complex and obscure. The following reference:
http://noconsensus.wordpress.com/2010/08/17/molecular-radiation-and-collisional-lifetime/
Says that the typical ground level molecular collision decay half-life of an excited CO2 molecule is on the order of a few microseconds while the radiation emission decay half-life may be on the order of a half second or so.
Thus, if the molecule is left alone long enough, a similar photon may be emitted at some random direction, where it might just as well be absorbed by another CO2 molecule. But it appears that the most likely effect, except at the top of the atmosphere, is that the absorbed energy is quickly shared out on inelastic collisions and so the net effect is to *heat* the atmosphere and that heat will eventually be emitted again to outer space as terrestrial band photons.
If that heat were not returned to outer space, it would eventually heat the ground by preventing convective cooling and increasing back-radiation. Only out-going terrestrial radiation, photons that are scattered out of the atmosphere, and no-deposit, no-return reflections can be put on the cooling side of the balance sheet. Gases do not reflect.
The *primary* reason that carbon dioxide has become an issue in climate studies is because its 15 micron absorption line happens to be right in the middle of the Earth’s thermal radiation emission band. The significance of this has been exaggerated as only a fraction of that band can be impacted by CO2 absorption. (See vibration mode one in the reference below.)
CO2 has a symmetric, non-polar molecular structure that minimizes its external electrical field. This minimizes its interaction with other molecules and is the reason that this gas is non-condensing in our atmosphere.
Infra-Red Spectroscopy
“Not all vibrations lead to absorption in the infra-red region. For absorption to occur there must be a change in the dipole moment in the molecule during vibration. This is illustrated by looking at the [transmission] spectrum of carbon dioxide gas.”
http://www.succeedingwithscience.com/labmouse/chemistry_as/1903.php
Wave-number 667 cm-1 is equivalent to 15 microns and 2300 cm-1 is equivalent to 4.35 microns.