Guest post by Tom Fuller
The physics behind the theory of global warming are solid. CO2 is a greenhouse gas, we’re emitting industrial levels of it, with China now in the lead for emissions. A significant portion remains in the atmosphere for a fairly long time, though the residence time is widely disputed. This residence of CO2 retards the cooling of the Earth and temperatures warm as a result.
One of the few non-controversial datasets in climate change is the Keeling curve, the graph of the concentrations of CO2 in the atmosphere reproduced here:

We see concentrations rising steadily from 315 parts per million in 1960 to 395 ppm last year. It’s close to 400 ppm now.
Human emissions of CO2 caused by burning of fossil fuels and production of cement have risen similarly:

Emissions have climbed at an even higher rate than concentrations.
And the third data source to look at (for simplicity’s sake–we could actually look at dozens of data sources) is temperature changes. This chart shows the global average temperature change from a ‘normal’ 30-year range from 1950-1980. It comes from the Goddard Institute for Space Studies, led by scientist James Hansen.
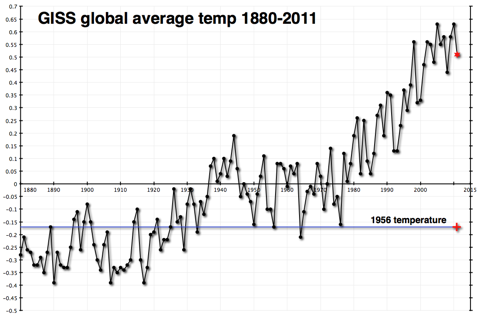
This shows a fairly constant rise in temperatures since 1978.
Once again, you don’t have to be a climate scientist to think that there seems to be a connection. The physical theory published first by Svante Arrhenius over 100 years ago and elaborated on by a century’s worth of scientists has observational evidence that tends to confirm it. I certainly believe in it.
In fact, I believe that global temperatures will probably rise by about 2 degrees Celsius over the course of this century. The difference in estimated temperature rises from different sources almost always comes from the differences in estimated atmospheric sensitivity to concentrations of CO2 in the atmosphere. Having extra CO2 in the atmosphere warms the atmosphere, which is presumed to produce more water vapor, which is also a greenhouse gas and would contribute more warming than the CO2 by itself. How much extra warming would ensue is pretty much the heart and soul of the debate over global warming.
Those who think that there isn’t much of an additional effect (that sensitivity of the atmosphere is low) have been chuckling very publicly because temperatures haven’t risen very much (if at all) since the big El Nino year of 1998. This is not hugely surprising, as the shape of the data is uneven, a sawtooth with ups and downs that can last a decade or longer. But it is happening at an inconvenient time politically for those who are worried that sensitivity is high. They are trying to get the world to prepare for warming of 4.5C or higher, without much success.
Here’s what temperatures look like more recently.

By itself, this chart doesn’t explain very much. As I said, it is not uncommon or unexpected for the temperature record to have flat or declining periods that last a decade or more.
However, I have a problem. The Carbon Dioxide Information Analysis Center (CDIAC) has estimates of how much CO2 humans have emitted since 1750. (Confusingly, they convert the CO2 to tons of carbon with a fixed formula.) That chart is the first one way up there at the top of the post. It rises dramatically
But looking at the data global.1751_2009 (3), one thing jumps out at me. CDIAC writes “Since 1751 approximately 356 billion metric tonnes of carbon have been released to the atmosphere from the consumption of fossil fuels and cement production.” And they helpfully provide an Excel spreadsheet showing their estimates by year.
And almost one-third of that number, 110 billion metric tonnes, have occurred since that time in 1998 when temperatures reached their temporary plateau.
| 1998 | 6644 |
| 1999 | 6611 |
| 2000 | 6766 |
| 2001 | 6929 |
| 2002 | 6998 |
| 2003 | 7421 |
| 2004 | 7812 |
| 2005 | 8106 |
| 2006 | 8372 |
| 2007 | 8572 |
| 2008 | 8769 |
| 2009 | 8738 |
Above: Table1, CO2 emissions by years, million metric tonnes – data CDIAC
Because heat moves somewhat sluggishly through the earth’s oceans, and because there is a lag factor in other earth systems, we do not expect a hair-trigger reaction to increases in CO2 emissions and concentrations.
But one-third of all human emissions of CO2 have occurred since 1998. And temperatures haven’t budged as a result.
This does not ‘disprove’ global warming–at all. I still believe that temperatures will climb this century, mostly as a result of the brute force effect of the 3,000 quads of energy we will burn every year starting in 2075–the reason I started this weblog.
However it makes it exceedingly difficult to use the past 15 years as evidence of a very high sensitivity of the atmosphere to CO2 concentrations. And it makes me feel more comfortable about my ‘lukewarm’ estimate of 2C temperature rises as opposed to the more alarming 4.5C rises put forward by some of those who are most active in the movement to reduce emissions drastically.
And it makes me wonder about why people don’t include relevant data when they discuss these issues. Is it really that politically incorrect to show real data, even if that data doesn’t advance your case?
Tom Fuller blogs at: 3000Quads and is co-author with Steve Mosher of the CRUTape Letters.
Steven Mosher says:
December 7, 2012 at 11:34 am
I’ll ask the question again. using whatever wavelengths you want, please show the difference between the sun in the LIA and the sun today?
Err.. is that a trick question? The Svensmark effect is a serious contender to explain the mechanism of amplification of minor solar variances. That ampplification has real impacts on solar insolation, which is the real driver of temperature and climate.
Are you asking the right question?
RE: Steven Mosher: (December 6, 2012 at 9:00 pm)
[RE: Spector says: December 6, 2012 at 8:53 pm]
“MODTRAN Radiative Forcing; Double CO2
“MODTRAN3 v1.3 upward irradiance at 20 km [up], U.S. Standard Atmosphere
http://en.wikipedia.org/wiki/File:ModtranRadiativeForcingDoubleCO2.png%5D
“Yes, notice the difference in Watts.
“Now quickly what was the difference in watts from the sun between the LIA and today?”
The difference in watts indicates that the net upward irradiance from the Earth would be 3.39 watts per square meter less with 600 PPM CO2 concentration (blue curve) than with 300 PPM (mostly hidden green curve.) These are plots of Terrestrial Irradiance (‘Earthshine’) looking down from 20 km up with the Earth at an assumed identical constant surface temperature in each case.
Using the standard settings for the MODTRAN webtool hosted by the University of Chicago:
CO2=375 PPM
CH4=1.7 PPM
Trop. Ozone=28 PPB
Strat Ozone Scale=1
Ground T offset=0
hold water vapor=pressure
Water Vapor Scale=1
Locality=1976 U. S. Standard Atmosphere (default: Tropical)
[Weather]=No Clouds or Rain
Sensor Altitude=20 km (default 70 km)
[Orientation]=Looking Down
One gets an output for “Ground T, K=288.20 (degrees Kelvin ) for Iout of 258.893 W/m2.
Then if you set the Ground T offset to +1, the result is 262.200 W/m2 for 289.20 K
The difference being 3.307 W/m2 for a one degree surface temperature rise. Assuming a constant solar energy input, that one degree rise would just about compensate for irradiance lost (3.39 W/m2) by doubling the CO2 content. So far, man has added enough CO2 to the atmosphere for about a half doubling (41.4% increase), logarithmic effect.
I understand that the 20 km sensor altitude setting, which shows energy flowing out of the troposphere, is the standard for measuring ‘Radiative Forcing.’ I believe that data calculated for the default 70 km altitude would be more representative of thermal energy actually escaping the planet.
Ref: Modtran Infrared Atmospheric Radiation Code
http://forecast.uchicago.edu/Projects/modtran.html
mellyrn says:
December 7, 2012 at 9:33 am
If CO2 slows down the cooling of the Earth’s surface, then does it not, by that exact same process and to the exact same degree, slow down the warming of the Earth’s surface — by absorbing IR coming in from the Sun and isotropically re-radiating ~half of that back out?
—————————–
MikeB says:
(Hilariously erroneously, since it’s nearly verbatim what davidmhoffer told me a few days ago in HIS impassioned plea for me to believe he ‘understands the physics’ and that the fact the sun is blue and that I don’t know, is proof I don’t)
December 7, 2012 at 10:15 am
“NO, because the solar radiation comes in at different wavelengths to the outgoing earth radiation. See…
http://www.ghgphys.com/userimages/sunearth2.png
The carbon dioxide band relevant to global warming is between 14 and 16 micron. Notice that this coincides with the outgoing radiation, but doesn’t block the incoming insolation.
Easy – yes! Try to get up to speed.”
————————————-
You are the second Greenhouse Gasser who’s come here
insulting the readers *** for not knowing the sun is blue***
in just a few days.
You people who believe in Greehnouse Gas religion are stunningly ignorant; and indeed to a man seem like you’re also utterly impervious to that typical proof a theory is wrong: the calculations and algebraic principles are wrong all along the way.
You’re so sure you’re right: you’ve looked over all the calculations, and yes, Greenhouse Gas Religion makes perfect sense according to the numbers…you’ve been cogitating on it for years, “teaching” and “clarifying” the “sensitive, nuanced physics,”
and then you reveal that:
the whole time,
you thought the sun is blue.
From Greenhouse/Occupy-pedia: the article ‘Sunlight’ :
“…Sunlight in space at the top of Earth’s atmosphere … is composed (by total energy) of about 50% infrared light,
40% visible light,
and 10% ultraviolet light.”
“At ground level this decreases… by energy fractions to 44% visible light, 3% ultraviolet (with the Sun at the zenith, but less at other angles), and the remainder (53%) infrared.
Thus, sunlight’s composition at ground level, per square meter, with the sun at the zenith, is about
527 watts of infrared radiation,
445 watts of visible light,
and 32 watts of ultraviolet radiation. “
It is very clear from this graph:
http://www.climate4you.com/images/HadCRUT4%20GlobalMonthlyTempSince1958%20VersusCO2.gif
Diagram showing HadCRUT4 monthly global surface temperature estimate plotted against the monthly atmospheric CO2 content according to the Mauna Loa Observatory, Hawaii, back to March 1958. The red line is a polynomial fit with key statistics listed in the upper left part of the diagram. Last month incorporated in the analysis: October 2012 (inside red circle). Last diagram update: 21 November 2012.
http://www.climate4you.com/ClimateReflections.htm#20080927:%20Reflections%20on%20the%20correlation%20between%20global%20temperature%20and%20atmospheric%20CO2
Maybe there should be some “consensus” that the warming since LIA has released CO2, thus the rise in CO2 is an artifact of the warming oceans plus industrialization. And the warming since LIA allows for additional atmospheric moisture while warming oceans allow for less concentration of soluble CO2. I still see the problems with which came first, the chicken or the egg, in founding the arguments. In the end it’s always the surface heating the atmosphere regardless of the atmospheric composition.
****
Steven Mosher says:
December 7, 2012 at 11:34 am
TSI is overrated. Total solar is over rated? really? Is that settled science?
I’ll ask the question again. using whatever wavelengths you want, please show the difference between the sun in the LIA and the sun today?
use watts. it will help folks understand.
***
No significant difference. Not sure what your point is, other than the global climate, despite constant TOA solar input, varies naturally at least of couple degC over centennial timescales. In fact, it’s proven in ice cores to vary far more than that.
Having read Fuller’s article I am left with the impression he knows about as much as the rest of us.
– – – – – –
Tom Fuller,
Your opening paragraph has the fundamental seeds of why your argument does not lead logically and scientifically to your’ belief’ (your word not mine) that a problem exists about adding anthropogenic CO2 to the Earth-Atmospheric system.
First it is not sufficient to say “The physics behind the theory of global warming are solid.”. That statement is not relevant when applied to the multiple timescale dependent net effects of all physical processes, considered individually and in interaction with each other, of the actual total Earth-Atmospheric system as it exists in its setting of orbiting the Sun and having a relatively large moon. You are substantially incorrect because simple ideally arranged boundary condition physics calculations with caveats of ‘all other things being equal’ do not present your solid basis of global warming of the Earth-Atmospheric system. It does not. GCMs do not help your statement either; rather they would weaken it considerably.
Second, the ‘theoretical’ direct temperature change effect of anthropogenic CO2 increase on the Earth-Atmospheric system may be as much as ~1.2 C per CO2 doubling, or it may be much less. It is not conclusively known what the direct effect magnitude is in the actual Earth-Atmospheric system as opposed to a laboratory research project. With any magnitude for it, the case observationally is that it appears to be, in geologic timescales and in the modern period from ~1860, not of sufficient causal climate change magnitude compared to naturally occurring phenomena that are a quite reasonable basis for explaining all of the climate behavior. This observation contains feedbacks occurring within the timescales; arguments of quasi-equilibrium in the Earth-Atmosphere system outside of the timescales notwithstanding.
Third, it is not scientifically meaningful to say “CO2 retards the cooling of the Earth and temperatures warm as a result.”. The Earth-Atmospheric system contains a multi-gaseous planetary atmosphere which provides a planetary atmospheric effect on Earth-Atmospheric system’s overall behavior in response to all the energy flows into, within and out of the Earth-Atmospheric system. CO2’s radiative behavior is a component of the whole planetary atmospheric behavior of the Earth-Atmospheric system; greenhouses are irrelevant and a misleading misnomer wrt to the planetary atmosphere effect and CO2’s role as an interactive part of that planetary atmospheric effect. What changes the planetary atmospheric effect when CO2 is added (or if any gas is added) is a change in the energy flows/patterns (both of heat energy and radiative energy) and the boundary conditions within the Earth-Atmospheric system. Energy flow changes and boundary condition changes are what provide the accurate description of the planetary atmospheric effect changes in response to changes in quantities of any of the gases within the Earth-Atmospheric system. Your ‘delay’ description should be modified.
Although anthropogenic CO2 isn’t needed to reasonably explain the climate behavior on all timescales, that explanation does not prima fascia preclude some minor to moderate effect on the Earth-Atmosphere system. I think science is not yet in the developmental state of knowing.
In conclusion=> Concern should be displaced forthwith until better case made about anthropogenic CO2 increase.
I highly recommend the posts in other threads of ‘rgb’ from Duke University as a highly readable explanation of the physics. DISCLAIMITORY NOTE: I do not claim my comment above is in any way reflective of what ‘rgb’ has said . . . my comment is my view only. But I like ‘rgb’ stuff. : )
John
RE highflight56433 (December 7, 2012 at 1:37 pm)
“Maybe there should be some “consensus” that the warming since LIA has released CO2, thus the rise in CO2 is an artifact of the warming oceans plus industrialization. And the warming since LIA allows for additional atmospheric moisture while warming oceans allow for less concentration of soluble CO2. I still see the problems with which came first, the chicken or the egg, in founding the arguments. In the end it’s always the surface heating the atmosphere regardless of the atmospheric composition.”
I know that it is possible to create two or three-stage RC-type filter array that more or less relates sea-surface temperatures to the observed CO2 concentration with optimized selection of the initial conditions in 1880, however this appears to imply an unreasonably high sensitivity to the 0.8 degree net temperature change since then, and with so many arbitrary values involved, (initial conditions and time constants) this formulation seems highly artificial.
I believe it is safe to assume that the CO2 increase is man-made, with petroleum production now on the order of 90 million barrels of oil daily and the net ‘global warming’ effect being limited to about a half a degree C. since 1850. Depending on how much economically recoverable, combustible carbon is left in the ground, we may add another half degree in another hundred and years or so. I think we are reaching the point where we really need to develop a feasible, safe nuclear power technology or prepare for the major population reduction required to make ‘green energy’ practical in the post-carbon era.
Ecologist Paul Colinvaux in his 1978 book _Why Large Fierce Animals are Rare_ explains, among other things, that our current biosphere is limited by a scarcity of atmospheric carbon dioxide. The role of humanity in de-fossilizing sequestered carbon and returning it from geological graveyards into living breathing growing and evolving ecosystems seems under-reported. Nor is carbon the only such resource so redistributed. Thousand year deposits of guano — bats and seagulls removing phosphorous from the ecology and excreting it into useless piles — have been extracted and restored by humans. Vital “trace” minerals are mined, purified, and added to human foodstuff and are then distributed, via our sewers, to the rivers and oceans.
Without humanity, an ever depleting biosphere would gradually but inevitably grind to a halt as unintelligent life converts “resources” into “waste products” at the billion-year-old traditional rate. So-called “natural” processes convert, at best, only a few percent of available solar energy into the stuff of life. Humans, however, cheat. Our solar processes exceed photosynthetic efficiencies. Our fossil fuel processes, recovered the lost carbon of failed species such as dinosaurs, not only support us and our client agricultural species, but restore vital carbon to the air. And our potential to use nuclear fission and fusion offer improvements in energy efficiency that are literally astronomically out of proportion to “nature” and will, ultimately, allow our biosphere to become a bio-torus around the sun, if not a bio-DYSON-sphere.
And as a by-product of the restoration of fossil carbon to our ecosystem, we are beginning expose acreage that has been biologically out-of-production since the last ice age. The ice is getting out of the way and species can emerge from the warm areas — Colinvaux refers to these tropics as “Refugia” — to re-colonize Iceland, Greenland, Siberia and Alaska. Plants, including bristlecone pines, will seed themselves higher into the mountains, above the current frost line. We can expect to see more algae and lichens bloom. The polar bears and caribou have never had conditions so good; and it’s only getting better. Mr Fuller’s graph of how well, quickly, efficiently and consistently humanity is accomplishing this destiny is reason for celebration
AlecM: Meteorology and by inheritance climate science teach that a pyrometer, e.g. a pyrgeometer, measures a real energy flux when in reality it is the assembly of Poynting Vectors in the viewing angle of the instrument.You can easily prove it – have two instruments back to back in zero temperature gradient and net signal is zero. Take one away and it jumps up to the temperature signal.
I get an idea of what you are trying to say. I’d love to see that pyrgeometer experiment on Youtube. Should go viral if it really proofs the GHE from CO2 (or any GHG) can not be measured as advertised.
Millions of years ago when plants first started to appear we had 15 times the amount of CO2 that we have today….but according to the warmers we would start to burn up at twice today’s levels. As the planet greened up instead of being a lifeless dust bowl the warmers are wrong. To compound their misery if high CO2 were able to acidify the oceans then they would long ago ceased to have any life in them.
Why is CO2 not causing the high temps predicted?….First if all it’s ability to create heat diminishes in a logarithmic curve as you stack it up and secondly the climate models put in as much positive feedback as they can whilst apparently ignoring negative feedback.
AGW well and truly up the creek.
blogagog says:
December 7, 2012 at 1:26 am
I have a greenhouse that during growing season is kept at ~1500PPM CO2. Plants love it, but it will give you a pretty bad headache if you stay in there for 2 hrs or more.
This is OT but I will agree with others, I think you may have a C0 issue not a C02 issue. I would check.
Mosher writes “I’ll ask the question again. using whatever wavelengths you want, please show the difference between the sun in the LIA and the sun today?”
And the answer is “completely unknown”. The fact that the components of TSI varied so much (an order of magnitude more than expected) was completely unknown up until recently and we just dont have any data to know its implications in the past.
TSI is overrated because different wavelengths play different roles in the atmosphere. UV is on the whole captured high in the atmosphere as is IR. So if TSI is made up of more UV and/or more IR for a period then warming effect at the earth’s surface changes.
You cant just lump it all into one TSI figure and expect to get meaningful results when the differences you’re looking for at the surface are so small.
We know that CO2 rises after around 800 years following a warm period. So what was happening in 1150? The medieval warm period? So how much of today’s CO2 level is due to that period?
I’m wondering if it will take a few years before we see temperature change…..any thoughts? I am a global warming advocate and just started exploring your site : )
Blogagog:
CO2 levels in a typical New York City Office building is normally around 1,000 ppm. Older buildings can reach 2,000 ppm. i second what others are saying. If your CO2 generator is not operating correctly, you could be giving yourself CO poisoning. Normal background CO should be 9 ppm or less. The limit is 25 ppm for no more than 8 hours.
I used to check CO in homes as part of a check on the combustion systems. Headaches are a common symptom of CO.
@theBuckWheat:
We can get an idea of the optimal temperature via observation of human choice. Given a choice, people abandon Detroit and move to Miami. The leave The Dakotas and Wyoming and head to Santa Fe and Phoenix… (Phoenix has just about a 4 season growing season too, while the Imperial Valley of California clearly can grow things year round as that’s where our winter salads come from…)
So, on the face of it, folks clearly find about 86 F ( 30 C ) just about ideal. So I’d set that as the “goal”. I do note in passing that even at 104 F ( 40 C ) folks in places like Phoenix are quite happy with life (while at 0 F folks get grumpy and you die if outside unprotected too long) and “pool time” is preferred to “ice camping” by most…
So set your goal to 30 – 40 C ( 86 – 104 F ) and I think you’ll be fine.
@Bair Polaire:
OK, it’s still a ‘work in progress’, but I said I’d get something back today:
http://chiefio.wordpress.com/2012/12/08/broken-reasoning-and-hot-air/
First cut, and still needs a load of links and pictures added, plus a few more topic lines, but at least now you know where to watch 😉
“The physics behind the theory of global warming are solid.”
Yes it is, but the theory neglects equally solid physics that mitigates the effect. One can think of dozens of solidly phiysical mitigating factors; saturation, effective sequestration amongst overwhelming water vapor molecules near the surface, greater radiating surface area at higher “effective radiating altitude”, and many others mentioned above. We lack the tools to sort all this out, but we have a box we’ve put lots of CO2 in and not much atmospheric warming is coming out.
pouncer:
“Our fossil fuel processes, recovered the lost carbon of failed species such as dinosaur…”
There was a post by Indur M. Golkany late last year, iirc, praising the merits of “fossil fuels”, attracting around 100 responses or so. Willis Eschenbach had a post on “hydrocarbons” at around the same time, with a similar number of responses.
I did a search on the comments of both, and found that almost every post to Indur’s article used the term “fossil fuels,” with only one poster deferring to the neutral scientific term for the species in the H-C system, i.e., “hydrocarbons.” On the thread about hydrocarbons by Willis, however, “hydrocarbons” was the most popular term used in comments, with the word “fossil” appearing maybe once. The same “group think” phenomena is evident on this page too.
Now it so happens that dead things like dinosaurs and whales and phytoplankton blooms, even if they don’t get eaten (which they do in almost every case), degrade spontaneously, at some rate, according to the law of entropy (not to mention diffusion, dilution, and gravitational displacement of things like fats in water). If you can overcome the logistics problems with accumulation and preservation of vast quantities of biological molecules, you still have an insurmountable thermodynamic constraint imposed on transforming your pile into petroleum, because to push sh*t uphill you need energy:
http://www.pnas.org/content/99/17/10976.long.
But in the sediments of a post modern Earth, reality is a social construct. 😉
Mo says
I am a global warming advocate and just started exploring your site : )
I’m wondering if it will take a few years before we see temperature change…..any thoughts?
Henry @ur momisugly MO
well, my own data set shows we are cooling. In fact almost all major data sets now indicate that we are cooling since 2002
http://www.woodfortrees.org/plot/hadcrut4gl/from:2002/to:2012/plot/hadcrut4gl/from:2002/to:2012/trend/plot/hadcrut3vgl/from:2002/to:2012/plot/hadcrut3vgl/from:2002/to:2012/trend/plot/rss/from:2002/to:2012/plot/rss/from:2002/to:2012/trend
Looking at my own results, this cooling will continue until around 2035.
http://blogs.24.com/henryp/2012/10/02/best-sine-wave-fit-for-the-drop-in-global-maximum-temperatures/
Spector says
The difference in watts indicates that the net upward irradiance from the Earth would be 3.39 watts per square meter less with 600 PPM CO2 concentration (blue curve) than with 300 PPM (mostly hidden green curve.) These are plots of Terrestrial Irradiance (‘Earthshine’) looking down from 20 km up with the Earth at an assumed identical constant surface temperature in each case.
Using the standard settings for the MODTRAN webtool
Henry says
you cannot “calculate” that which has never been measured first (and put in a balance sheet)
http://wattsupwiththat.com/2012/12/06/a-problem-nearly-one-third-of-co2-emissions-occured-since-1998-and-it-hasnt-warmed/#comment-1167114
to refer people to a calculating program that supposedly is correct (MODTRAN) is misleading them.
Khwarizmi says: December 7, 2012 at 8:58 pm
“….If you can overcome the logistics problems with accumulation and preservation of vast quantities of biological molecules, you still have an insurmountable thermodynamic constraint imposed on transforming your pile into petroleum, because to push sh*t uphill you need energy:
http://www.pnas.org/content/99/17/10976.long….”
That is detailed work and an incredible read. It makes sense given the great quantities and and the great depths at which hydrocarbons are now found. … but am I correct in assuming coal beds (brown coal at least?) can still considered to be sedimentary organic products?
Jeremy Poynton says:
December 7, 2012 at 5:00 am
How many Watts does it take to fry a Mann?
Jeremy, that’s some absolutely capital pun-ishment! ;->
Seems very simple …
CO2 has increased by 30% since 1998.
CO2 is said to be responsible for only 1/3 of the projected warming, the balance of the projected warming being attributed to the effect of the CO2 warming driving an increased level of the major GHG on the planet, atmospheric H20.
It is this missing increase in the level of atmospheric H20 which is responsible for the lack of warming.
And is therefore responsible for exposing a flaw in the whole CAGW theory.