Guest post by Tom Fuller
The physics behind the theory of global warming are solid. CO2 is a greenhouse gas, we’re emitting industrial levels of it, with China now in the lead for emissions. A significant portion remains in the atmosphere for a fairly long time, though the residence time is widely disputed. This residence of CO2 retards the cooling of the Earth and temperatures warm as a result.
One of the few non-controversial datasets in climate change is the Keeling curve, the graph of the concentrations of CO2 in the atmosphere reproduced here:

We see concentrations rising steadily from 315 parts per million in 1960 to 395 ppm last year. It’s close to 400 ppm now.
Human emissions of CO2 caused by burning of fossil fuels and production of cement have risen similarly:

Emissions have climbed at an even higher rate than concentrations.
And the third data source to look at (for simplicity’s sake–we could actually look at dozens of data sources) is temperature changes. This chart shows the global average temperature change from a ‘normal’ 30-year range from 1950-1980. It comes from the Goddard Institute for Space Studies, led by scientist James Hansen.
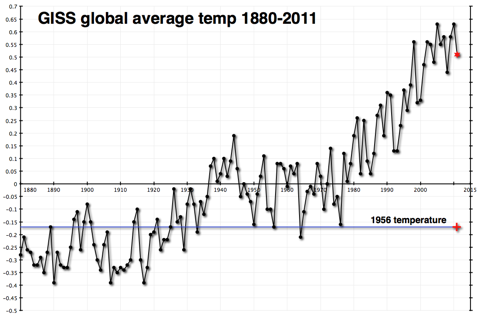
This shows a fairly constant rise in temperatures since 1978.
Once again, you don’t have to be a climate scientist to think that there seems to be a connection. The physical theory published first by Svante Arrhenius over 100 years ago and elaborated on by a century’s worth of scientists has observational evidence that tends to confirm it. I certainly believe in it.
In fact, I believe that global temperatures will probably rise by about 2 degrees Celsius over the course of this century. The difference in estimated temperature rises from different sources almost always comes from the differences in estimated atmospheric sensitivity to concentrations of CO2 in the atmosphere. Having extra CO2 in the atmosphere warms the atmosphere, which is presumed to produce more water vapor, which is also a greenhouse gas and would contribute more warming than the CO2 by itself. How much extra warming would ensue is pretty much the heart and soul of the debate over global warming.
Those who think that there isn’t much of an additional effect (that sensitivity of the atmosphere is low) have been chuckling very publicly because temperatures haven’t risen very much (if at all) since the big El Nino year of 1998. This is not hugely surprising, as the shape of the data is uneven, a sawtooth with ups and downs that can last a decade or longer. But it is happening at an inconvenient time politically for those who are worried that sensitivity is high. They are trying to get the world to prepare for warming of 4.5C or higher, without much success.
Here’s what temperatures look like more recently.

By itself, this chart doesn’t explain very much. As I said, it is not uncommon or unexpected for the temperature record to have flat or declining periods that last a decade or more.
However, I have a problem. The Carbon Dioxide Information Analysis Center (CDIAC) has estimates of how much CO2 humans have emitted since 1750. (Confusingly, they convert the CO2 to tons of carbon with a fixed formula.) That chart is the first one way up there at the top of the post. It rises dramatically
But looking at the data global.1751_2009 (3), one thing jumps out at me. CDIAC writes “Since 1751 approximately 356 billion metric tonnes of carbon have been released to the atmosphere from the consumption of fossil fuels and cement production.” And they helpfully provide an Excel spreadsheet showing their estimates by year.
And almost one-third of that number, 110 billion metric tonnes, have occurred since that time in 1998 when temperatures reached their temporary plateau.
| 1998 | 6644 |
| 1999 | 6611 |
| 2000 | 6766 |
| 2001 | 6929 |
| 2002 | 6998 |
| 2003 | 7421 |
| 2004 | 7812 |
| 2005 | 8106 |
| 2006 | 8372 |
| 2007 | 8572 |
| 2008 | 8769 |
| 2009 | 8738 |
Above: Table1, CO2 emissions by years, million metric tonnes – data CDIAC
Because heat moves somewhat sluggishly through the earth’s oceans, and because there is a lag factor in other earth systems, we do not expect a hair-trigger reaction to increases in CO2 emissions and concentrations.
But one-third of all human emissions of CO2 have occurred since 1998. And temperatures haven’t budged as a result.
This does not ‘disprove’ global warming–at all. I still believe that temperatures will climb this century, mostly as a result of the brute force effect of the 3,000 quads of energy we will burn every year starting in 2075–the reason I started this weblog.
However it makes it exceedingly difficult to use the past 15 years as evidence of a very high sensitivity of the atmosphere to CO2 concentrations. And it makes me feel more comfortable about my ‘lukewarm’ estimate of 2C temperature rises as opposed to the more alarming 4.5C rises put forward by some of those who are most active in the movement to reduce emissions drastically.
And it makes me wonder about why people don’t include relevant data when they discuss these issues. Is it really that politically incorrect to show real data, even if that data doesn’t advance your case?
Tom Fuller blogs at: 3000Quads and is co-author with Steve Mosher of the CRUTape Letters.
Discover more from Watts Up With That?
Subscribe to get the latest posts sent to your email.
Just three words chaotic, politics and belief collide indignantly with science, theory and hypothesis cut to the chase and objectively you have to recognise the fact that everyone involved in this fracas has an axe to grind. The politicians Ban Kimoon UN, Obama, EU, the activists WWF FOE Greenpeace media BBC, various sycophantic economists and pseudo scientists Univ Professors are all milking “the climate” for all that they are worth and in truth no one really knows what the hell is going on and 40 years ago no one really cared now the paranoia on all fronts is bordering on lunacy. Even when data and evidence is presented that directly contradicts the hypothesis politicians and activists continue to wring their hands about warming even when warming is not happening because their specific goal was never about saving the planet the UN target was getting their hands on $100 billion of our money to give to their mates because that is what every human wants more money. Wind turbine speculators foam at the mouth at getting their hands upon legislated subsidy because its more of an assured income that fighting every day to make a profit unexceptional but well educated politicians couldn’t care less about the effect but know belief is everything and will exploit that sectarian interest to garner votes conveniently misunderstanding the contradiction and the self deception of their behaviour. What everyone needs to do is recognise the reality that whatever cause of our climate to change or weather to be better or worse it is most likely to be completely random and continually chaotic with one system competing against another and that whatever we do we can neither change it nor manage it. The laws of physic will prevail there will be birth life and death physics goes one way only and what happens in between is unpredictable. What all of this debate makes quite clear is the fact that there are just too many people with too little to do with their lives except bicker about how to exploit the current situation for cash power influence or corruption of the politician process and that most people care too much about the rhetoric and care too little about making sure that we elect individuals who have some rigour and some sense of reality. This is true the more greed and corruption there is in the system the short will our lives be on this planet because there are only so many holes you can dig in the ground everything is finite which makes continuous argument about whether it gets hotter or colder irrelevant for me hotter is better because if it gets really bloody cold then we are all stuffed and if those who believe that the rise in temperature is only 50% of what the hawks claim it to be then we are closer to freezing to death than we are to being just a little more than warm, think the word is get a grip!!
[Slow down. Take a breathe. Calm down. Use paragraphs, sentences, punctuation. 8<) Mod]
Steven Mosher says: December 6, 2012 at 9:00 pm
“… How many excess Watts does it take to melt Greenland?…”
Good point on the wattage difference Steven, indeed not negligible.
Amazingly enough I found at least a partial answer some time ago to your question: (summary… a lot): 2 to 4 degrees in temperature PLUS 60 Wm2 extra insolation!
Re Eemian insolation forcings – according to researchers it took temperatures equivalent to future IPCC ‘no action’ projections PLUS a massive increase in isolation: 60 Wm−2 compared to the 0.85 Wm−2 loading currently estimated to occur from CO2 increases.
Significant contribution of insolation to Eemian melting of the Greenland ice sheet (2011) van de Berg etal
http://www.staff.science.uu.nl/~broek112/home_files/MB_pubs_pdf/2011_vdBerg_NatGeo.pdf
But we DO know what warm air does! It rises!
So any ‘slower cooling’ from ‘back radiation’ just means more and ‘faster rising’ to make up for it.
So take your model of more “back radiation” and air having some added warmth near the surface (temporarily). It will expand, become lighter, and head UP. The more “back radiation” induced temperature is higher than it otherwise would have been, the more and faster it rises to dump that heat at the TOA to be radiated away more effectively by those same radiating gases.
The net result of more CO2 is at most slightly faster convection during the warmest part of the day. (As temperatures cycle strongly over the course of the day, the heat is all dumped before sundown anyway. Ask any pilot when thermals happen. They start just after sun-up and run down after the sun sets.)
What about water? To the extent the surface is water, more “back radiation” makes more evaporation (and not higher temperatures). As water vapor is lighter than air, it, too, rises. In that case to eventually make clouds at altitude where it condenses and dumps the energy (and more effectively radiating the heat away).
There is simply no reason to stop the model (mental or otherwise) at the point the photon hits the dirt or CO2 molecule. We do know what happens. Hot air rises. Hotter air rises faster. The evaporation / precipitation cycle runs faster (if ‘rain is in the air’) too. What’s broken is the idea that heat “builds up”, when in reality it “travels up”…
Mosher writes “Now quickly what was the difference in watts from the sun between the LIA and today?”
A trick question? TSI is overrated. Try considering energies at specific wavelengths and then answering your own question.
E. M. Smith: “What’s broken is the idea that heat “builds up”, when in reality it “travels up'”
Agreed but there is a bit more subtlety in that clouds interact with the atmospheric window to control heat loss.
Also,. photons do not exist until the instant Poynting Vectors combine vectorially at a point.
There’s a slight problem with the “MODTRAN Radiative Forcing; Double CO2” graphic lined to by spertor and Steven Mosher (but for entirely different reasons). The emission chart doesn’t represent the equilibrium state; it’s intended to show the reduction in outgoing radiation, and the consequent forcing of an instantaneous doubling of CO2. The proof of that is the absence of change in the radiation escaping from the surface through the “atmospheric window”, wavenumber ~800-1000 on the chart and references to the same or similar charts in the scientific literature. The superimposed plots represent an unchanged surface temperature..In other words it’s the “initial conditions” for such an instantaneous doubling.
The premise that a continuing increase of CO2 would lead to a long-term reduction in radiation to space (and therefore continuous and accelerating warming) is clearly a false one. The Earth-atmosphere system would also continuously change to a new (warmer) equilibrium where outgoing radiation would rise to match the incoming (assuming all feedbacks remain constant).
edit/addendum to this post: markx says: December 7, 2012 at 3:58 am
Steven Mosher says: December 6, 2012 at 9:00 pm
“… How many excess Watts does it take to melt Greenland?…”
Amazingly enough I found at least a partial answer some time ago to your question: (summary… a lot): 2 to 4 degrees in temperature PLUS 60 Wm2 extra insolation! … to melt 30–60% of its present-day volume…
Significant contribution of insolation to Eemian melting of the Greenland ice sheet (2011) van de Berg etal
http://www.staff.science.uu.nl/~broek112/home_files/MB_pubs_pdf/2011_vdBerg_NatGeo.pdf
@AlecM:
And here I thought photons only came into existence when we chose to measure / see them after they transited the slit… er, the two slits… ;-+
http://www.doubleslitexperiment.com/
BTW, I also thought Poynting Vectors were only valid in free space (vacuum) not occupied space? (One presumes due to the molecules ‘observing’ the photons 😉
https://en.wikipedia.org/wiki/Poynting_vector
But what do I know… I haven’t observed my answer yet, so it’s both true and non-true ( or alive and dead… or meowing…and not…)
Isn’t quantum-reality fun? 😉
Speaking of which: The cloud represents condensed water, so IR loss. Yet it also blocks more (new) incoming light. Net I’d count that as heat blocking and dumping. Now it might do this over an area other then where it first formed, and that place might have some ‘retained warmth’ (from clouds at the ‘right’ height…) but that ignores what happened during the formation…
Then again, we don’t really know how to model clouds… so maybe they haven’t decided what they will do / be yet either … The ‘received wisdom’ is that clouds at one altitude cause heat retention while those at another altitude cause heat loss. Wonder what they do with clouds that change height…
Maybe I’ll go out and look at a cloud so it has to ‘make up its mind’ 😉
E.M.Smith:
The net result of more CO2 is at most slightly faster convection during the warmest part of the day.
What’s broken is the idea that heat “builds up”, when in reality it “travels up”.
Great post! Couldn’t you take this whole issue of broken reasoning and make it an article?
Can you recommend links to what exactly happens at the surface of the sea (direct evaporation, not higher temperatures? maybe both?) and to how exactly the earth is cooling by conduction, convection, evaporation and eventually radiation. Anybody? It should be easy to understand, I want to show it to a friend at the UN. Thanks a lot.
@Bair Polaire:
Probably… but not right now… It’s 4:44 AM for me, and I’ve not been to sleep in 20 hours… I’m about at my ‘end of day’ and starting a new article is not going to happen. But in about 8 hours I’ll give it a go. I’m just too ‘fuzzy’ to do it now. (And, finally, fading fast… To sleep, perhaps to dream…) But glad you like it!
There is a whole chain of “broken thought” that makes up the AGW Model. From being “All IR all the time – convection and precipitation need not apply” to simply ignoring things that are well known to matter to confounding temperature and heat to… But that is for tomorrow… (er, later today 😉
E. M. Smith: the Poynting Vector I allude to is the average energy flux for a monochromatic plane wave: qdot = epsilon c. E0^2/2. For a collimated beam it is identical to the Planck irradiance at that wavelength.
A gas may have slightly different epsilon but at the earth’s surface there will be the vector summation of the Down and Up PVs. This is a more subtle take on the standard S-B analysis which because the S-B equation is the integrated Planck function, you lose information.
@AlecM:
Did I not have enough 😉 faces on my comment to make it clear I was having a bit of fun with Q.Mech.? Ok, go ahead and be serious about it… but I can’t say “Poynting Vector” without thinking that we need “The machine that goes PIIING!” in the background somewhere 😉
Yes, they work in gases too, but with more terms… better as a thought tool, IMHO; then again, that’s what you were using them for…
I am still waiting for some credible statement as to what the optimum temperature should be. We don’t know if we are below it or above it. But this has not stopped the fretting. As an issue, global warming (er, now “climate change”) is far more about advancing central control and justifying bigger government than it is about real remediation of climate trends that is harmful to the ecosystem.
Have a look at:
http://www.metoffice.gov.uk/hadobs/hadcrut3/diagnostics/global/nh+sh/
Smoothed HadCRUT3 *has* increased since the beginning of 1998.
Something else apparent in HadCRUT3: A periodic cycle with a period around 62 years and an amplitude around .21 degree C peak-to-peak, with the most recent peak in 2004. (Assuming it’s sinusoidal, which may not be the case.) This largely explains the lack of warming since 2001, as well as about 40 of the warming that did occur from 1973 to 2004.
Something else: Although 110 of the 356 gigatons of CO2 emissions have occurred since 1998, and about 28% of the increase in atmospheric CO2 above the estimated pre-industrial level of 280 PPMV occurred since 1998, the percentage of warming from the pre-industrial to 2012 change of CO2 caused by the 1998-2012 CO2 change will be less. This is because the greenhouse gas effect of CO2 varies approximately logarhythmically with CO2 level. On a log scale, the post-1998 CO2 increase is about 23.5% of the increase above the pre-industrial estimate.
How many Watts does it take to fry a Mann?
I agree and I give you a link with numbers:
http://www.tech-know-group.com/papers/IR-absorption_updated.pdf
supplement to my earlier plot , here are the major fuel types plus the total as log plots. Here we see how the different fuels dominated different periods:
http://i45.tinypic.com/2na2zd5.png
Interesting to note the dips caused by the great depression and the two world wars and the huge change since the petrol crisis of 1973 , when we first realised that oil was not always dirt cheap and endlessly abundant.
Still the overall observation is that there are distinct periods with different growth rates but each period shows fairly constant exponential growth.
The paradox for anyone wishing to maintain the CO2 is the dominant force driving climate is that the period with most rapid growth was precisely the period when gobal temperatures COOLED.
It would seem from this evidence that either you conclude that faster growth causes global cooling (doubtful) or you realise that CO2 is NOT the dominant force. In fact not even a major player.
I still suspect CO2 has an influence but have yet to find conclusive evidence (or any evidence to be honest) of how much. In order to work that out we need to characterise and understand natural climate change.
Here’s one plot that may suggest recent warm peak was a bit bigger than the last one. Though showing that is not also part of natural variation is far from obvious, without a lot more data. It does, however, leave the door open to a reduced CO2 warming.
http://i49.tinypic.com/xbfqtw.png
Slightly OT: Bloomberg Gaia News was pushing hard this morning for stricter limits on India and China, because India is getting “hardest hit” by Evil KKKarbon. I found some records (which were surprisingly hard to find, and unsurprisingly sketchy!) and graphed Bombay and Delhi.
Results: No warming visible. Not even the expected signature of UHI.
http://www.polistrasmill.blogspot.com/2012/12/india-hardest-hit.html
Sorry for ranting… but:
tokyoboy says:
Another often overlooked fact. The ecosphere easily absorbs CO2, ANY amount of CO2, as demonstrated in – wait for it – Greenhouses. The shock of seasons is the only clearly visible and identifiable thing on the “Keeling Curve”, (other than a rise right at a time in the 70s when the energy shortage was reducing fossil fuel use, and a dip in the early 90s when Kuwait’s oil fields were burning out of control) when a significant percentage of vegetation in each hemisphere simply stops absorbing CO2 for half of the year. NOTHING in the CO2 cycle / system / flux / whatever you want to call it should be considered stable, because it’s NOT.
Since CO2 is plant food, and plants are tremendously ubiquitous, ANY extra food in the air simply gets consumed by plants, whether they’re trees, grasses, mosses, macro, micro, whatever. This is no different from the equivalent of animal populations exploding with an abundance of food and water, and dying off during shortages. It’s the reason there is a “gaia theory” – the planet is hospitable to life BECAUSE of life. Life runs this show, and we don’t control as much of the life on this planet as we often seem to think we do.
This really should cast doubt on any actual anthropogenic signal in the atmosphere in the first place. The assumption that rising CO2 is CAUSED by burning fossil fuels is, contrary to all you think you know, still not proven. It’s merely assumed.
Tom Fuller:
Ditto on human technology. NOTHING is stable. There is absolutely NO REASON to assume that we will continue as we are. Maybe a larger percentage of the world will wise up and start using Nuclear for household power. But predicting anything about technology and even what will drive our goals and civilization in 63 years is a stretch. Could anyone in 1950 have realistically even comprehended our current lifestyle, with HDTV, flat panels, microwave ovens, smartphones, GPS, fuel efficient vehicles, etc.? Not even the Science Fiction authors were even remotely close.
E.M.Smith at December 7, 2012 at 3:58 am – sums it all up. ANY radiative effect of CO2, which most of us totally agree is happening, or could happen, is dwarfed by the simple mechanics that are NOT radiative. The atmosphere is anything but still – air is constantly moving. Both warmer air and water vapor are lighter, and rise as high as they need to to cool off or condense. This is the main reason that the atmosphere has been AS STABLE as it has for billions of years – it’s not an “evolutionary” thing, it just IS. It’s how a planetary atmosphere works at this distance from the sun, with this much Nitrogen and Oxygen over a mostly water-covered planet. Tiny perturbations in atmospheric make up are simply not capable of the amazing feats of disruption we’re being warned about.
And, it’s the reason I personally have mocked and derided “warmists” for their incredible bad handle on logic. The atmosphere is an extraordinarily complex and chaotic system. There are balances and feedbacks that we have not even begun to comprehend. Gas proportions, temperatures, everything oscillates around some value, and we don’t yet know enough to reverse engineer those values. Blaming tiny, unimportant climate variations on emissions of CO2 that are massively overwhelmed by natural emissions, however, is almost as ridiculous as drawing perfectly straight “trend lines” along every increase one sees in temperature.. or sea level… or the DJIA… or… the price of pumpkins in October.
In reply to Susan S. who wrote in the link a question: http://wattsupwiththat.com/2012/12/06/a-problem-nearly-one-third-of-co2-emissions-occured-since-1998-and-it-hasnt-warmed/#comment-1166789
Here is a nice chart that are composed of many peer reviewed science papers from the 1950’s to the 1990’s that show it is less than 25 years (The high end) and always less than 15 years in the rest of the chart:
http://globalwarmingskeptics.info/thread-188-post-3118.html#pid3118
Enjoy.
“I certainly believe in it”, “I believe that”, “I still believe that”, notice the trend?
Some questions:
Do you suppose the universe cares what you believe?
If you believe something really hard, does that cause it to happen?
Who believed hard enough to cause the medieval Warm Period, the even warmer periods before that?
Is science about belief?
What is it about?
When you can answer that last question, get back to me.
Mosh:
“Now quickly …”
… another Mosher cryptogram.
Mosh, if you know the answer, good for you. Gold star. WHY NOT TELL THE REST OF US!
Now here’s a cryptogram for you: Now quickly, if 3.39 watts/m^2 is bad, what about 70 watts/m^2?
You replied “apples”? Sorry that’s not correct. Nice try though, so we’ll still give you a gold star.
70 watts/m^2 is the approximate additional solar irradiation received at TOA on Jan 3, which is the occurrence of the perihelion in Earth’s elliptical orbit around the sun. Yes, the so-called “solar constant” 1367 (or recalibrated 1362) watts/m^2 is just an average. Actually, it varies from 1345 watts/m^2 on July 3 (apihelion) to 1435 watts/m^s on Jan 3 (perihelion). (Funny how 3.39 gets lost in the noise here.)
How do you like them apples?
The optimum temperature for human beings must surely be greater than the minimum temperature that an unprotected human being can survive. Otherwise, how did we evolve?
What is the lowest temperature an unprotected human can survive? 28C/82F.
This is also the temperature of the tropical rainforests – where we came from. Without technology the heat loss from a human being is such that we cannot eat enough food to survive average temperatures below this.
The average temperature of the earth is 59F/15C. Too cold for humans without technology. Without technology humans would only be found in the tropical jungles.
EM Smith says: ”
”
“GHCN (Global Historical Climate Network – i.e. land thermometers from NOAA data copies for the globe) this graphs is IMHO about as good as you can get:
Nice graph! I would also add that the last time I analysed the data myself (GHCN V2 at the end of 2009) the corrections to the data set were an almost straight line fit from 1910 to present day with an R^2=0.93 and with a slope of +0.3 DegC per century.
Mr. Fuller: Thank you for your exposition. You show exactly why there is no equation in which CO2 concentration is the independent variable and global average temperature is the dependent variable. That theory is wrong. Given a CO2 concentration, you can’t calculate temperature. Controlling the CO2 concentration is going to control the CO2 concentration.
Plenty of other possibilities exist. Fossil fuel consumption may have risen as a result of civilizational growth which is changing some other variable. Or, there may be a more complex equation in which CO2 is a factor. We don’t know the answer. We should say that and start looking for the real answer, which is not likely to be as well funded, but more relevant. We are wasting time and resources at present.
It is not the first time, nor will it be the last, in which science vociferously supports a theory which is then falsified. It strikes me as remarkable for the degree to which scentists, activists, journalists and politicians have chosen sides. Remarkable, but hardly unique. Evolution, eugenics and phrenology come to mind.
The scientific method does not give us a way to find the correct answer. It gives us a way to disprove the wrong answer, and as always, nature gets the only vote that really counts. It seems time to back away from a proposed answer that is obviously wrong, and try again.