PART1 – (part 2 comes later today is NOW ONLINE HERE)
I’ve been noting with some humor the anticipation of a new Arctic sea ice extent minimum in the Alarmosphere. Yesterday, the frustration that there hasn’t been any major announcement yet bubbled to the surface in the form of a Michael Mann tweet, who was upset that NSIDC is making him wait:

Today though, looking at the NSIDC extent graph, he seems happy, declaring it “official”:

NSIDC made an announcement a few minutes ago, just as I started writing this post (and for that reason I’m publishing this post in two parts, see below):
Arctic sea ice appears to have broken the 2007 record daily extent and is now the lowest in the satellite era. With two to three more weeks left in the melt season, sea ice continues to track below 2007 daily extents.
Arctic sea ice extent fell to 4.10 million square kilometers (1.58 million square miles) on August 26, 2012. This was 70,000 square kilometers (27,000 square miles) below the September 18, 2007 daily extent of 4.17 million square kilometers (1.61 million square miles).
Here’s the plot, annotation mine:

Predictably, Seth Borenstein is already practicing for the big story he’ll be writing any minute now, and, the money quote he uses is just as predictable:
Data center scientist Ted Scambos says the melt can be blamed mostly on global warming from man-made emissions of greenhouse gases.
Neither Borenstein nor NSIDC’s current announcement mentions the massive Arctic storm that broke up huge amounts of sea ice, making this new record low possible. NSIDC said on August 14th:
As of August 13, ice extent was already among the four lowest summer minimum extents in the satellite record, with about five weeks still remaining in the melt season. Sea ice extent dropped rapidly between August 4 and August 8. While this drop coincided with an intense storm over the central Arctic Ocean, it is unclear if the storm prompted the rapid ice loss.
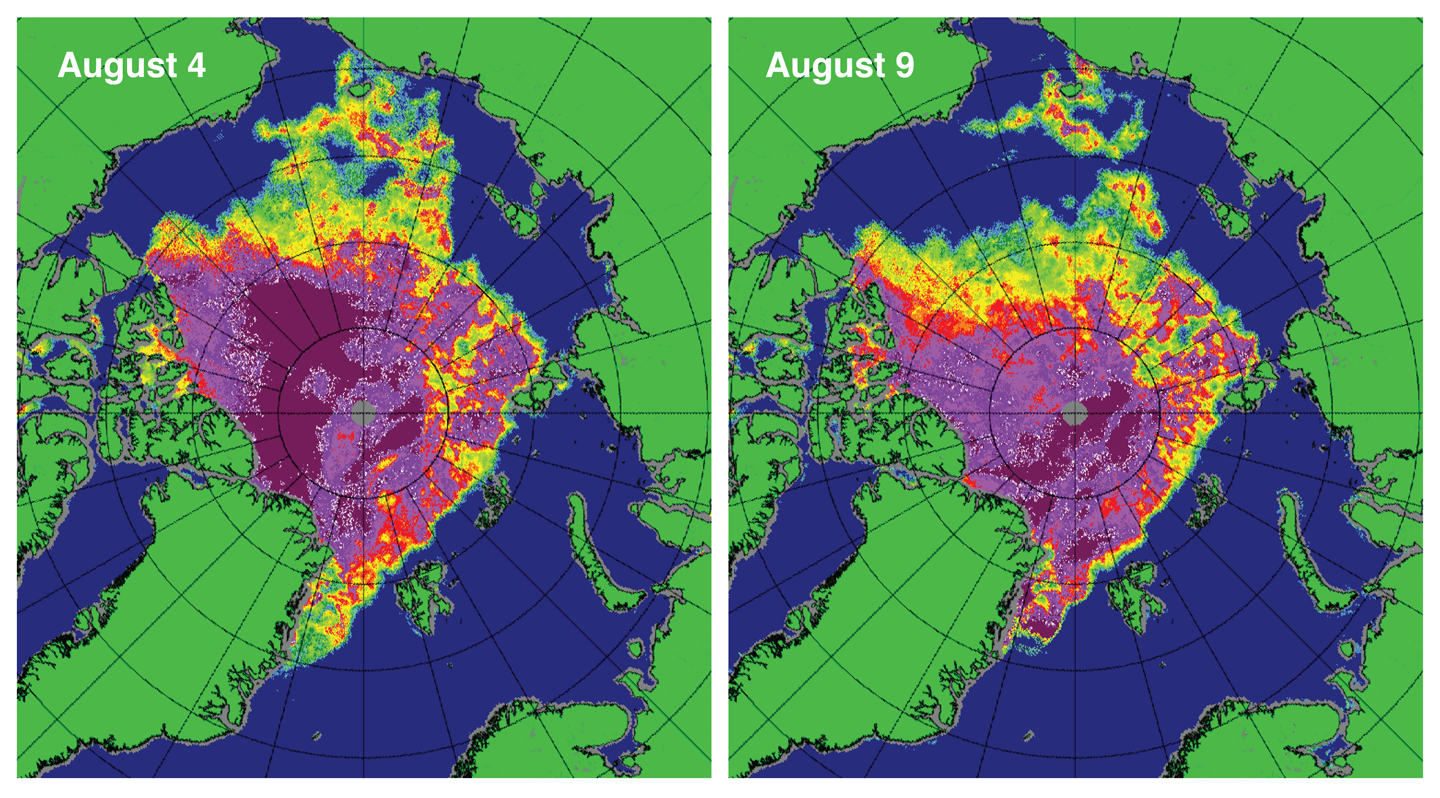
Unclear? Hmmph. Further down they dub it: “The Great Arctic Cyclone of 2012” and provide this before and after image:

Figure 4. These maps of sea ice concentration from the Special Sensor Microwave Imager/Sounder (SSMIS) passive microwave sensor highlight the very rapid loss of ice in the western Arctic (northwest of Alaska) during the strong Arctic storm. Magenta and purple colors indicate ice concentration near 100%; yellow, green, and pale blue indicate 60% to 20% ice concentration.
Credit: National Snow and Ice Data Center courtesy IUP Bremen
Calling the reason “unclear” seems more than a bit disingenuous to me, especially when you don’t mention it again.
It should be noted that in the ARCUS sea ice forecast submitted on August 5th, both NSIDC and WUWT forecasts agreed at 4.5 million sqkm. Clearly NSIDC didn’t expect this storm nor its effects, because if they had, their forecast would have been much lower.
In part two of this post, later today, I’ll share some other interesting things I’ve found that suggests NSIDC and the media aren’t telling you the full story right now.
John Haythorn,
Papers are not scientific evidence. “Evidence” is raw data, and empirical records such as the Vostok ice core record or the CET temperature record. Evidence must be testable, per the scientific method. People often confuse peer reviewed papers for evidence. They are not. And comments purporting to claim there is evidence are nothing but opinions.
Kevin Macdonald says:
“Let’s ignore the obvious non sequitur (just because increasing temperatures cause CO² levels to rise, it does not follow that Increasing CO² levels cannot cause temperatures to rise.”
Grashopper, listen and learn: there are many sources of CO2. Some produce more CO2 than others, and at different times. Due to the various sources, CO2 is emitted more, or less, at any specific time. Thermohaline circulation is one example of a CO2 source that is responding to the temperatures of 800 – 1000 years ago. That was during the global warming episode known as the Medieval Warming Period.
And as I have regularly pointed out, net CO2 emisssions follow temperature changes, on all time scales out to hundreds of millennia. There is irrefutable scientific evidence verifying that fact. But there is no scientific evidence showing that CO2 leads temperature or that human CO2 emissions cause measurable global warming.
Conclusion:global warming causes rising CO2. Not vice-versa.
David A. Evans says:
August 27, 2012 at 10:24 am
JohnB says:
August 27, 2012 at 9:56 am
REPLY: Thanks Walt, have you ever considered we may be at/near the bottom of a natural cycle? How can you rule that out without data much beyond 30 years? There’s historical anecdotal evidence of very low Arctic sea ice in the past where you have no data. – Anthony
——————-
Anthony, what evidence would that be?
How’s this?
Within 5° of the pole & no ice, that’s 300nm.
As I recall Syedoff was frozen in on Dec 18th & free again by Valentines day 1939.
_______________
I believe that your interpretation of this article is deficient. What is being discussed is an in-ice-pack drift, not a free water drift. This is even implied in the article:
Note that the article is also deficient in a number of other areas. One easy to check area is the section that claims:
A relatively simple googling of “spitzbergen cod” led quickly to the bookNorwegian Spring-Spawning Herring & Northeast Arctic Cod: 100 Years of Research and Management, which notes:
Clearly, if the fishery off Spitzbergen in 1878 was well enough known that scientists were examining the fish (to determine spawning locations), then they are not new to the area in the 1938 timeframe of the news article. Another point is the correlation between Cod Liver Oil and Norway’s ownership of Spitzbergen after WW1 – See this newspaper article from the Milwaukee Sentinel, Dec. 14th, 1926 for more information. This is not proof positive, but does imply the link between Spitzbergen and cod.
Likewise, the discussion of Cod off Spitzbergen as found in “The Zoologist: A Monthly Joournal of Natural History”, Third Series, Vol. VI, pg 417 (published in1882) also shows that cod were known to be present much earlier than the implication in the article.
If you want to offer proof, I suggest finding a better example.