I have been asked to present this for review by readers here, and to solicit critical comments for the purpose of improving the presentation. Moderators please remove any off-topic comments and commenters please stick to the issues of review. – Anthony
[…]
Now, about the climate science:
‘‘It’s unchallengeable that CO2 traps heat and warms the Earth and that burning fossil fuels shoves billions of tonnes of CO2 into the atmosphere,”
“But where you can get challenges is on the speed of change.”
— Professor John Beddington
The British government’s chief scientific adviser, John Beddington, has called for more openness in the global warming debate. He said climate scientists should be less hostile to sceptics who questioned man-made global warming. He condemned scientists who refused to publish the data underpinning their reports. He also said public confidence in climate science would be improved if there were more openness about its uncertainties, even if that meant admitting that sceptics had been right on some hotly disputed issues.
“I don’t think it’s healthy to dismiss proper scepticism. Science grows and improves in the light of criticism. There is a fundamental uncertainty about climate change prediction that can’t be changed.” [As reported in The Australian“i. Other reports were similar.]
I would like [the two speakers] to address the specific issue of the deleted data in reconstructed temperature graphs.
The issue is as follows: In their third report (“TAR”), the IPCC published the following graphii:

This is a graph of several temperature proxies, with the instrumental temperature record from around 1900 added. What it shows is that temperatures had been declining fairly steadily for nearly 1000 years, but then suddenly shot up in the 20th century.
It has now been discovered that some of the data series had been truncated in the graph. The result of these truncations was to make the data series look more consistent and therefore convincing. (NB. I make no statement about intent.). If the data series had not been truncated, the end result would have been very differentiii:

The two red segments are the truncated data. These two segments and the dotted curve connecting them are a single data series “Briffa-2000”1. Note that the first downward segment of the black graph (instrumental temperature) has also been deleted in the version used by the IPCC.
The extreme divergence between the “Briffa-2000” proxy and the instrumental temperature record shows that this proxy is completely unreliable (the “divergence problem”). To delete segments from the graph – especially without a prominent explanation – is bad scientific practice. Contrary to claims by various climate scientists, the deletions were not disclosed in the TAR. Nor was the “divergence problem” discussediv. As Professor Richard A Muller of University of California, Berkeley, has said “You’re Not Allowed to Do This in Science“v.
Was the “Briffa-2000” data series the only unreliable proxy data series? It seems not. Phil Jones’ 1999 “Climategate” email indicated that other proxy data series had been truncated to “hide the decline“vi.
It has been argued that this “hide the decline” graph (aka the hockey-stick) is not important in the overall scheme of things, ie. in climate science as a whole. Gavin Schmidt put it this way on RealClimate.com, “if cherry-picked out-of-context phrases from stolen personal emails is the only response to the weight of the scientific evidence for the human influence on climate change, then there probably isn’t much to it.“vii.
Unfortunately, the “hide the decline” graph is much more important than that. In the fourth IPCC report (“AR4”), the effect of solar variation on climate is discussed. Theories such as Henrik Svensmark’s are dismissed as “controversial” and then ignoredviii. Consequently, solar variation is included in the climate models purely as the direct climate forcing from total solar irradiation (TSI). Since variations in TSI are quite small, in percentage terms, the climate models allow only for small temperature changes from TSI changes.
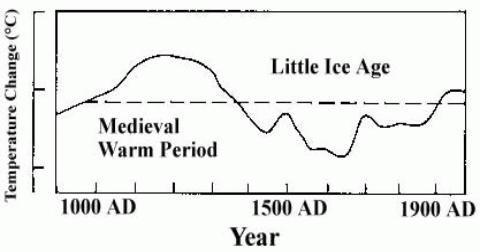
Such small temperature changes are quite consistent with the “hide the decline” graph, because that graph shows only small temperature changes prior to the 20th century. If the IPCC had persisted with their original estimate of earlier temperatureix …

… then the climate models would have been unable to replicate the temperature changes in either the MWP or the LIA, because the total effect of all natural factors (including TSI variation) allowed for in the models is far too small. If the climate models were unable to replicate the MWP and LIA, then they would lack credibility, and any scientific conclusions based on the models could be disregarded.
But it gets worse.
With the “hide the decline” graph representing global temperature, the climate modellers had only one factor which could give a sudden upward movement in temperature in the 20th century – CO2. This was the only factor whose pattern changed significantly then and only then. The IPCC analysis is based on “equilibrium climate sensitivity” (ECS), which is defined as the equilibrium change in the annual mean global surface temperature following a doubling of the atmospheric equivalent carbon dioxide concentrationx. The way ECS was arrived at was to map the 20th-century temperature rise to the increase in CO2 concentration : “Estimates of the climate sensitivity are now better constrained by observations.“xi.
The IPCC and the climate modellers still had a problem: the scientific studies on CO2, and the physical mechanism by which it warmed the atmosphere, gave an ECS which was far too low. But the discrepancy was explained by climate feedbacks. A climate feedback is defined as follows: “An interaction mechanism between processes in the climate system is called a climate feedback when the result of an initial process triggers changes in a second process that in turn influences the initial one. A positive feedback intensifies the original process, and a negative feedback reduces it.“xii
This leads us to clouds. The IPCC state repeatedly that they do not understand clouds, and that clouds are a major source of uncertainty. For example: “Large uncertainties remain about how clouds might respond to global climate change.“xiii There are many statements along these lines in the IPCC report. Now simple logic would lead one to think that clouds would be a negative feedback:- as CO2 warms the oceans, the oceans release more water vapour, which forms clouds, which have a net cooling effect (“In the current climate, clouds exert a cooling effect on climate (the global mean CRF [cloud radiative forcing] is negative).“xiv).
But the IPCC report claims that clouds are a massive positive feedback: “Using feedback parameters from Figure 8.14, it can be estimated that in the presence of water vapour, lapse rate and surface albedo feedbacks, but in the absence of cloud feedbacks, current GCMs would predict a climate sensitivity (±1 standard deviation) of roughly 1.9°C ± 0.15°C (ignoring spread from radiative forcing differences). The mean and standard deviation of climate sensitivity estimates derived from current GCMs are larger (3.2°C ± 0.7°C) essentially because the GCMs all predict a positive cloud feedback (Figure 8.14) but strongly disagree on its magnitude.“xv.
The IPCC provide no mechanism, no scientific paper, to support this claim. It comes in some unspecified way from the climate models themselves, yet it is acknowledged that the models “strongly disagree on its magnitude“.
So, to sum up, the situation is that the “hide the decline” graph leads to nearly all of the 20th-century warming being attributed to CO2, thanks to a factor (clouds) which is not understood, is not explained, and comes from computer models which strongly disagree with each other. The inevitable conclusion is that without the “hide the decline” graph, the clouds “feedback” as described in the IPCC report would not have existed.
Now, returning to Gavin Schmidt’s comment. When he talks about “the weight of the scientific evidence for the human influence on climate change“, a very large part of that evidence is the IPCC report and everything that references it. But as I have just shown, the IPCC report itself relies for its credibility on the “hide the decline” graph. In other words, the entire structure of mainstream climate science depends on a single work which is itself based on methods which are “not allowed” in science.
So of course there are, in Professor Beddington’s words, challenges on the speed of change. If the MWP, which was of course completely natural, was about as warm as today, then it is entirely reasonable to suppose that natural factors are largely responsible for today’s warm temperatures too, and that the speed of change from CO2 has been grossly overstated by the IPCC.
Mike Jonas
References:
1 There are number of different versions of this graph, in the various IPCC reports and elsewhere, where different versions of the proxy data have been used.
viii http://www.ipcc.ch/pdf/assessment-report/ar4/wg1/ar4-wg1-chapter2.pdf para 2.7.1.3
ix http://climateaudit.files.wordpress.com/2008/05/lambh23.jpg (I could not provide a link to this graph in an IPCC web page, because earlier IPCC reports are no longer linked there. http://www.ipcc.ch/publications_and_data/publications_and_data_reports.shtml)
xi http://www.ipcc.ch/pdf/assessment-report/ar4/wg1/ar4-wg1-chapter9.pdf Executive Summary.
xiii http://www.ipcc.ch/pdf/assessment-report/ar4/wg1/ar4-wg1-ts.pdf para TS.6.4.2
eadler says that Mann has “supplied a full corrected listing of the data. They included an archive of all the data used in MBH98.”
Adler is knowledgeable enough of the circumstances to know that his statement is not true. Mann has never publicly archived his data, methods, metadata or code, despite constant requests over the past 13 years. He cannot do so, because it would then be clear to everyone that he had fabricated his results, and he would face charges of scientific misconduct.
Further, Adler uses Mann’s own words as the basis for his claim that Mann had simply made “errors.” That is not true. There were not “errors,” there was deliberate misuse of the data, methodology and code to arrive at a result that fitted Mann’s agenda, which was to erase the MWP and the LIA, thus falsely showing that current temperatures are “unprecedented.”
Adler must know he is not being truthful when he states that Mann “included an archive of all the data used in MBH98”, and quoting Mann’s false assertion that “None of these errors affect our previously published results.” Hiding the data that would have eliminated his coveted hockey stick is as egregious as claiming that Mann has archived “all the data.”
In fact, if he had included the “censored” data, Mann’s fabricated hockey stick would have been erased. And Mann ’08 was just as knowingly dishonest. By simply not using the Tiljander proxy, Mann’s new ’08 hockey stick would have been non-existent. So he had to use a corrupted proxy to get what he wanted. The key point is that Mann had been informed before he published that the Tiljander proxy was corrupted, and that it was no good as supporting data.
Yet Mann dishonestly published anyway, without any explanation in his paper for the use of Tiljander’s bad proxy. Is that what an honest person would do? It was also extremely foolish, as Mann was aware that Steve McIntyre was scrutinizing his work. But Mann arrogantly assumed that because he has the climate peer review referees and journals under his thumb, he could get away with his deception.
Mr Adler, your false claims have been decisively refuted here by several other commentators. Strong opinions are one thing. But misrepresenting the record is mendacious, and unacceptable here.