I have been asked to present this for review by readers here, and to solicit critical comments for the purpose of improving the presentation. Moderators please remove any off-topic comments and commenters please stick to the issues of review. – Anthony
[…]
Now, about the climate science:
‘‘It’s unchallengeable that CO2 traps heat and warms the Earth and that burning fossil fuels shoves billions of tonnes of CO2 into the atmosphere,”
“But where you can get challenges is on the speed of change.”
— Professor John Beddington
The British government’s chief scientific adviser, John Beddington, has called for more openness in the global warming debate. He said climate scientists should be less hostile to sceptics who questioned man-made global warming. He condemned scientists who refused to publish the data underpinning their reports. He also said public confidence in climate science would be improved if there were more openness about its uncertainties, even if that meant admitting that sceptics had been right on some hotly disputed issues.
“I don’t think it’s healthy to dismiss proper scepticism. Science grows and improves in the light of criticism. There is a fundamental uncertainty about climate change prediction that can’t be changed.” [As reported in The Australian“i. Other reports were similar.]
I would like [the two speakers] to address the specific issue of the deleted data in reconstructed temperature graphs.
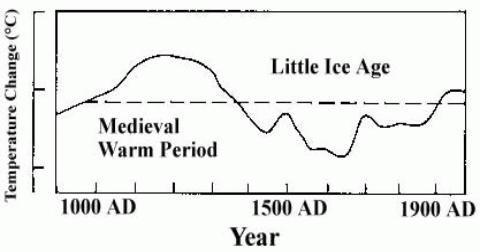
The issue is as follows: In their third report (“TAR”), the IPCC published the following graphii:

This is a graph of several temperature proxies, with the instrumental temperature record from around 1900 added. What it shows is that temperatures had been declining fairly steadily for nearly 1000 years, but then suddenly shot up in the 20th century.
It has now been discovered that some of the data series had been truncated in the graph. The result of these truncations was to make the data series look more consistent and therefore convincing. (NB. I make no statement about intent.). If the data series had not been truncated, the end result would have been very differentiii:

The two red segments are the truncated data. These two segments and the dotted curve connecting them are a single data series “Briffa-2000”1. Note that the first downward segment of the black graph (instrumental temperature) has also been deleted in the version used by the IPCC.
The extreme divergence between the “Briffa-2000” proxy and the instrumental temperature record shows that this proxy is completely unreliable (the “divergence problem”). To delete segments from the graph – especially without a prominent explanation – is bad scientific practice. Contrary to claims by various climate scientists, the deletions were not disclosed in the TAR. Nor was the “divergence problem” discussediv. As Professor Richard A Muller of University of California, Berkeley, has said “You’re Not Allowed to Do This in Science“v.
Was the “Briffa-2000” data series the only unreliable proxy data series? It seems not. Phil Jones’ 1999 “Climategate” email indicated that other proxy data series had been truncated to “hide the decline“vi.
It has been argued that this “hide the decline” graph (aka the hockey-stick) is not important in the overall scheme of things, ie. in climate science as a whole. Gavin Schmidt put it this way on RealClimate.com, “if cherry-picked out-of-context phrases from stolen personal emails is the only response to the weight of the scientific evidence for the human influence on climate change, then there probably isn’t much to it.“vii.
Unfortunately, the “hide the decline” graph is much more important than that. In the fourth IPCC report (“AR4”), the effect of solar variation on climate is discussed. Theories such as Henrik Svensmark’s are dismissed as “controversial” and then ignoredviii. Consequently, solar variation is included in the climate models purely as the direct climate forcing from total solar irradiation (TSI). Since variations in TSI are quite small, in percentage terms, the climate models allow only for small temperature changes from TSI changes.
Such small temperature changes are quite consistent with the “hide the decline” graph, because that graph shows only small temperature changes prior to the 20th century. If the IPCC had persisted with their original estimate of earlier temperatureix …

… then the climate models would have been unable to replicate the temperature changes in either the MWP or the LIA, because the total effect of all natural factors (including TSI variation) allowed for in the models is far too small. If the climate models were unable to replicate the MWP and LIA, then they would lack credibility, and any scientific conclusions based on the models could be disregarded.
But it gets worse.
With the “hide the decline” graph representing global temperature, the climate modellers had only one factor which could give a sudden upward movement in temperature in the 20th century – CO2. This was the only factor whose pattern changed significantly then and only then. The IPCC analysis is based on “equilibrium climate sensitivity” (ECS), which is defined as the equilibrium change in the annual mean global surface temperature following a doubling of the atmospheric equivalent carbon dioxide concentrationx. The way ECS was arrived at was to map the 20th-century temperature rise to the increase in CO2 concentration : “Estimates of the climate sensitivity are now better constrained by observations.“xi.
The IPCC and the climate modellers still had a problem: the scientific studies on CO2, and the physical mechanism by which it warmed the atmosphere, gave an ECS which was far too low. But the discrepancy was explained by climate feedbacks. A climate feedback is defined as follows: “An interaction mechanism between processes in the climate system is called a climate feedback when the result of an initial process triggers changes in a second process that in turn influences the initial one. A positive feedback intensifies the original process, and a negative feedback reduces it.“xii
This leads us to clouds. The IPCC state repeatedly that they do not understand clouds, and that clouds are a major source of uncertainty. For example: “Large uncertainties remain about how clouds might respond to global climate change.“xiii There are many statements along these lines in the IPCC report. Now simple logic would lead one to think that clouds would be a negative feedback:- as CO2 warms the oceans, the oceans release more water vapour, which forms clouds, which have a net cooling effect (“In the current climate, clouds exert a cooling effect on climate (the global mean CRF [cloud radiative forcing] is negative).“xiv).
But the IPCC report claims that clouds are a massive positive feedback: “Using feedback parameters from Figure 8.14, it can be estimated that in the presence of water vapour, lapse rate and surface albedo feedbacks, but in the absence of cloud feedbacks, current GCMs would predict a climate sensitivity (±1 standard deviation) of roughly 1.9°C ± 0.15°C (ignoring spread from radiative forcing differences). The mean and standard deviation of climate sensitivity estimates derived from current GCMs are larger (3.2°C ± 0.7°C) essentially because the GCMs all predict a positive cloud feedback (Figure 8.14) but strongly disagree on its magnitude.“xv.
The IPCC provide no mechanism, no scientific paper, to support this claim. It comes in some unspecified way from the climate models themselves, yet it is acknowledged that the models “strongly disagree on its magnitude“.
So, to sum up, the situation is that the “hide the decline” graph leads to nearly all of the 20th-century warming being attributed to CO2, thanks to a factor (clouds) which is not understood, is not explained, and comes from computer models which strongly disagree with each other. The inevitable conclusion is that without the “hide the decline” graph, the clouds “feedback” as described in the IPCC report would not have existed.
Now, returning to Gavin Schmidt’s comment. When he talks about “the weight of the scientific evidence for the human influence on climate change“, a very large part of that evidence is the IPCC report and everything that references it. But as I have just shown, the IPCC report itself relies for its credibility on the “hide the decline” graph. In other words, the entire structure of mainstream climate science depends on a single work which is itself based on methods which are “not allowed” in science.
So of course there are, in Professor Beddington’s words, challenges on the speed of change. If the MWP, which was of course completely natural, was about as warm as today, then it is entirely reasonable to suppose that natural factors are largely responsible for today’s warm temperatures too, and that the speed of change from CO2 has been grossly overstated by the IPCC.
Mike Jonas
References:
1 There are number of different versions of this graph, in the various IPCC reports and elsewhere, where different versions of the proxy data have been used.
viii http://www.ipcc.ch/pdf/assessment-report/ar4/wg1/ar4-wg1-chapter2.pdf para 2.7.1.3
ix http://climateaudit.files.wordpress.com/2008/05/lambh23.jpg (I could not provide a link to this graph in an IPCC web page, because earlier IPCC reports are no longer linked there. http://www.ipcc.ch/publications_and_data/publications_and_data_reports.shtml)
xi http://www.ipcc.ch/pdf/assessment-report/ar4/wg1/ar4-wg1-chapter9.pdf Executive Summary.
xiii http://www.ipcc.ch/pdf/assessment-report/ar4/wg1/ar4-wg1-ts.pdf para TS.6.4.2
Leif Svalgaard “It is not the deletion that was bad, but the retention. ”
I haven’t followed this too closely but something seems wrong here. The Briffa data that was retained matches very closely with the other reconstructions, but the data that diverged was thrown out. This still seems like observational bias. Until you understand what’s wrong with the data, how do you know which data to throw out? Perhaps the Briffa data is right and the others are wrong.
MikeEE
I would echo the comments of Peter2108 and particularly the Scottish Sceptic.
Without providing the details of who the audience is, what vehicle this will be placed into (blog post, journal, book, etc) it is not reasonable to request a review.
There is merit in putting this all together, but it must be done very well.
Overall I found the piece did not have a good flow, more of a series of related facts. As others have commented you have to be very careful with the tone and presentation. For example, stating that “the IPCC and the climate modellers still had a problem”, particularly the use of the word problem, suggests you believe the IPCC had a pre-determined outcome they were trying to fabricate. Even if this is true, it takes away from your message and needs to be re-phrased. You need to be abundantly, even over-the-top objective.
I suggest incorporating the input you have received so far and re-post with the contextual pieces listed in the Scottish Sceptics comments.
All – Thanks for the time you have put into your comments thus far. I have regarded all comments as constructive. especially those which make me reassess whether what I wrote really was correct. Actually, that was the purpose of putting it here for review.
I am trying to incorporate a number of comments at least to some extent, especially those to do with format and those disputing or correcting what I wrote, but I haven’t necessarily responded here..
The document isn’t intended for formal publication. For a forthcoming event, I want to put a statement in front of a ‘panel of experts’ which will help them to see that there is substance behind climate scepticism. As some here have pointed out, there is nothing new in what I have said. There isn’t intended to be. I am trying to extract one line of argument, from all the debate that has raged to date, that addresses the core of AGW and shows there are valid reasons to think it is wrong. IMHO we desperately need such a statement on the web, but a comprehensive one, not just a single line of argument. Easier said than done.
—–
Richard S Courtney :-
Thanks for your comment. I have enjoyed and learned from many of your comments in the past.
You put up three assumptions, and said “<there are reasons to dispute each of them“. I don’t have any argument with that, but I would have to be able to produce the reasons if I started there.
I do disagree with you wrt the MWP.
Firstly, you say “The existence of the MWP only has relevance to the AGW-hypothesis in that the MWP reveals a degree of natural global temperature change which must be exceeded before any such change can logically be ascribed to be evidence of a recent anthropogenic effect on global temperature change.“. I don’t think that way. It is hypothetically possible that past temperatures could have been higher than today’s, without that falsifying AGW. eg, certain factors might have been stronger then than they are now, The important thing is to be sure that enough factors have been identified and quantified, for us to have confidence in our understanding of climate.
Secondly, you say “The first two IPCC Reports accepted the MWP existed and each of them included the same (unnumbered) graph that is in your paper and shows the MWP“. But their claimed level of certainty was low. I don’t think they could get their claimed level of certainty up to a credible level, without getting rid of the MWP. I see this as their core weakness, and in my document, I try to follow the evidence which exposes it.
Finally, you say “The magnitude of the MWP as indicated by Briffa, Mann, Bradley, et al. plays no part in this; how could it when their data indicates that the magnitude of the MWP was zero?“. But that surely is the whole point. Their data indicates that the MWP was ‘zero’. Their models match their data. But their data was flawed and there really was a MWP. Therefore their models are wrong.
I take your points on clouds and aerosols. But I don’t think I need them for my core argument. It is sufficient that the IPCC have to draw heavily on clouds (which they don’t understand) to make their case, and that the case collapses if clouds don’t perform in the way they claim.
—–
Laws of Nature – I don’t dispute your calculations, but I have tried to avoid that level of detail. I think my argument stands up without it.
Mindbuilder – I would need a link in order to assess your comment.
berniel – I think the reality is the opposite of what you portray. The AGW case depends on the MWP being split up and spread around in time. But thanks for the comment anyway, I’ll check up on what data there is globally.
kwik says:
March 27, 2011 at 11:06 pm
TFN Johnson says:
March 27, 2011 at 10:16 pm
“It’s good to see Beddington moving on, in only a few weeks, from asking for ‘zero tolerance’ for climate sceptics to this new position. ”
Hmmm, it seems Beddington will be on the BLACKLIST now?
Anyway, it is all too late;
http://thescotsman.scotsman.com/latestnews/Brown-Fifty-days–to.5747301.jp
haha!
Seems Brown’s forecast on climate change was no more accurate than many of his economic forecasts! Good riddance!!
Scottish Sceptic says:
March 28, 2011 at 12:41 am
I had much the same thoughts. I can’t do a better job of outlining my objections, except perhaps to reference or repeat mosh’s blurt.
R.Gates says:
“…………….. It gets rather discouraging to see quotes from discussion between professionals taken out of context, when the full meaning and intent among those professionals could be easily explained if non-professionals would truly understand the full context.”
“……………………………………………………Obviously, there was something wrong with the accuracy of what the tree-rings were showing, and so the data was, quite justifiably truncated.”
Sorry old chap but the Agw story is far, far, too big, and its ramifications too consequential, for it to be the sole preserve of climate scientists. Few climate scientists are mathematicians of note and few even rank as accomplished statisticians. Practically none could get a job as a computer programmer. Judgement of fraud is not a province reserved to scientists, whatever the field of manipulation, and in the view of many of us truncation (as opposed to rejection) of data, is prima facie fraud. If you present me with statistical analysis which includes truncated data, and you do not tell me in large and prominent print that this is the case, then you are a brave man or a foolish one.
R.Gates says:
“Obviously, there was something wrong with the accuracy of what the tree-rings were showing, and so the data was, quite justifiably truncated.”
The honest analyst rejects unreliable data in its entirety. The defrauder truncates.
It is amazing that no commenter here have read Dr Noor Van Andel paper here http://climategate.nl/wp-content/uploads/2011/02/CO2_and_climate_v7.pdf which was the basis of a presentation to KNMI in February of this year. Van Andel has analysed actual measured data and concludes that CO2 does not warm the atmosphere but only serves the cool (by radiation to space) at the top of the atmosphere. How about Willis giving a review of this paper.
It is very clear that few (apart from engineers who deal continually with heat transfer) understand the Stefan-Boltzman equation which in its orignal form without emissivity factors, view factors and other corrections only applies to black bodies. The definition of a black body is as follows (Perry’s Chemical Engineering Handbook) “The characteristic properties of a blackbody are that it aborbs all the radiation incident on its surface and that the quality and intensity of the radiation it emits are completely determined by its temperature. ” Two points should be well known a) the gas CO2 is not a surface b) the gas CO2 has only strong absorption at the wavelengths 15 micron and 4.3 micron (according to the climate science guru Sir John Houghton). CO2 is not a blackbody and the Stefan-Boltzman equation can not be applied directly to it. The famous chemical engineer Prof Hoyt Hottel developed an equation, from his and many others’ extensive research in furnaces and heat exchangers, which allows the calculation of the absorptivity and emissivity of gases containing CO2. Assuming an atmosphere height of 8km and averaging temperatures and pressures between the surface and at 8km I have calculated that the absorptivity/emissivity of the CO2 component of the atmosphere is insignificant (less than 0.01). This would explain Van Andel’s and Miskolczi’s analyses and also the failures of models which including CO2 to predict anything.
I’d call that a “very major point”.
This should have been made clear at the beginning, as Scottish Skeptic and others have gotten the impression that this was a draft of a scholarly paper aimed at a scientific journal (that’s the usual context for ‘peer review’), and as such did not measure up. If this is just part of a general work aimed at a lay audience, that’s another matter entirely.
/Mr Lynn
MikeEE says:
March 28, 2011 at 6:17 am
Until you understand what’s wrong with the data, how do you know which data to throw out? Perhaps the Briffa data is right and the others are wrong.
If you throw away as much as they did, you can have little confidence in any of it, and are better served by throwing it all out.
I have often wondered where are the trees, from which the proxy records are derived, located. Are they situated in remote locations far from human habitation? And where are the sites for the weather stations, from which the temperature records are derived, located. Are they situated at airports or other places where urban development has occurred? Is it possible that the divergence problem is a reflection of the UHI effect? Perhaps my suggestion is too simplistic but I would be interested in what others think.
I’ve always had difficulty understanding why tree-rings are considered temperature proxies. One summer, as a teen, I worked on a crew that hired out to different farmers every week. One week, we came to this farm where the fellow had a particularly bad weed problem. In one part of his field, the weeds were so dense, they were competing with each other for sunlight. They had grown 5 feet high and had spindly, thin stems. They could barely stay upright without leaning on the neighbouring weeds. Meanwhile, not 50 metres away, in the same field, the weed problem was not so bad. The same variety of weed was only 2 feet high and its stem was three times as thick. If the stem width is taken as a proxy for temperature, then one would conclude that the temperature of the portion of field with the lesser weed problem was much higher than the extremely weedy region just 50 metres away.
Now, you may argue that these are weeds, and not trees, but I have witnessed the same growth pattern in trees, just not with the kind of juxtaposition that the weed example gives. The weeds did all their growth in one summer. Trees, of course, grow much more slowly, and the difference from one year to the next is not as simple to see. That being said, who has not seen tall, thin trees in the middle of the forest, versus a wide, spreading tree in the middle of a field?
It seems to me, that there are just too many variables in plant growth to say for certain that temperature is the only variable upon which tree-ring width depends. The divergence problem certainly reinforces this for me, and, as a result, any past temperature study that relies on tree-rings, I will forever remain sceptical of.
I would like the two speakers to address the validity of tree ring density as used for temperature reconstruction. There is more than just the issue of Briffa involved.
From 1000 to about 1850 we’re comparing tree rings to themselves. How is that valid? With the diligence of Steve McIntyre, Mann has admitted that no chronology using tree ring density can be validated prior to 1500CE, so the graph presented in the head post should have a demarcation line at that point with a big banner stating that anything prior to this is pure guesswork.
@R Gates
You forgot to include a mention of the 40% increase in CO2 in the past while.
http://www.skepticalscience.com/Tree-ring-proxies-divergence-problem.htm, says “Tree-ring growth has been found to match well with temperature and hence tree-rings are used to plot temperature going back hundreds of years…”
Well they are not really plot of temperature, they are plots of tree ring widths. As Briffa has shown very well, the relationship between ring width and temperature is at best an occasional correlation. Sometimes it is indicative and sometimes it is not. Lief is right: delete them all because they are not telling us anything reliable to begin with.
I must say I find the argument you presented about how the divergence problem was noted and discussed seems to me aimed at legitimising the partial deletion. That seems to be your core message: because it was noted as a problem, there is no problem, basically. That is not logical. Others above have pointed it so I won’t repeat the obvious.
The point is, tree rings are proxies, a substitute that maybe indicates something. If it diverges from real temperatures, then it not a skilled proxy. The proxy becomes one by a process of analysis of raw data. It is clear that the person creating the proxy relationship lacks the skill needed to render a meaningful temperature value set. If the skil was there, there would not be such huge divergences at each end.
Your frequent statement that CO2 has increased 40% and the temperature has gone up [about 0.7 C] is made to support your contention that CO2 is a principal driver of temperature and therefore climate. Well, one can perhaps make a case that it is a principal driver of tree ring width but Briffa shows us that it does a poor job of that, especially during the times when we know what the temperatures are. Delete the lot.
There is another possible interpretation of this ‘divergence’. It is that above a certain temperature, the tree ring response to an increase in temperature is to decline in width. There is perhaps a tipping point for tree rings.
Now, looking back at ice core-derived temperatures, we know it was much warmer in the MWP. If the temperature in 1960 reached the tree ring width tipping point, and the ring width declined, we can use that as the reference/calibration period. Increased temperature above a certain value = narrower rings. Interesting. We have the facts at hand.
Now, look back at Briffa’s pre-1500 data. What do you see? Narrowed rings! Why? Because it was warmer! And you can tell how much warmer because of the continuing narrowing of the rings. So do the Mannly thing and flip the chart over from that point, using the 1960 temperature as the tipping/flipping value.
Lo and behold the correct temperature comes clearly into view. The new chart matches the real MWP temperatures and the 1960-2000 as well.
So you can in fact get the correct MWP nad modern temperatures by correctly processing another flipping graph from the Team.
R. Gates says:
March 27, 2011 at 9:56 pm
It would seem apparent that an honest discussion about the true context of the “hide the decline” comment would be in order to really get at the meaning and intent when discussing its ramifications in any type of paper. This is especially true when bringing up the issue of truncated data, and reasons why it may be indeed a prudent thing to have truncated certain data. It gets rather discouraging to see quotes from discussion between professionals taken out of context, when the full meaning and intent among those professionals could be easily explained if non-professionals would truly understand the full context.
The “hide the decline” is of course referring to the apparent decline in temperature in the high northern latitudes as shown in in tree-ring data from about 1960. This divergence of reconstructed temperatures shown in tree-ring data after 1960 in HIGH NORTHERN LATITUDES diverges from the actual measured temperatures during this period, as there were actual measurements of temperatures during this period. This “problem” is known among professionals as the “divergence” problem……………….
Others have commented on the deletion of invalid proxy data.
I would add that your emphasis on ‘HIGH NORTHERN LATITUDES’ seems not to have been the aim of the team. These trees in Yamal were ‘teleconnected’ to the other trees on the planet (try selling that to the man on the Clapham Omnibus!). So the few tree rings in Yamal that were assessed were taken to indicate the temperature of the planet!?
Can you imagine a television weather forecaster (Anthony could do this I am sure) standing by a single tree in Siberia and using it to forecast the climate in California?
“You see..”, he looks around furtively and continues in a whisper, “this tree”, he strokes Yamal-061, ” is ….. tele-conn-ected….”, he looks around and shuffles closer. “So I can tell you now this tree is saying that there’ll be no snow in the Sierra Nevada…” his voice rises to a hoarse stage whisper, “and people will die!!!..” he pauses to wipe spittle from his mouth…..
There is evidence that the trees might be right and the instrumental record wrong. Anthony Watts sent swarms of volunteers scouring America to find our weather stations and photograph them. They were often found on asphalt (known to raise temperatures), or even next to air conditioners or other prodigious heat sources. Only 11 percent were well sited.
Satellite data had indicated a slight cooling trend in the 90’s–the very period where alarmists were screaming “hockey stick.”
If this were an article for publication, I would include the dramatic graph published here a month or two ago comparing numbers of weather stations versus claimed instrumental temperature measurements.
There is a real hockey stick phenomenon going on–in cities. I live in a four-building apartment complex. Our large front and back yards are still dead-looking, late winter conditions in Aurora Colorado. But between two buildings, there is a garden that turned quite green a few weeks ago. It already has several lovely flowers and vigorous growth of green leaves. This urban heat island is a blessing.
The urban heat island effect is a blessing for many wild creatures, too. A 2006 paper (1) found that opossums have extended their range northward in Massachusetts, into urban areas. In these northern extensions, they are found near roads and other human places, but in their traditional, more southern ranges, they are found in forests, away from people.
There has been relatively little study of urban ecology, or ways to increase urban biodiversity. Such studies might prove very useful. For example, one of America’s most endagered animals is the black-footed ferret, which feeds on prarie dogs. Prairie dog density is often higher in urban parks and open fields than it is in nearby rural areas. Thus, these animals could thrive in urban conditions. This is especially critical because the primary threat to the ferrets is sylvatic plague–which can be prevented by human intervention, putting pulicides (flea-killers) into prairie dog burrows (2). One tends to find a lot of humans in urban habitats, so urban releases would be easier to monitor and protect than rural ones.
AGW is part of a general movement of human-bashing. It is certainly true today that ecological studies find crashing biodiversity as one moves from rural to urban areas. But that is because we have only just begun to scratch the surface of urban ecology. By studying natural rivers, the city of Denver restored its Platte River from a repository of old cars and bedsprings to a scenic river popular with several species of ducks and other water birds.
Given more time and interest, urban environments will become more diverse and vibrant than any wilderness could ever be. But that requires truth, not destracting nonsense like AGW.
(1) Kanda, L. Leann, Todd K Fuller and Paul R Sievert, 2006. Landscape Associations of Road-Killed Opossums (Didelphis virginiana) in Central Massachusetts Am. Midl. Nat. 156-128-134
(2) Biggins, Dean E, Jerry L. Godbey, Kenneth L. Gage, Leon G. Carter and John A Montenien, 2010. Vector Control Improves Survival of Three Species of Prarie Dogs (Cynomys) in Areas Considered Enzootic for Plague. Vector-Borne and Zoonotic Diseases 10, No. 1, 17-26.
R. Gates says:
March 27, 2011 at 9:56 pm
“This is especially true when bringing up the issue of truncated data, and reasons why it may be indeed a prudent thing to have truncated certain data. It gets rather discouraging to see quotes from discussion between professionals taken out of context, when the full meaning and intent among those professionals could be easily explained if non-professionals would truly understand the full context.”
Once again, you have committed the Classic Fallacy of “Petitio Principii” or “Begging the Question.” Your argument is a circle. Your conclusion is in your premises. You really should have learned to avoid this by now.
Aside from that, we don’t give a darn what they believed they were doing. We care what they did. They do not get to decide what they did but we do.
This seems like a very clear exposition Mike. I’ve been reading about paleoclimate constructions since the 60s. That IPCC graph, from AR1, IIRC, aligned with the climate studies written up to that time. I guess the ‘Team’ figured this was an obscure enough field that they could rewrite history and get away with it.
The only thing you might want to add is the lack of sea level rise, and the lack of acceleration of that rate. Seems like another bedrock footing to shore up your position upon. There is a good post here on WUWT, 3/28.
Tain says:
“I’ve always had difficulty understanding why tree-rings are considered temperature proxies.”
Want tree ring proxies corellated with temperature? click
Want tree ring proxies correlated with CO2? click
All peer reviewed, and contradictory. Rainfall, drought, and other factors aren’t taken into account. The assumption is made that temperature controls tree ring width.
Much like phrenology, where specialists studied the shape and size of the cranium as an indicator of character and mental abilities, thus concluding that women were obviously less intelligent. Today we have treemometer specialists. As if.
R.Gates says:
“Obviously, there was something wrong with the accuracy of what the tree-rings were showing, and so the data was, quite justifiably truncated.”
How the heck do you know that there was not an aberrant weather pattern that governed these trees for fifty years? Have you been there? Briffa never told us. Do you just make up the empirical obsevations as you go?
Several responses:
1- Overall, this looks fairly compelling for a lay audience. Nice work.
2 – The phrase “hide the decline” has been attached to the actions apparently taken by Mann et al because of its source but is actually not appropriate. A more accurate phrase would be “hide the variation” because the graphic they produced showed a steady downward trend (smoothing out the MWP and LIA) followed by a sharp lurch upward (smooching up 🙂 recent declines) to produce a nice, simple, picture – where the reality is more complicated and shows far more variation.
3 – The statement “It’s unchallengeable that CO2 traps heat and warms the Earth and that burning fossil fuels shoves billions of tonnes of CO2 into the atmosphere,” contains two assertions.
3.1 Now I know everyones knows CO2 produces warming, but there’s no actual evidence, basic physics contradicts the hypothesis, every experiment designed to prove it has failed, and the little data we do have suggests CO2 concentrations trail, rather than lead, atmospheric temperature change. Other than that, however, accepting it is a pretty good idea.
3.2 The second statement “that burning fossil fuels shoves billions of tonnes of CO2 into the atmosphere,” is obviously true, but carries the implication that this CO2 would not find its way into the atmosphere without our help. Is there actual evidence for this – and, if so, over what time scales?
Imagine, for example, that human action against large scale fires balances, or nearly balances, human CO2 production over X year time scales, but climate change lags drivers on some different scale – Y years. I have no idea what the balance is, or what the scales might be, but it’s obviously possible to propose scenarios in which CO2 does drive climate, but the net effect of human action is that of a negative, rather than positive, amplifier.
I’ll offer two conditional views:
1) If this is intended to run as an editorial column in just about any venue:
-Then it is almost fine just like it is, but remove most of the obscure science references.
2) If this is intended to be sent to someone important:
-Then I would not want this to represent my point of view. (I think I agree with what I think you are trying to say, but so much of it is unclear that I can’t be sure if I agree or not. Was that clear?)
2-a) As several people said above; clean up the text. Remove all the verbal graphiti, fix the syntax errors, etc.
2-b) There are several places where you are ambiguous, such as where you state that the hide the decline graph is used in several places in IPCC to support various claims. Those should be clearly referenced.
The end result of what you have written is document that is easily refuted by even the most casual revew. I think you may be right, but the way you presented it leaves too many easy ways to question it. I will only go into details if your second draft does not address these concerns.
I agree with Mike Jonas’ earlier post.
If dendrochronology was considered unreliable after 1960, it must therefore be considered unreliable prior to 1960.
–
What the science says…[A la Sceptical Science]
“The divergence problem is a physical phenomenon – tree growth has slowed or declined in the last few decades, mostly in high northern latitudes. The divergence problem is unprecedented, unique to the last few decades, indicating its cause may be anthropogenic. The cause is likely to be a combination of local and global factors such as warming-induced drought and global dimming. Tree-ring proxy reconstructions are reliable before 1960, tracking closely with the instrumental record and other independent proxies. ”
–
“The divergence problem is unprecedented, unique for the last few decades.”
–
Of course, it isn’t possible that there was a large divergence at any other period in history before 1880, or is it?
How convenient that tree rings decided to lie after 1960.
Re: R. Gates March 27, 9:56 pm
R. Gates, thank you for the useful links to the SkepticalScience. com pages. Those pages and their links provided some good information about the post 1960 divergence problem. You are correct when you say “this truncation was hardly ignored…” We have seen the hand-waving arguments to explain the post 1960 divergence and to justify its truncation. My feeling up to this point was that those arguments may be plausible.
Here is the problem now, and it looks obvious to readers here, and should look obvious to you: If you read to the bottom of your first link it says “Tree-ring proxy reconstructions are reliable before 1960, tracking closely with the instrumental record and other independent proxies.” Apparently that is not the case , otherwise, why the truncation prior to 1550?
Is it possible that the decline post 1960 and the low levels prior to 1550 are both a natural consequence of elevated temperatures? If so, wouldn’t the values before 1550 that are lower than the values after 1960 imply that it was warmer in prior to 1550 than it was after 1960?. The links you provided (and the links within those links) did not discus the pre-1550 divergence, which of course, was the point of this post. Why is that?
Tom Moriarty
ClimateSanity.wordpress.com
Greenland is one place. It is not the globe.