I have been asked to present this for review by readers here, and to solicit critical comments for the purpose of improving the presentation. Moderators please remove any off-topic comments and commenters please stick to the issues of review. – Anthony
[…]
Now, about the climate science:
‘‘It’s unchallengeable that CO2 traps heat and warms the Earth and that burning fossil fuels shoves billions of tonnes of CO2 into the atmosphere,”
“But where you can get challenges is on the speed of change.”
— Professor John Beddington
The British government’s chief scientific adviser, John Beddington, has called for more openness in the global warming debate. He said climate scientists should be less hostile to sceptics who questioned man-made global warming. He condemned scientists who refused to publish the data underpinning their reports. He also said public confidence in climate science would be improved if there were more openness about its uncertainties, even if that meant admitting that sceptics had been right on some hotly disputed issues.
“I don’t think it’s healthy to dismiss proper scepticism. Science grows and improves in the light of criticism. There is a fundamental uncertainty about climate change prediction that can’t be changed.” [As reported in The Australian“i. Other reports were similar.]
I would like [the two speakers] to address the specific issue of the deleted data in reconstructed temperature graphs.
The issue is as follows: In their third report (“TAR”), the IPCC published the following graphii:

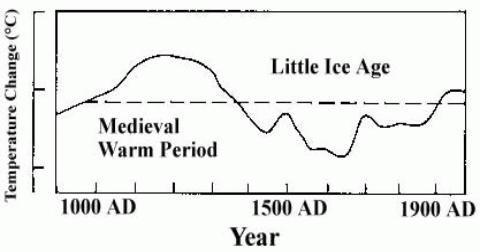
This is a graph of several temperature proxies, with the instrumental temperature record from around 1900 added. What it shows is that temperatures had been declining fairly steadily for nearly 1000 years, but then suddenly shot up in the 20th century.
It has now been discovered that some of the data series had been truncated in the graph. The result of these truncations was to make the data series look more consistent and therefore convincing. (NB. I make no statement about intent.). If the data series had not been truncated, the end result would have been very differentiii:

The two red segments are the truncated data. These two segments and the dotted curve connecting them are a single data series “Briffa-2000”1. Note that the first downward segment of the black graph (instrumental temperature) has also been deleted in the version used by the IPCC.
The extreme divergence between the “Briffa-2000” proxy and the instrumental temperature record shows that this proxy is completely unreliable (the “divergence problem”). To delete segments from the graph – especially without a prominent explanation – is bad scientific practice. Contrary to claims by various climate scientists, the deletions were not disclosed in the TAR. Nor was the “divergence problem” discussediv. As Professor Richard A Muller of University of California, Berkeley, has said “You’re Not Allowed to Do This in Science“v.
Was the “Briffa-2000” data series the only unreliable proxy data series? It seems not. Phil Jones’ 1999 “Climategate” email indicated that other proxy data series had been truncated to “hide the decline“vi.
It has been argued that this “hide the decline” graph (aka the hockey-stick) is not important in the overall scheme of things, ie. in climate science as a whole. Gavin Schmidt put it this way on RealClimate.com, “if cherry-picked out-of-context phrases from stolen personal emails is the only response to the weight of the scientific evidence for the human influence on climate change, then there probably isn’t much to it.“vii.
Unfortunately, the “hide the decline” graph is much more important than that. In the fourth IPCC report (“AR4”), the effect of solar variation on climate is discussed. Theories such as Henrik Svensmark’s are dismissed as “controversial” and then ignoredviii. Consequently, solar variation is included in the climate models purely as the direct climate forcing from total solar irradiation (TSI). Since variations in TSI are quite small, in percentage terms, the climate models allow only for small temperature changes from TSI changes.
Such small temperature changes are quite consistent with the “hide the decline” graph, because that graph shows only small temperature changes prior to the 20th century. If the IPCC had persisted with their original estimate of earlier temperatureix …

… then the climate models would have been unable to replicate the temperature changes in either the MWP or the LIA, because the total effect of all natural factors (including TSI variation) allowed for in the models is far too small. If the climate models were unable to replicate the MWP and LIA, then they would lack credibility, and any scientific conclusions based on the models could be disregarded.
But it gets worse.
With the “hide the decline” graph representing global temperature, the climate modellers had only one factor which could give a sudden upward movement in temperature in the 20th century – CO2. This was the only factor whose pattern changed significantly then and only then. The IPCC analysis is based on “equilibrium climate sensitivity” (ECS), which is defined as the equilibrium change in the annual mean global surface temperature following a doubling of the atmospheric equivalent carbon dioxide concentrationx. The way ECS was arrived at was to map the 20th-century temperature rise to the increase in CO2 concentration : “Estimates of the climate sensitivity are now better constrained by observations.“xi.
The IPCC and the climate modellers still had a problem: the scientific studies on CO2, and the physical mechanism by which it warmed the atmosphere, gave an ECS which was far too low. But the discrepancy was explained by climate feedbacks. A climate feedback is defined as follows: “An interaction mechanism between processes in the climate system is called a climate feedback when the result of an initial process triggers changes in a second process that in turn influences the initial one. A positive feedback intensifies the original process, and a negative feedback reduces it.“xii
This leads us to clouds. The IPCC state repeatedly that they do not understand clouds, and that clouds are a major source of uncertainty. For example: “Large uncertainties remain about how clouds might respond to global climate change.“xiii There are many statements along these lines in the IPCC report. Now simple logic would lead one to think that clouds would be a negative feedback:- as CO2 warms the oceans, the oceans release more water vapour, which forms clouds, which have a net cooling effect (“In the current climate, clouds exert a cooling effect on climate (the global mean CRF [cloud radiative forcing] is negative).“xiv).
But the IPCC report claims that clouds are a massive positive feedback: “Using feedback parameters from Figure 8.14, it can be estimated that in the presence of water vapour, lapse rate and surface albedo feedbacks, but in the absence of cloud feedbacks, current GCMs would predict a climate sensitivity (±1 standard deviation) of roughly 1.9°C ± 0.15°C (ignoring spread from radiative forcing differences). The mean and standard deviation of climate sensitivity estimates derived from current GCMs are larger (3.2°C ± 0.7°C) essentially because the GCMs all predict a positive cloud feedback (Figure 8.14) but strongly disagree on its magnitude.“xv.
The IPCC provide no mechanism, no scientific paper, to support this claim. It comes in some unspecified way from the climate models themselves, yet it is acknowledged that the models “strongly disagree on its magnitude“.
So, to sum up, the situation is that the “hide the decline” graph leads to nearly all of the 20th-century warming being attributed to CO2, thanks to a factor (clouds) which is not understood, is not explained, and comes from computer models which strongly disagree with each other. The inevitable conclusion is that without the “hide the decline” graph, the clouds “feedback” as described in the IPCC report would not have existed.
Now, returning to Gavin Schmidt’s comment. When he talks about “the weight of the scientific evidence for the human influence on climate change“, a very large part of that evidence is the IPCC report and everything that references it. But as I have just shown, the IPCC report itself relies for its credibility on the “hide the decline” graph. In other words, the entire structure of mainstream climate science depends on a single work which is itself based on methods which are “not allowed” in science.
So of course there are, in Professor Beddington’s words, challenges on the speed of change. If the MWP, which was of course completely natural, was about as warm as today, then it is entirely reasonable to suppose that natural factors are largely responsible for today’s warm temperatures too, and that the speed of change from CO2 has been grossly overstated by the IPCC.
Mike Jonas
References:
1 There are number of different versions of this graph, in the various IPCC reports and elsewhere, where different versions of the proxy data have been used.
viii http://www.ipcc.ch/pdf/assessment-report/ar4/wg1/ar4-wg1-chapter2.pdf para 2.7.1.3
ix http://climateaudit.files.wordpress.com/2008/05/lambh23.jpg (I could not provide a link to this graph in an IPCC web page, because earlier IPCC reports are no longer linked there. http://www.ipcc.ch/publications_and_data/publications_and_data_reports.shtml)
xi http://www.ipcc.ch/pdf/assessment-report/ar4/wg1/ar4-wg1-chapter9.pdf Executive Summary.
xiii http://www.ipcc.ch/pdf/assessment-report/ar4/wg1/ar4-wg1-ts.pdf para TS.6.4.2
I agree with Richard111 that the claim “that CO2 traps heat and warms the Earth ” should be challanged.
My understanding is that the theoretical physics is well understood and that it has been amply demonstrated in laboratory experiments, that CO2 traps heat in a sealed container.
Further it is my understanding that Roy Spencer is the only person to attempt to demonstrate what happens in the atmosphere.
As already noted, he claims to have shown that the clouds provide negative feedback, which if correct, completley destroys the IPCC arguement.
A purely stylistic suggestion. Sometimes it is necessary for an article to reference the author, but where it is not necessary, I suggest avoiding it. For example, right there, I use “I” because I am referencing my own judgment, and it wouldn’t make sense to leave it ambiguous whose judgement I am referring to. Mike, however, uses an unnecessary “I”:
It might be preferable to employ the passive voice, leaving the unambiguous doer (mike) unstated:
steven mosher says:
March 27, 2011 at 11:05 pm
good grief.
If you’re not going to be specific about your disdain, then don’t bother posting. Such condescension brings down the standard of Anthony’s blog. IMO, this should’ve been censored by the moderators, since it adds nothing more than “mosher doesn’t approve.”
So what?
R. Gates says:
March 27, 2011 at 9:56 pm
….
It is, in my opinion, very dishonest at best to use the “hide the decline” comment to insinuate that there was any attempt at dishonesty, academic or scientific, but rather, the truncation of the data was valid, as everyone knew the truncated N. Latitude tree-ring reconstructions were wrong, and they would skew the data in an erroneous way.
They did not (and still do not) know the reason for the decline! How do you know that decline would skew the data in erroneous way if you have no idea why it was happening? This decline, without a proof that it does not affect all of the data, should completely invalidate ALL of the data. How could this not be dishonest?
I think it’s relevant to ask about ice core data. If I understand it correctly, it has become more and more clear over the past decade or so that Antarctic and Greenland ice data shows that CO2 and temperature to track reasonably well, but the CO2 concentration lags the temperature by 600 years or so.
1. Why is this not evidence that past temperature changes were not driven by CO2?
2. If the temperature upswing wasn’t driven by CO2, what did cause it?
3. If, as a reasonable person who is not one of R Gates’ “professionals”, might conclude, temperature increases, release CO2 or inhibit the uptake of CO2 or both, where in the ice core records is the dramatic temperature change that the increased CO2 should have provoked.
Jeez before you get too excited about CO2 and the IPCC report, you need to make sure that there is a problem at all.
Is a rising temperature a net benefit or a net problem?
That has not been evaluated in any meaningful, unbiased way in any of the IPCC reports.
Next you have to establish that the temperature has really been rising at all.
For example see Roy Spencer again where he shows that the temperature of the lower atmosphere in February 2011 is the same as occurred in 1980.
http://www.drroyspencer.com/2011/03/uah-temperature-update-for-feb-2011-0-02-deg-c/
R. Gates…
The issue you don’t seem to understand is this:
If the tool you are using sometimes gets wrong results, then you have to either figure out exactly why you tool gets wrong results, or you have to abandon the tool as unreliable.
Naming the phenomenon and then ignoring it doesn’t help; if everyone is familiar with divergence, why in the world, after all this time, can’t they explain it? You can’t just name it and ignore it. You have to name it and quantify it.
If what you do instead is hide the parts of the tool’s measurements that disagree with reality, then you are giving the impression that the tool is universally accurate, when, in fact, you know that it is not. This is called “lying”.
Please don’t attempt to justify this nonsense anymore until you can point to the peer-reviewed analysis that explains the divergence.
The extreme divergence between the “Briffa-2000″ proxy and the instrumental temperature record shows that this proxy is completely unreliable (the “divergence problem”).
If the proxy is ‘completely unreliable’, deleting all of it would seem appropriate. Deleting all of Briffa does not change the result significantly, so that seems to be a reasonable thing to do. Why complain about deleting just part of Briffa? You should rather complsin, that not enough was deleted. But since it makes little difference, the result is not critically dependent on the non-deleted part. So, apart from the ethical problems with partial deletion, full deletion seems the way to go.
Few comments:
1- Loose the “Now simple logic would lead one to think that clouds would be a negative feedback” statement. Simple logic it may be, but evidence of a position it is not. Use literature.
2- The reference statement about the IPCC seems too forceful- almost from a standpoint of someone who’s already made their mind up. Remember, you must not only BE impartial when looking at evidence but be SEEN to be impartial to. I’d re-word it.
3- More details on the GCM’s, as outlined above you’ve stated that models cannot model the MWP. You should expand this to say that models cannot simultaneously model the MWP and current temps (which i believe is true and closer to what you were trying to say anyway).
4- You should include a graphic that has the expanded error limits for the ‘new’ hockey stick if the ‘decline’ is added (or rather not deleted). I’m pretty sure it will significantly skew the results- this is not to say that it’s a real reflection of the ‘actual’ situation- but it will give further weight to the accusations of scientific fraud if the average trend is significantly altered.
5- If there is ANY evidence that the other proxies are suspect you must find it and include it. There’s no poiont doing a one-cheeked job here (not that i’m saying you are!) but if you can fully skewer the issue in one go, then all the better (prevents the inevitable and protracted arguments on the other proxies).
R. Gates says:
March 27, 2011 at 9:56 pM
It is, in my opinion, very dishonest at best to use the “hide the decline” comment to insinuate that there was any attempt at dishonesty, academic or scientific, but rather, the truncation of the data was valid, as everyone knew the truncated N. Latitude tree-ring reconstructions were wrong, and they would skew the data in an erroneous way. Before any discussion of truncated data can be included in any paper, one needs to look at the full scope of reasoning behind that truncation, and to do that, a discussion of the true nature of the “divergence problem” needs to be addressed.
=================================
Your ridiculous and bogus “reasoning” [if you can call it that] is why people make a laughing stock of climate science.
Rest assured, R, your posts….do not go without laughs.
You are the court jester version of the “scientist”….hey who would blame ya….your cause needs all the props (false or not) it can get.
Chris
Norfolk, VA, USA
An opportunity for online peer review
If this is intended to be a trial of online peer review, then it is terrible. The main assertion seems to be that there is no feedback from clouds – or was it the “hide the decline” political slogan? The cloud assertion is totally unsupported by evidence – what is there to review?
“The IPCC provide no mechanism, no scientific paper, to support this claim. It comes in some unspecified way from the climate models themselves, yet it is acknowledged that the models “strongly disagree on its magnitude“.” what page? What is the context? Who else has made similar comments? How do you review something where all the work has to be made by the reviewer to go and find the facts that are not present in the article for review?
I strongly suggest that any article intended for online review follows a layout similar to this:
1. Title – saying what is to be reviewed (or are we reviewing the online review process? And if so why wasn’t this the main thrust of the article?)
2. Summary/abstract – giving a short synopsis of the article so that anyone reviewing it can understand the framework and thrust of the article so they can understand the relevance of evidence provided in the first reading and not have to reread the same article several times in order to: understand what it is trying to say, understand what it is actually saying, make specific points where there are specific problems.
3. Add references in the text
4. Add a summary
5. Add a list of references (done)
In short: this article needs a complete rework because it is well below the standard that should be expected if someone is expecting others to give up their time and effort to review it
AusieDan,
What does any of your comment have to do with anything I wrote?
Did you even read the words or did you just run them through some yes/no good guy/bad guy IPCC filter to come to a conclusion?
It is disconcerting that attempts to raise the level of discourse here are always followed up with comments such as yours. I was kind to Mike Jonas, but in fact articles such as his are not helpful to our (yes OUR, yours and mine) side. His main conclusion is unsupported by the arguments he states. Climate Science is lousy with liars, but does not crumble en masse because of this latest discovery of malfeasance.
There are many regions on the earth where annual mean temperaure has remained unchanged for about century such as Texas, Alice Springs, Death Valley etc.
Go to: http://www.wolframalpha.com
In the input box type: weather alice springs. Click on the red box with the “=” sign.
In a flash the Wolf retreives and displays the temp data for Alice Springs for that day.
In the “Weather History and Forecast” section, you can get annual mean temperature back to ca 1940 and a OLS trend analysis from that time to present.
For Alice Springs the trend is very slightly negative.
John Kehr says: “Where is the evidence to support that the GCM’s cannot replicate the MWP or LIA?”
Well, what I actually said was “If the IPCC had persisted with their original estimate of earlier temperature … then the climate models would have been unable to replicate the temperature changes in either the MWP or the LIA, because the total effect of all natural factors (including TSI variation) allowed for in the models is far too small.“.
Based on everything I know about the models (and the ice core CO2 history), that seems to me to be a reasonable statement. I don’t think I can claim that “the GCM’s cannot replicate the MWP or LIA“, because they haven’t AFAIK tried to do so with MWP temperatures similar to today’s. However, if you do know of a climate model, referenced by the IPCC, which does show a MWP with temperatures similar to today’s, and does so without having its parameters changed from the ones it uses now, I will change my statement.
“He said climate scientists should be less hostile to sceptics who questioned man-made global warming.”
I’d take that with a pinch of salt if I were you, he’s obsessed with CAGW and thinks the public, including other scientists, mathematicians, engineers etc. should do as they’re told by the climate science community. Moreover he’s transformed this scepticism of the work activists at the heart of the climate science community into an “attack on science” to give a cloak of respectability to his own attacks on those who are (a) questioning what is the most dubious scientific theory since scientists thought the sun went round the earth; (b) suggesting, quite reasonably in my view, that even if the greens are right that for the foreseeable future there is no viable solution for the replacement of fossil fuels as our main source of energy. Whatever happened to the Chief Scientific Advisers to the UK Government who used to have pens in their top coat pocket and could talk and understand engineering issues?
RBates, I know the warmist community have been trying to shift the debate about “hide the decline” to say it was known about and that it doesn’t matter anyway, (see Leif above) but that’s not and never has been the sceptics issue. The issue is that the IPCC, the acclaimed gold standard in scientific expertise (seemingly provided by a large number of people who haven’t left high school yet) has published a graph that the authors knew didn’t represent the proxy data post 1960, because it didn’t follow the temperature records. In other science this would have negated the whole series and the public, who are paying for this stuff, should have been told. If there was no skullduggery going on why didn’t Jones write saying something to the effect that “I’ve adjusted the graphs to deal with the divergence problem”? Why use the words “Mike’s trick to hide the decline”? If as you say the divergence problem was well known why wouldn’t Jones have referred to it directly?
Leif, it doesn’t matter to you that scientists manipulated the data to produce a chart that suited their purpose because the other charts would do the job anyway? Is that what you’re saying?
The other point, is that if we are being asked to review something, we need to know the intended audience.
Who is this for?
As far as I can see (and it isn’t clear partly due to Anthony’s comment) the first line is: “Now, about the climate science:”. If this is e.g. an article to be sent to a professional audience then it completely sucks. If it is an article for self congratulating remarks on a sceptic blog then fine … but don’t expect anyone outside to take this process of online review here seriously.
What is the intention?
How can I help achieve the intention where it is as clear as mud? What is the key point they are trying to put across, who are they are they trying to put it across to, when does it need to be put across.
How is this process going to work? If this is THE ARTICLE, then to be frank, we’ve heard it all before because it seems to be a rehash of other articles.
How to cite this article
This may sound a silly point, but how would I cite this article in my own work?
Author (done)
Date (done)
Title paper (not at all clear. If it is: “An opportunity for online peer review” it is going to look a pretty naff reference in a list of climate references)
Publication: What is the official name of this publication? I hate citing web pages because it is never clear what the publication is, who is the publishing organisation.
Who is the author
If you want to start having online review, the intention must be to allow others to cite the articles in some way. Who is this “Mike Jonas”? How do I contact him to e.g. ask permission to reproduce his work? How do I know his credentials for – is he a real scientist with a host of papers, has he produced other works for “online review” is he the one and only “Mike Jonas” in the world, and therefore any search for “Mike Jonas” will be this one and only “Mike Jonas” … or is his real name “Michael Jonas”?
“‘‘It’s unchallengeable that CO2 traps heat and warms the Earth and that burning fossil fuels shoves billions of tonnes of CO2 into the atmosphere,”
“But where you can get challenges is on the speed of change.”
– Professor John Beddington”
I’ll rewrite this bit
‘It is estimated that a doubling of CO2 will increase the amount of back radiation from CO2 in the atmosphere to earth by 3.7 Watts/sq meter out of a total of 333 Watts /sq Meter from all greenhouse gases. Since 1880 the increase of CO2 in the atmosphere has been from 280 parts per million to 390 presently. It is currently increasing by 2 parts per million per year and the amount of CO2 from fossil fuel burning is 10 billion tonnes per year at present.
Where you get challenges is what the impact of this on other forcing/feedback components of the overall climate system and how that will affect our future life on earth’
Two points present themselves from the foregoing discussion and have excited my curiosity;
1 If a proxy technique fails over much of the time for which it is being employed, the results from using that proxy should be discarded completely as being unreliable. Being a ‘little bit unreliable’ is anamolous to being ‘a little bit pregnant’.
2 The laboratory experiments which determined the ability of carbon dioxide to trap heat were carried out in sealed containers. How do such experiments relate to real-world conditions?
Could any knowledgable reader answer the above questions.
Steven Moshers inscruitable comment has excited my curiosity – would he care to expand rather than make vague noises.
Harold Pierce Jr says:
March 28, 2011 at 12:53 am
WA is a valuable resource.
For an east (Australian) coastal version of steady temperatures, type in weather moruya airport. Hit ‘all’ to go back to 1940.
Very steady temperatures for a small airport close to the sea, no urban influence.
My stamping ground in summer.
A very minor point, but you say “…if the MWP was as warm as today …..” .
S. Greenland must have been a lot warmer then than it is today for the Vikings to be able to farm there in the way that they did.
John Beddington current position is ‘hide the malign’
Yes Leif,
Then we can move on to proper QC on the other curves in the IPCC and related spaghetti graphs. Note that some of these other published graphs actually exhibit a MWP of similar magnitude to the current warm period. The risk for alarmist climate scientists is that such an endeavour could further upgrade the MWP, especially when the upsidedown bits are flipped to the proper orientation.
Just imagine where we would be if there were no thermometers.
If there was no direct way to measure temperature, we would have to rely completely on the proxies and R Gates would be explaining that the earlier data was truncated because it does not correlate, but the latter sharp increase would not only stand, it would prove the CAGW position completely.
EO
Scottish Sceptic – there are a number of references given at the end of the document. For example, “… strongly disagree on its magnitude” is reference xv, which is the IPCC report, chapter 8, para 8.6.2.3. I said “The IPCC provide no mechanism, no scientific paper, to support this claim.“, and certainly I couldn’t find any in para 8.6.2.3 or anywhere else in the IPCC report. If you know of any, in the IPCC report, please let me know and I will change my document.
Sorry about the format of the document not being to scientific paper standard. It is part of a larger document which has its own overall format. Only this part addresses the science. Hopefully, factual errors will be obvious regardless of format.
This whole business lacks daylight. It’s just like the art world in which academics still debate the finer points of a bicycle wheel mounted upside down to a stool all based on an age old idea of “art” but in this case it’s the idea of “science”. A graph isn’t science. It’s just a graph.
At some point there’s just nothing there! At some point there needs to be a more popularized, common man level of debunking. The Team has repeatedly turn random noise into a false signal. The worst case I ran into was Mann’s algorithmic cherry picking update of his hockey stick in which noisy data was tossed out unless it conformed the the instrumental record, but being mostly just noise, it cancelled out before the instrumental record kicked in in 1900, so it formed a hockey stick. Any noisy data as input gave the same result. And yet it’s still in the literature.
The “presentation” above is not well organized. It starts out with some vague addition to “hide the decline” and then juts out into clouds as cooling factors.
I think it needs to take a u-turn back to the starting gates and slow WAY down. The age old question of how you would explain this mess to a child would be a good exercise to start with. What if Suzy said she was a famous opera star? If in the future she definitely is destined to be one, does that make her one now, already?
The presentation jumps directly into uber nerdiness and insider gossipy minutia.
“The speed of change” is not an easy concept to humanize in an intuitive sense when the issue at hand is whether CO2 is bad instead of good for the biosphere. I want a very fast speed of change, as the innate robustness of plant life kicks in big time to take advantage of increased CO2.
Another exercise would be to ask “What would Richard Feynman say?”. I don’t think he’d talk about Gavin Schmidt, who works three blocks from me, actually. What does some PR guy with a math background who works above Tom’s Diner have to do with empirical science? He’s just a theory dude. Whatever.
I would use the analogy of a patched together monster. He could not live without odd parts being taken apart and patched back together in unnatural ways. And ultimately he could not survive since he could not grow out of the framework the initially bound him together.
Some type of metaphor or story line needs to run through the presentation.