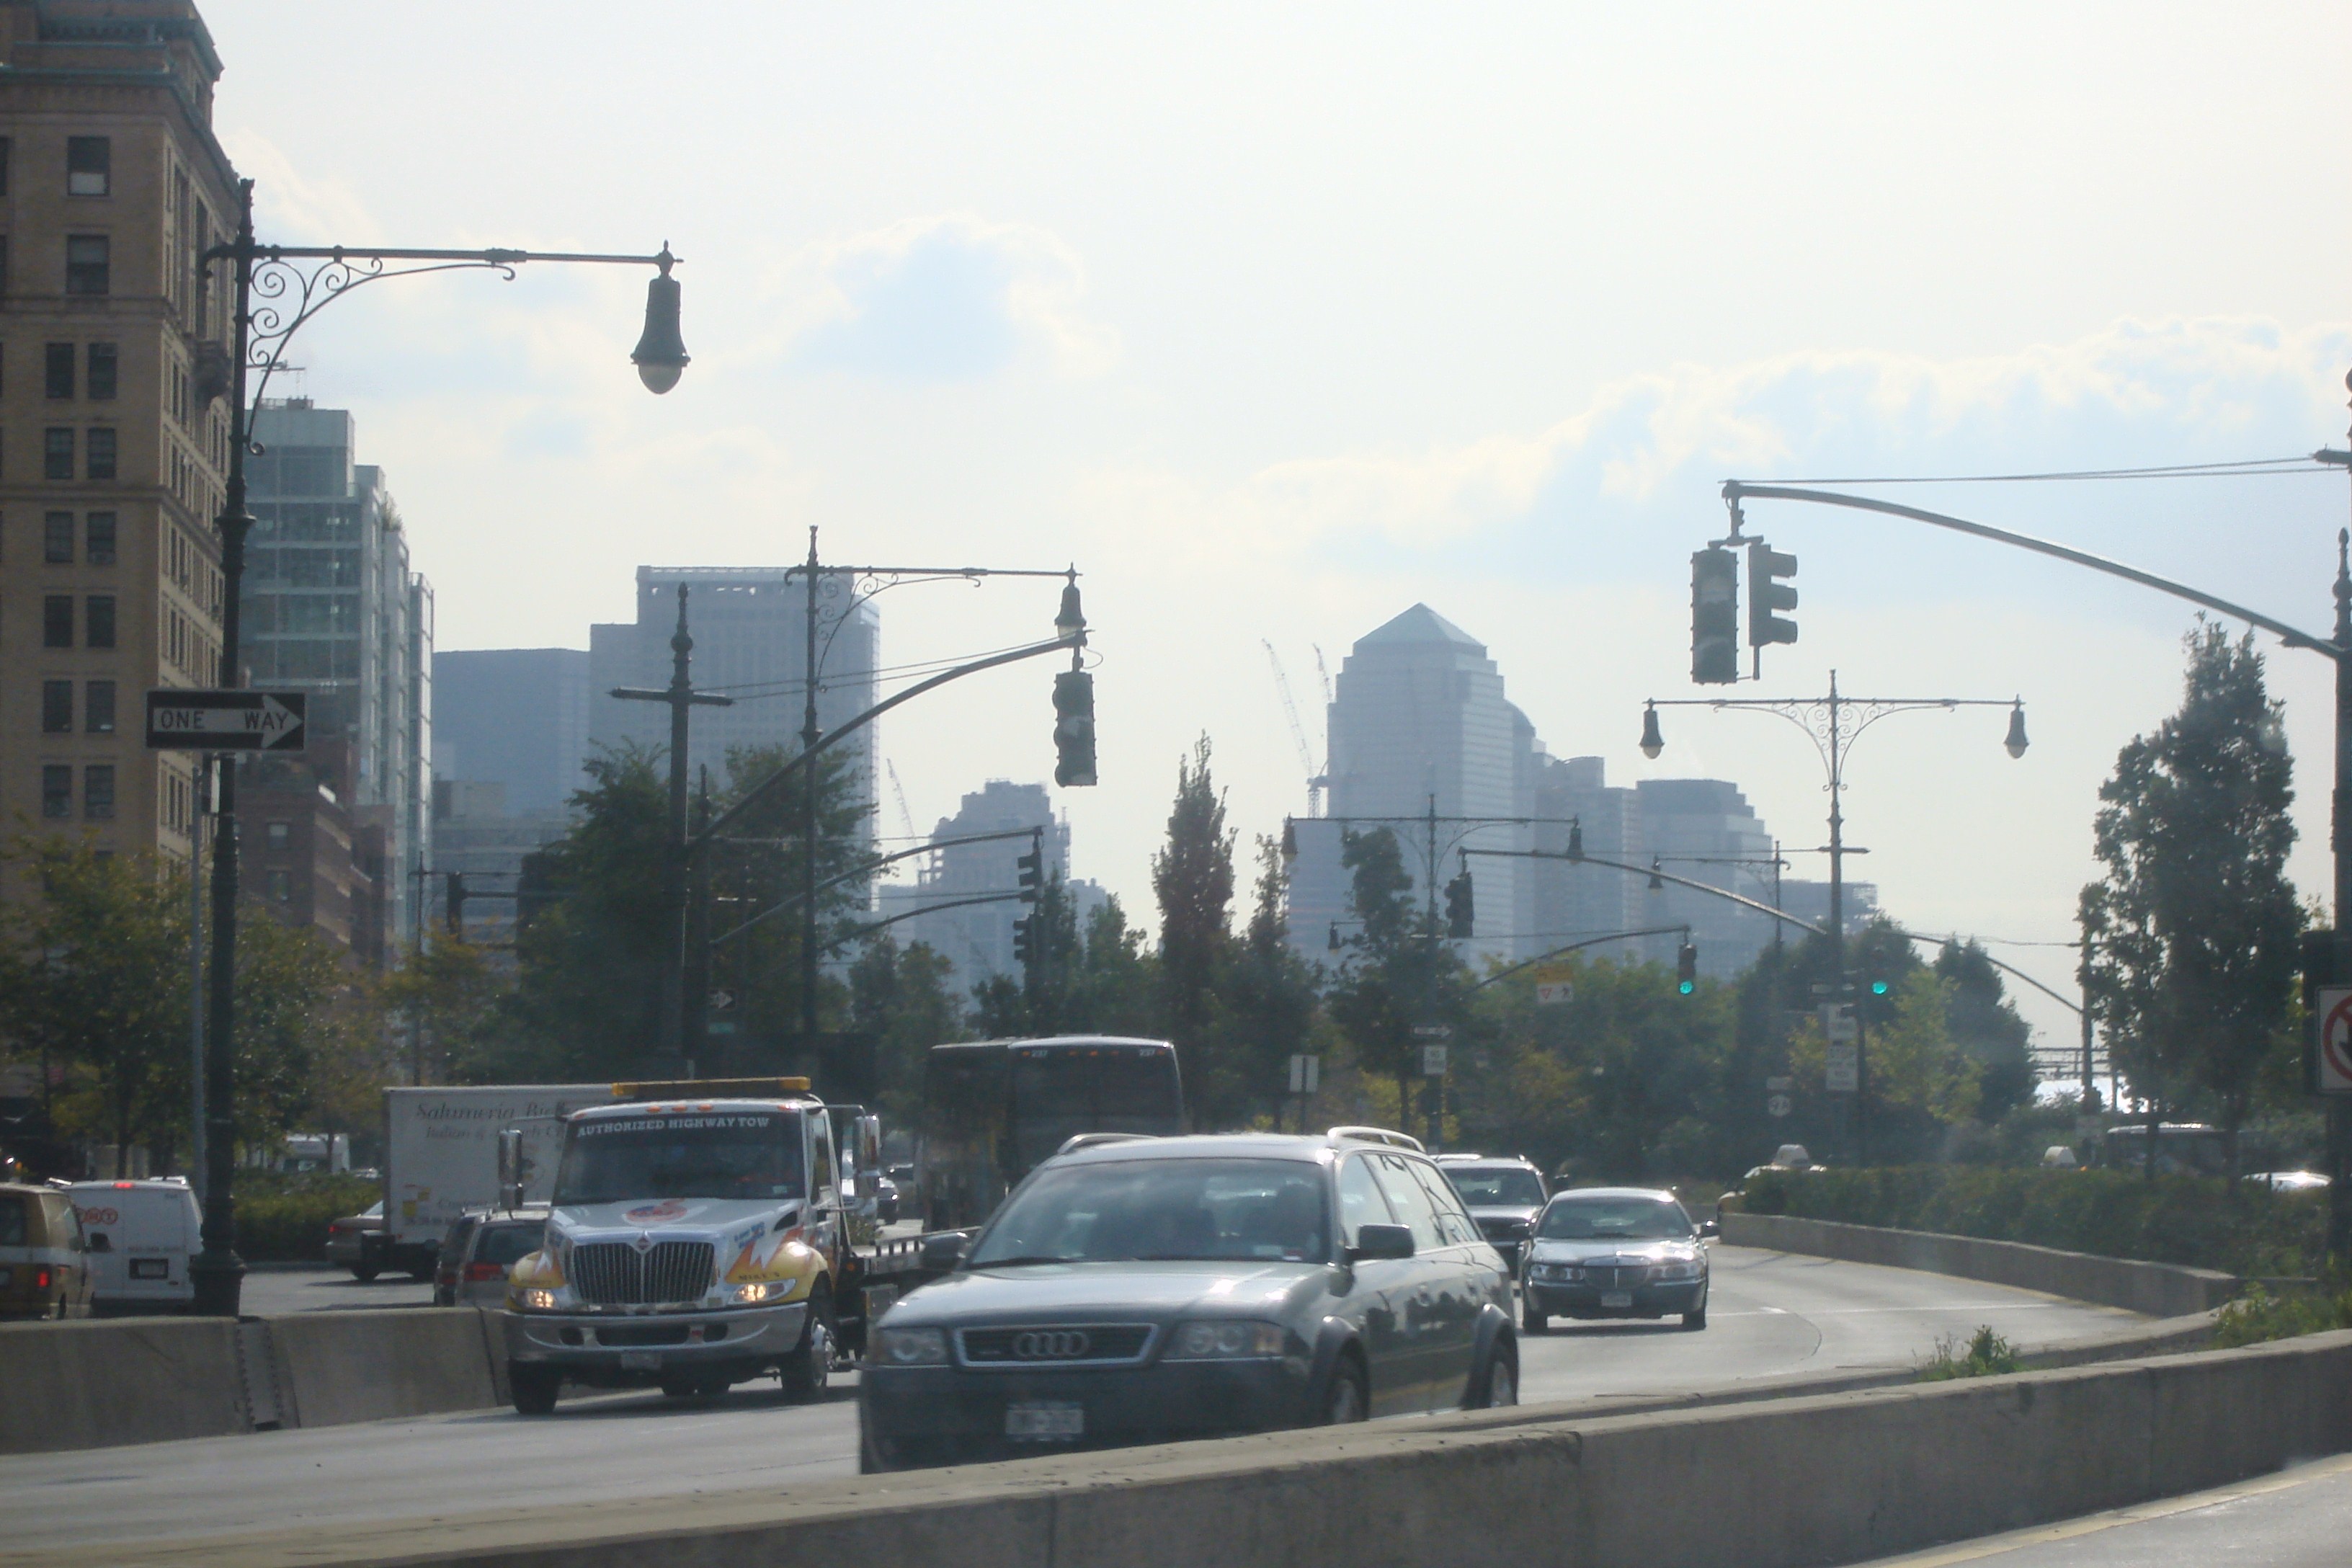
One of the more common visual tactics used by AGW proponents to scare people into thinking that AGW induced sea level rise is a big threat is to show altered photographs and GIS models of a city near the ocean (take your pick, New York, London, San Francisco etc.). These futuristic images demonstrate what the city might look like once global warming kicks in and kicks our butt, apparently without anyone noticing the advance of the sea. Take for example, lower Manhattan, one of the more common targets. The top image is a future shock rendition from the History Channel “Armageddon Week” and the bottom image is a photo of present day reality from Wikimedia.


Scary huh? And it’s not just photos, now that most anyone with a PC can run Google Earth, there’s a veritable cottage industry of people who make sea level inundation KML files using the 3D buildings feature for major cities. It works very well to get people’s attention. But how much of a looming threat is it when compared to the reality of measured sea level rise? Let’s find out.

Will Manhattan really look like that in the future? You can even interactively freak yourself out here, at Climate Atlas, and see what it looks like in NYC when the entire Greenland Ice Sheet melts:

Gosh.
Well, I can see how people must be terrified. Just look at this plot of sea level rise at the Battery Park tide gauge from NOAA:

Yeah, it’s headed up, wayyyy up. 2.77 millimeters per year. So, to get the levels in the photo and 3D GE model shown above, we’d need to do some simple calcs.
The Google Earth 3D model is easy. It specifies a 3-5 meter sea level rise, so we’ll call it 4 meters.
For calculation purposes, we’ll assume sea level rise to be linear, and round up the Battery Park tide gauge rate to 3.0 mm per year, which puts it closer to the 3.1 mm per year measured by satellite and published at Colorado State University’s Global Sea Level Page.
4 meters = 4000 millimeters
4000 millimeters /3.0 millimeters per year = 1333 years

Now, how about the doctored image from the History Channel? There’s no reference given on the height of sea level rise on the web page, but fortunately, we have built-in yardsticks in the image. The story height of buildings in the photo can easily be estimated from the before and after photos shown at the top of this post.
I’ve selected the white building on the northeast side of Battery Park, along South St. I counted 18 stories of that building as being underwater using the hi-res image here , and I’ll estimate from other objects in the photo (like the water to pier to street height) that it is an additional 2 stories from street level there to the present day sea level (PDSL).
So what is the height of a story? The Council on Tall Buildings and Urban Habitat gives a handy guide on story height for office buildings like that one. They say that an office building like that one has a story height of 3.9 meters , so we’ll use that.
History Channel photo submersion = 20 stories
Story height = 3.9 meters
Sea Level Rise in the photo 20 x 3.9 meters = 78 meters
78 meters = 78,000 millimeters
78,000 millimeters / 3 millimeters per year = 26,000 years

26,000 years to get that? Would those buildings still be standing then? And even more important, wouldn’t we be in a new ice age by then? If we did enter another ice age, sea level would be lower, as demonstrated in this graph below. Note the level 24,000 years ago.

This demonstrates the folly of assuming that climate change, and hence sea level rise, is linear. As we all know, it isn’t, yet that doesn’t stop many AGW proponents from using present day measurements to project linearly into the future and then generate scary scenarios and visuals from it.
Even on the short-term, such predictions fail miserably. Take for example Dr. James Hansen of NASA GISS. Read his prediction 20 years ago about sea level rise in New York City, which I previously covered on WUWT in A little known 20 year old climate change prediction by Dr. James Hansen – that failed badly.
He said that [in 20 years]:
“The West Side Highway [which runs along the Hudson River] will be under water.
Problem is, here it is 20 years later, and people still drive that highway today without the use of Jet-Skis.
What got me started on this post was a comment left on WUWT by “Rascal”
Submitted on 2010/11/26 at 7:46 pmCopy the following address in to your browser, and observe the expansion of lower Manhattan since 1660.
http://www.racontours.com/archive/coastline_anim.php
Note that the West Side Highway (West Street) over half of the World Trade Center site, and the South Street Seaport were “under water” in 1660!
He’s right. And one thing many AGW proponents don’t consider (in addition to the non-linearity of climate) is the adaptability of humans. For readers here, I’ve taken that Flash animation at Racontours.com and made it into an animated GIF below:

They write about this historical account of lower Manhattan:
Based on our study of historical maps of Manhattan, Racontours has been able to create this simulation of the expansion of the island’s coastline. This topic is covered in both our South St. Seaport and Lower Manhattan tours, and most people are amazed at the transformation that’s taken place. Pearl St, named for the seashells that washed up there, once ran along the river. (Click here for a view of Captain Kidd’s house at the corner of Pearl & Wall Streets)
The first land reclamation was undertaken by Peter Stuyvesant upon taking over as the colony’s governor in 1646. Hoping to facilitate waste disposal and transportation, he organized the excavation of the canal along what is now Broad St. Back then, this was still called New Amsterdam, and the Dutch were great believers in canals.
By the American Revolution, the city’s population had grown to 30,000, and land had become scarce and cramped in the city center. That’s when the city began to sell ‘water lots’, wherein entrepreneurs would seek to use landfill to create additional lots for use.
The most recent landfilled area led to the creation of Battery Park City, built in the 70’s on the earth excavated from the World Trade Center’s foundation.
Based on the 2.77 millimeters per year (call it 3 mm) of current sea level rise as shown by that Battery Tide gauge, in the 344 years (1660-2004) the sea level would have risen by:
344 years x 3 millimeters/year = 1032 millimeters or 1.032 meters.
Clearly, New Yorkers have been able to stay well ahead of that 1 meter rise since the city was founded.
The next time your friends get freaked out about sea level rise, or “high water”, show them this.
Discover more from Watts Up With That?
Subscribe to get the latest posts sent to your email.
Someone should debate this Hansen wizard. He’s tearing down his own argument!
Hey Mr Watts; Sir
One thing we badly need is resource showing all the predictions made regarding the effects of climate change.
Searchable by year of prediction; year prediction is supposed to occur and the predictor; and whether the prediction was met (within experimental constraints..) or not (three outcomes :- Proved; Falsified; Indeterminate)
Can you appeal to your readership to collate this somewhere ? It’s one of those things that engineers; technicians & scientists love. And of course if CAGW predicted in 1999 that Manhattan would be under 2 metres of water then it is patently obvious that prediction is a busted flush.
It would be interesting would it not ?
Actually, the next time someone is telling me about a lot they purchased built on drained swamp/landfill/jetty and it’s sand spit/dike/river bottom, I will show them this.
What would the exaggerations of climate science be without “Photoshop?”
But you don’t understand, Anthony.
See, it’s all that evil, human-produced CO2, which will accelerate the hydrological cycle and make it smash into Manhattan and fulfil the prophecies of the AGW prophets and saints and Nobel Peace Prize winners. Also, it will acidify the oceans causing them to eat away the land and cause the seas to swell or whatever.
Am I correct in thinking Google are devout believers in the religion of warmism ?
And Al Gore is a major shareholder in Google ?
Seems to fit together somehow. Apart from Al Gore’s house at Fisherman’s Wharf.
Don’t quite get that bit.
The Colorado sea level interactive page does not show even those 3mm/y:
http://sealevel.colorado.edu/wizard.php?dlon=284&dlat=36&map=t&fit=n&smooth=n&days=60
Atlantic Ocean as a whole, well, it is pure travesty that we can not account for missing sea level rise..
http://climexp.knmi.nl/data/l3a.png
If you live in California, your tax dollars are funding studies like this one by the Pacific Institute:
http://www.pacinst.org/reports/sea_level_rise/index.htm
where the California coast is shown with a 1.4 meter sea level rise along with scary projections of biblical proportions. (Where is Noah now that we need him?)
One amusing truth that the authors of the study conveniently ignored is that in Northern California at Crescent City, the sea level is actually falling because the land mass is rising faster due to uplift than the sea is rising.
Matt says:
November 28, 2010 at 10:56 am
“Am I correct in thinking Google are devout believers in the religion of warmism ?”
I think Larry and Sergej have a massive guilt complex because of their private jet travels to Davos and because Google is the biggest energy hog after the NSA. Maybe before the NSA.
People like to pick on New York as a sea level gauge. They never pick on Boston. There’s much more land in Boston than there was in colonial days. The Fewway is called that because it used to be a fens, a middle english term for a marshland. It started out as a tidal flat, and turned into a freshwater lagoon, with more land than water. The Back Bay used to be a bay(!) but was filled in with merial brought in by train between 1857 and 1882.
Boston even has a dam on the Charles River, but I think that was mainly to keep salt water out, instead of making a reservoir.
One of the best reasons to not use Boston as a sea level indicator is in Anthony’s comments – in 26,000 years the next ice age is going to scrape the area clean and rebuild Cape Cod and the Islands with Boston architecture.
Perhaps sea level hand wringers, at least on this side of the Atlantic, should only look 150 years forward.
REPLY: Oh, I picked on Boston before –
The rubbish is coming! One if by land, two if by sea
http://wattsupwiththat.com/2009/05/16/the-rubbish-is-coming-one-if-by-land-two-if-by-sea/
– Anthony
I don’t know about anyone else, but Ah’m-a-gedden tired of Armageddon.
Will you guys please knock off this sea-level-rise-panic knocking? I am hoping to buy a waterfront property to retire in and I need sea-level-rise-panic to drive the market prices down so that I can snap up a bargain from the gullible.
I think “Armageddon Week” is a very descriptive name for AGW predictions, and it should be used more often.
Murray, good one. However, on a serious note, let me direct you to some pictures of potential lots (see above) like the one you want. To buy from the gullible this marginal fake land, is to be only slightly less gullible than the motivated seller.
There is a volcano called Cumbre Vieja on the island of La Palma in the Canaries. The last time it erupted, in 1949, it left a 200km3 block of rock hanging precariously over the Atlantic Ocean.
Sometime in the future – it could happen tomorrow, it may not happen for thousands of years – a further eruption will send that rock toppling into the sea, causing a tsunami powerful enough to wipe out the entire Eastern Seaboard of the USA.
How scary are tiny, incremental rises in sea level, compared to that particular scenario?
Sea level is dynamic, in some areas the water level will “appear” to have risen, while in others it will again “appear” to have receded. Many, many factors are constantly at play, including erosion, silting, land depression and uplifting. Some areas of land will be under erosive loss due to currents while other areas will receive the eroded deposit. The measurement is relative. I keep asking myself, who has decided what the exact level is supposed to be, like co2? As it was last year, last millennia, 1000 yrs ago, a million????
Roman London can be 6-8 metres (20ft) below the modern city.
http://www.museumoflondon.org.uk/NR/rdonlyres/93B35BBC-4F9A-4AA5-AE3D-4F07F3C20E81/0/trailmapcream.pdf
http://www.museumoflondon.org.uk/English/Collections/OnlineResources/Londinium/Today/vizrom/
Many of the rivers that flow into the Thames in London are now underground.
http://en.wikipedia.org/wiki/Subterranean_rivers_of_London
It’s only a recent habit to remove old construction before building over the top.
Bangladesh has been gaining land mass over the past 30 years. See graph. While new islands appear and vanish all the time. [pdf paper]
As for coral Atolls in the Pacific ocean:
It’s all scare and no substance in the face of flattening sea level rise since the last Meltwater Pulse.
This is an excellent post for the New Yorkers on this site. I wish that the Rancourt animation had more information with street names and such. Maybe someone knows a Google Maps mashup?
I’d like to know the 1660 boundaries as correspond today. It seems like at Wall Street level the Eastern Boundary was present-day Pearl St. and the Western Boundary is something like present-day Greenwhich st. + West Broadway.
peter_dtm says:
November 28, 2010 at 10:32 am
Here is a starting point.
http://www.numberwatch.co.uk/warmlist.htm
A picture paints a thousand words and, like all the best lies, this one contains elements of the truth.
You’re fighting a losing battle here until you can come up with a more compelling image.
You’d think that the geo-engineers might be looking at that Cumbre Vieja slab for potential action. The problem, as I understand it, is that this mass will fall into the ocean all at once; what I don’t understand is why they aren’t working on ways to bring down parts of this unstable mass in a more controlled manner. Seems to make more sense to me than the hyperventalating over MM Climate Change – which we can’t do anything about even if it were a problem.
Oh my. It really is worse than we thought. If Manhattan has got wider, that means the Hudson has got narrower and the water is running into the sea faster!! /sarc.
They recently found ship remains in the World Trade Center site. The site is about three blocks from the water.
On the other side of the Wall Street area, the water line used to run at today’s Water Street, two blocks from the East River.
I started to boycott ‘Google’ When I looked at ‘Google Earth’, the North Pole pole was all water, an obvious exposure that they are part of the AGW cabal. I don’t know if there is ice there now(on ‘Google Earth’). I’ m boycotting.