
Guest post by Dr. Walt Meier
Now that the summer is over, I thought people might be interested in a bit of retrospective of the sea ice melt season in 2010 and in the longer-term context. NSIDC provided a brief recap and the SEARCH Sea Ice Outlook will soon have their own recap. However, I can explain in a bit more detail and directly address some issues that arose here over the summer.
First, I thank Anthony for this opportunity and him and Steve for their frequent posts this summer, and for the handy sea ice reference page. It is nice to see climate and sea ice issues brought to an audience that might otherwise not hear about them. I hope the information will bring further clarity to some sea ice and polar climate processes. Some of the issues below, I at least touched on earlier this summer in posts here and here. As usual, I’m speaking for myself and not as a representative of the National Snow and Ice Data Center (NSDIC) or the University of Colorado.
Recap of summer predictions
I will start with a discussion of the prognostications from earlier this spring. In the June SEARCH Sea Ice Outlook there was fairly broad range of estimates, from 4.2 to 5.7 million square kilometers. If I remember correctly, Steve and Anthony’s estimates were 5.5 and 5.1 million square kilometers respectively. NSIDC’s initial estimate in June was 5.5 million square kilometers.
The first thing to point out is that none of the estimates approached the 1979-2000 monthly September average of 7.0 million square kilometers. Even the highest estimates were nearly 20% lower. This is a recognition that conditions have clearly changed since the 1980s and 1990s. It is no longer plausible to prognosticate anything near average levels. (For those who are curious, the 1979-2010 average, which of course includes the recent very low years, is 6.58 million square kilometers. Only one outlook (5.7 by Tivy) was within 1 million square kilometers of that value.)
NSIDC’s June estimate was too high compared to what actually happened. This is not at all surprising to me. We used a method that relies on past survival rates of ice of different ages. However, conditions have changed with the Arctic sea ice – the ice overall is thinner and less consolidated. Predictions based on past behavior are less likely to be valid. In other words, the odds of have changed. Steve’s prediction was based on a similar premise – the apparent similarity between winter 2006 and 2010 ice thickness patterns in the PIPS model.
Over the summer there was discussion ascribing the lower than predicted minimum extent primarily to ice motion. Ice motion indeed plays a role in the seasonal evolution of the ice cover as well as the interannual variation in the multiyear ice cover. However, to ascribe all or even the majority of sea ice changes to ice motion is simply wrong. As I discussed in my post earlier this summer, even in an extreme year like 2007, only a third of the extreme loss was due to anomalous ice motion. Over longer time scales, it has been shown that the Arctic Oscillation influences how much multiyear ice (MYI – ice that has survived at least one summer melt season) stays in the Arctic vs. how much leaves the Arctic over the winter, which in turn affects how much ice remains at the end of summer. For example, over the past winter, we had an extreme negative AO, which kept a lot of MYI in the central Arctic.
This summer was not particularly extreme in terms of ice motion. There were times during the summer where the ice pack was pushed together in some places, while at other times the motion was not a factor or even pushed the ice edge outward.
The importance of bottom and lateral melt
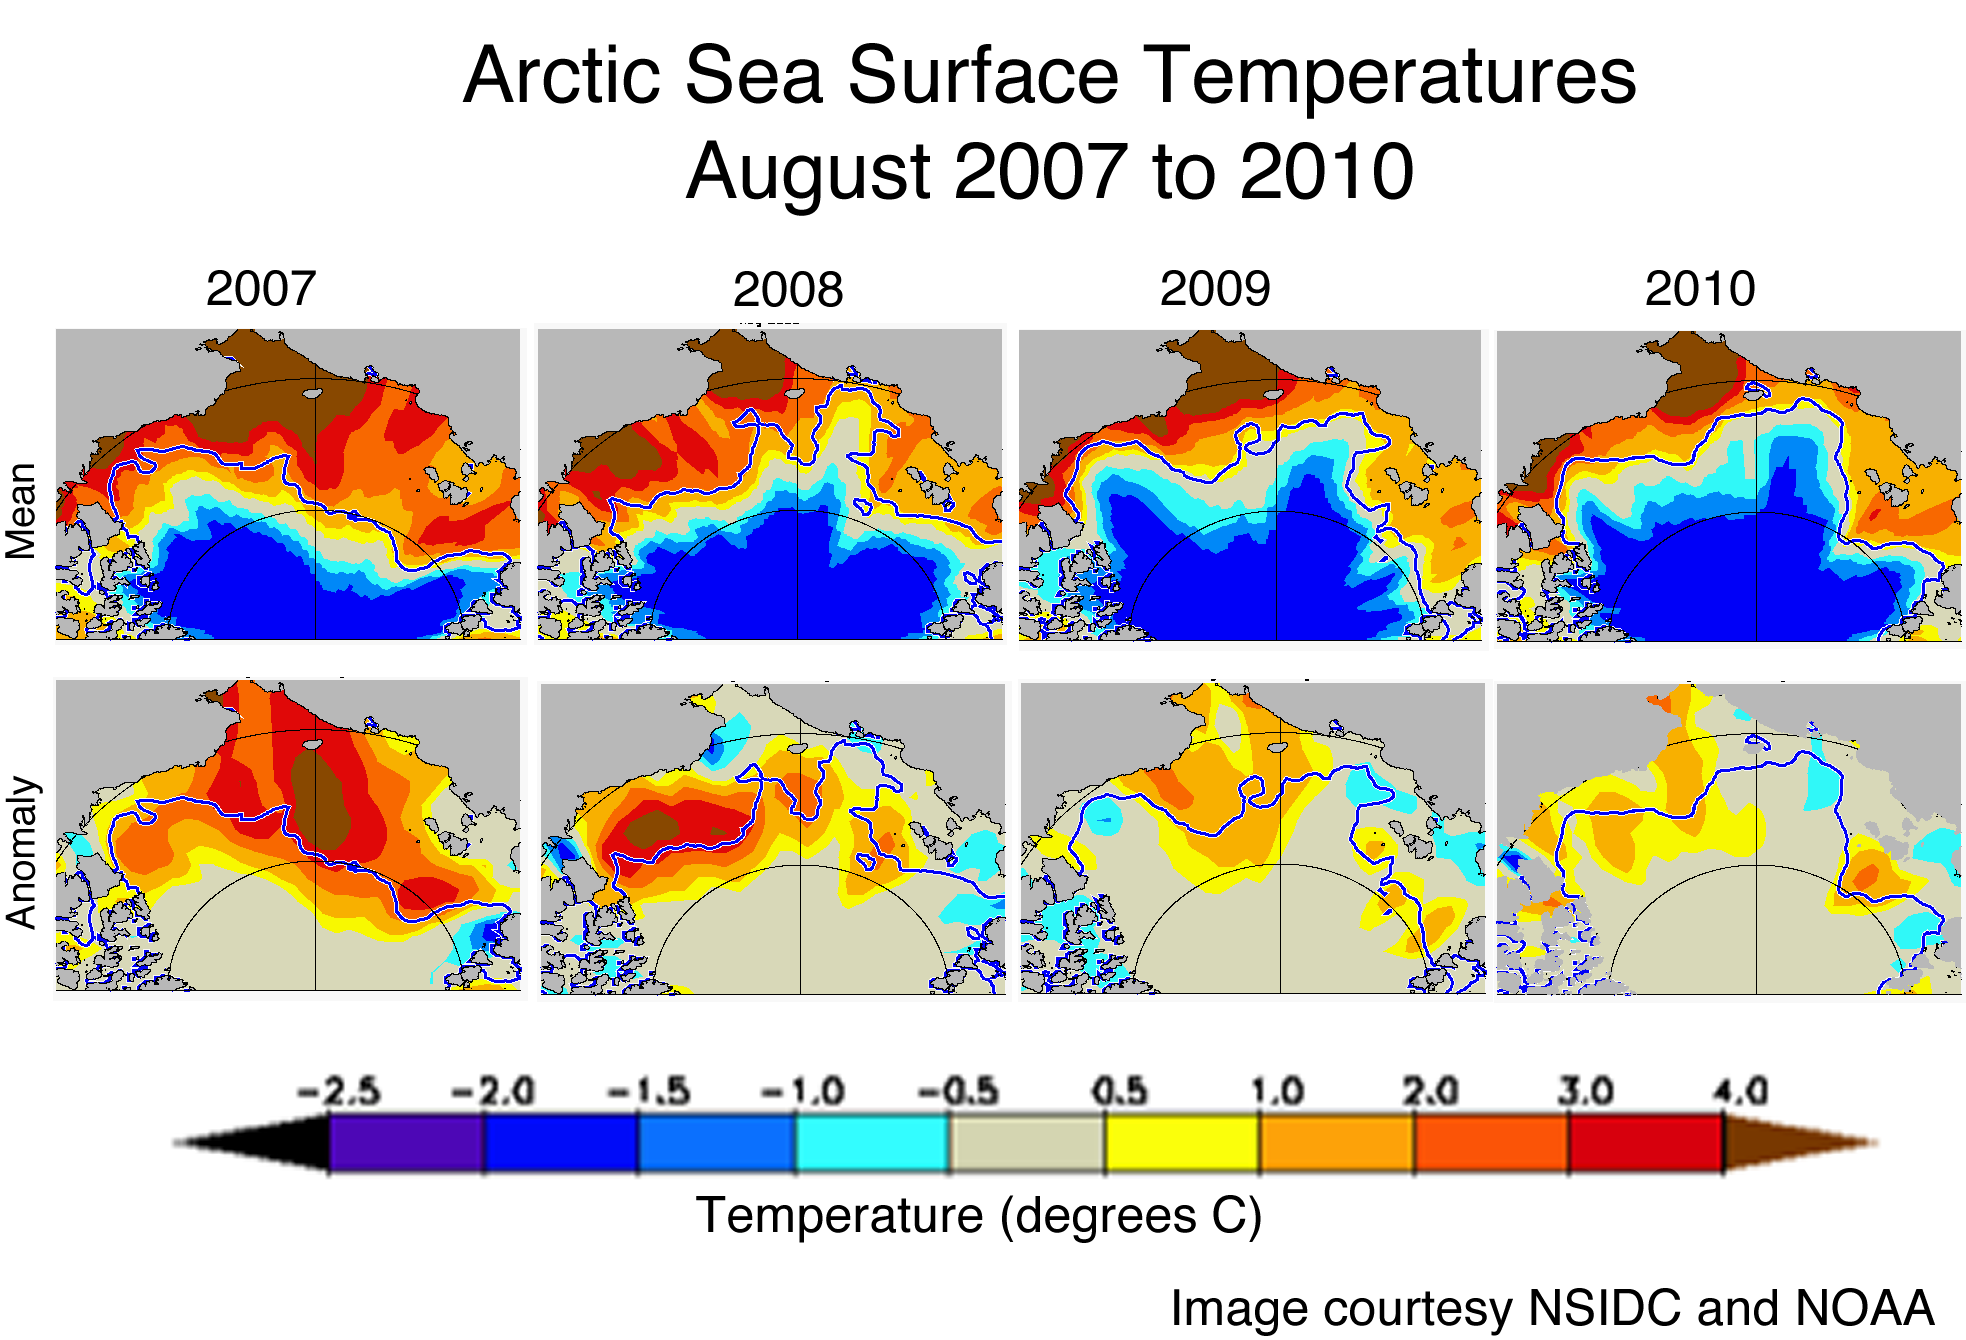
One factor that wasn’t discussed much is melt at the bottom and sides of the ice. This melt depends on the ocean temperatures. During summer when ice melts and open water is exposed, the ocean warms. The ocean accumulates heat which can then melt the ice, both along the edges (lateral melt) of the ice and on the bottom of the ice as currents move the warmer water under the ice and/or the ice is pushed over warmer water by winds. Most of the late season ice melt is due to lateral and bottom melt because the surface has cooled with the setting sun. This explains why even when the DMI air temperatures commonly discussed in the WUWT Sea Ice News, go below freezing around mid-August, there is still another month left in the melt season and extent continues to decline at least a few hundred thousand more square kilometers after mid-August. This year ocean temperatures were not as extreme as the past few summers, but there was still a considerable amount of ocean heat available to melt sea ice.
The bottom line is that while winds can make a difference at times, the overriding factor in seasonal and long-term Arctic sea ice decline is that warmer temperatures lead to less ice.
Why forecasts were too high
The biggest change in the ice over the past several years is that the ice is thinner overall than it used to be and there is less of the thicker, older ice. Another thing is that the old ice that remains is less consolidated – scattered floes of old ice with thinner, younger ice in between instead of tightly packed together. These factors affect the seasonal evolution of the summer sea ice in two ways. First, when the thicker, older ice is in broken up floes, it is more easily “attacked” on all sides by the ocean heat and can potentially be melted completely. Second, the less consolidated ice is more easily pushed around by the ice and more susceptible to winds pushing the ice together – in other words, the effect of the wind is amplified.
I think this is a major reason why a lot of the forecasts were too high. The tongue of mostly MYI in the Beaufort Sea completely melted out. In 2006, there was enough thick and consolidated ice to be vanguard against further ice loss, but by 2010 it was thinner and less consolidated and melted completely (Figure 1). This can be seen clearly in the ice age animation for the past year (Figure 2). The nice thing about these fields is that they show the effect of both motion and melt. If the extent decline were primarily motion, we would simply see the MYI in the Beaufort and Chukchi Seas get pushed together. Instead however, we see the older ice disappear over the summer, i.e., it melts (Figure 2).

Figure 1. Arctic sea ice age during March (left) and September (right) for 2006 (top) and 2010 (bottom). The color key denotes the age of ice (a value of “1” means first-year ice or ice that is 0-1 year old, etc.). Thanks to C. Fowler, Univ. of Colorado, for providing images.

Figure 2. Animation of sea ice age from September 2009 through September 2010. The color key denotes the age of ice (a value of “1” means first-year ice or ice that is 0-1 year old, etc.). The number in the lower right corner denotes the week of the year (1-52). Thanks to C. Fowler, Univ. of Colorado, for providing animation.
After the past couple of summers, there has been a build-up of young MYI – ice between 1 and 3 years old. It had been thought that this MYI would “buffer” the summer ice loss and keep extents from dropping too low. However, watch the animation (Figure 2) closely and see that the 3rd year ice (ice that is 2-3 years old, in green), dispersed and melted or exited out of the Arctic through the winter-spring of 2009-2010. So there was very little replenishment of the older ice. A lot of the 2nd year ice remained at the end of this summer, which has now aged into 3rd year ice. So maybe there’s hope for next year, but what we’re seeing is that the MYI just is not surviving like it used to. There is now almost no ice older than 4 years old remaining in the Arctic. This is a stark and fundamental change in the character of the Arctic sea ice.
PIPS vs. PIOMAS revisited
There was a lot of discussion earlier this year on the PIPS model sea ice fields vs. the PIOMAS model fields (e.g., here). At the beginning of the melt season, PIPS showed quite a bit of thick (3-4 m) ice throughout much of the Arctic Ocean, which wouldn’t be expected to melt completely. This portended less loss of ice during the summer. However, the PIPS fields did not agree well with the ice age fields, which showed less thick ice and a more dispersed multiyear ice cover. As it turned out, I think the PIPS were indeed to too thick, resulting in a forecast that was too high.
On the other hand, the PIOMAS total volume anomaly estimates were quite low going into the summer, indicating thinner ice and suggesting a low extent was likely. As I said previously, the volume seemed to me to be too low. Indeed, the PIOMAS forecast was lower than the actual minimum, though in the end it didn’t do a half-bad job in its prediction (4.7 predicted vs. 4.9 actual, in millions of sq km). To be sure, some of this could be attributed to luck, because there is always the wildcard of what the weather will do over the summer. Regardless, it is clear from the ice age, other ice thickness observations, and the overall state of the ice cover that volume is at or near record lows compared to at least the past 30 years. So while PIOMAS may be biased too low on ice volume, it captures the overall thinning trend and seems to better represent the actual state of the ice cover than PIPS.
Pre-satellite records of sea ice
Whenever I talk about “long-term” trends, I always see comments about how NSIDC’s data are only a 32 year record and hardly constitute “long-term” in the big picture of climate. This is a fair point. However unfortunate though it may be, that is all the data we have, at least in terms of a consistent and complete record. We have some data from earlier decades, but these are incomplete. For example, there was post earlier this week (October 16) about a recent book on longer-term sea ice changes in the 20th century. I read through this book earlier this year, so I’m familiar with it. As the title (“Climate Change in the Eurasian Arctic Shelf Seas”) states, the book analyzes data only the Russian shelf regions of the Arctic – it doesn’t include the central Arctic or U.S./Canadian Arctic, where a significant portion of the decline has occurred over the past decades. Their conclusions are drawn from data through only 2003, so with the recent low years since then, the observed patterns of variability may no longer hold. (There is a final section in the book on 2003-2008 sea ice conditions, but these data are discussed independently and are not incorporated to update their analyses earlier in the book.)
The book only superficially examines ice thickness changes (again only in the Russian shelf regions) and does not examine the recent thickness data from ICESat or the ice age fields. Finally, as it states in conclusion #2: “These cyclic oscillations of sea ice extent were superimposed on the background consisting of a negative long-term linear trend that characterizes gradual decrease of sea ice extent during the 20th century and the beginning of the 21st century.” In other words, even in the Russian data, there is a decline. The authors suggest this decline could be indicative of a longer cycle, but admit that such a conclusion can only be “conjectured”.
So while the book provides useful data (Russian information is often difficult to obtain), their conclusions about reasons for the changes in overall Arctic sea ice and the state of sea ice in the coming decades are more limited than the book seems to suggest. Andy Mahoney (a former colleague of mine at NSIDC) and others also analyzed the Russian data in a paper published in 2008 (Mahoney et al., 2008 – a brief summary is here).
Paleo records of sea ice
Even 100 years is still a fairly short period of time in terms of the history of the earth. However, in terms of climate change, such a period of time is enough discern the influence of large-scale forcing such as anthropogenic greenhouse gases. Nonetheless, it is useful to have longer-term data to understand climate history, particularly in terms of how sensitive various aspects of the climate system, such as sea ice, are to changes in climate forcings. We can obtain some information about earlier sea ice from proxy records, but it gets even more difficult to draw conclusions about conditions Arctic-wide.
For example, there was a post on September 23 about a 2006 paper discussing a proxy record indicating more extensive sea ice now than most of the past 9000 years. However, the paper is about a single record from a single location. It is very difficult to generalize from one isolated observation. As I mentioned in a previous post, the most recent and comprehensive analysis of all available proxy sea ice records, published earlier this year (Polyak et al., 2010 – note that Polyak is a co-author on the 2006 paper), indicates that current total Arctic-wide sea ice extents are likely lower than any time in the last several thousand years and are “not explainable by known natural variabilities”. The data are still sparse, but this is the best information we have at the moment.
The Northwest Passage, Northern Sea Route, and Circumnavigation of the Arctic
Navigation in the Arctic during the summer always gets a lot of interest. People point out that recent sailing expeditions through the Northwest Passage and Northern Sea Route (along the Siberian coast) are not unique in history. This is true. Amundsen navigated through the NWP in 1903, the Canadian vessel St. Roche went through the NWP a couple times in the 1940s. In 1969, the ice-strengthened freighter, USS Manhattan went through with Canadian icebreaker support. There were a few others before 2000. Many required icebreaker support or needed more than one summer to complete the journey (Amundsen needed nearly three summers). The Northeast Passage has been used by the Russians as an icebreaker-supported shipping route for many years and several ships have made the voyage.
However, this doesn’t mean conditions in the past were anything like today. They were not. While conditions will vary from year-to-year and I think it will be some time before either passage (especially the NWP) will be a reliable route, both passages have been far more open in recent years than in the past. What used to be a risky proposition, carefully navigating through narrow openings between ice floes, has in recent years become a mostly open water cruise with occasional ice (though still dangerous because even relatively small scattered floes of ice can damage a vessel). This year two vessels circumnavigated the pole through the two passages within one summer. In addition, several other vessels went through at least one of the passages this year. This is really quite remarkable and something I doubt anyone in the 20th century ever thought would be possible in 2010.
(Some complained when these expeditions were called “circumnavigating the Arctic” or “circumnavigating the Arctic Ocean” because they went south of Greenland. To technically circumnavigate the Arctic Ocean, one would need to follow the coast along the north coast of Greenland. This is true, but it in no way diminishes the feats nor does it contradict the reality that the Arctic is very different place than it was just twenty or thirty years ago.)
Antarctic sea ice
During the past Arctic summer, the Antarctic winter sea ice was showing some interesting behavior. As the Arctic ice declined, Antarctic ice went to much higher than normal levels. This caused a bit of a stir. It seemed like the Antarctic was headed to a record-shattering maximum. Alas, this did not happen. The extent went back to down to normal. Now it is again above normal. Such variability is characteristic of the Antarctic, especially in winter. The entire circumference of the Antarctic continent is surrounded by sea ice. Most of the ice is less than 1 meter thick, and much of it is less than 0.5 meters, particularly near the ice edge. This means shifts in currents and winds can quite quickly shift the ice edge in or out. So fairly dramatic ups and downs in Antarctic sea ice extent are not uncommon.
Nonethless, over the satellite record there is a small upward trend in overall Antarctic sea ice extent. The magnitude of the trend is much smaller than the Arctic (1-4% per decade vs. 3-11% per decade, depending on the month). And when you look at the spatial trends, where the decline is occurring, you see an interesting difference. In the Arctic, there is decline in almost all regions throughout the entire year (the Bering Sea during winter being the lone exception). In the Antarctic, all months are characterized by variation in the trends – in one region there is an increasing trend in extent and in another region there is a decrease (Figure 3). This is a clue that a main driver is changing circulation patterns, and indeed the changes in Antarctic sea ice have been linked to changes in circulation from the Southern Annular Mode (SAM – kind of an Arctic Oscillation [AO] for the southern hemisphere), for example in Turner et al. (2010) (key points can be read here). Circulation changes affect the Arctic sea ice too of course, particularly the AO, but the impact is even greater in the Antarctic because the ice is so thin and the ice boundary is completely open throughout the year (as opposed to the Arctic where for much of the year most of the ice edge borders the coast).

Figure 3. Trends in Arctic (top) and Antarctic (bottom) sea ice for (from left to right): September, December, March, and June. Red shades mean an increasing trend of sea ice; blue shades mean a decreasing trend. Images from the NSIDC Sea Ice Index. Other months show similar patterns and can be viewed using the Sea Ice Index browse tool.
But why has the SAM changed? Some scientists have suggested that a possible mechanism is the ozone hole. The ozone hole changes circulation high in the atmosphere, which then changes circulation at the surface. It is a plausible theory, supported by some evidence (discussed for example in Turner et al., 2010), but still tentative. Recently, there was paper (Sigmond and Fyfe, 2010) that showed results of a modeling study where the ozone hole did not increase sea ice in their model as had been expected (discussed here). It is rare these days that a single paper provides a final answer, so while the results are intriguing, it could be that the model is not capturing all the physical processes (e.g., the details of the interaction between snow and sea ice discussed below); or it could be that the model results are correct and a new explanation is needed.
Another study that was mentioned this past summer, discussed here, was the paper by Liu and Curry (2010) on the seeming contradiction that warmer temperatures over the Antarctic Ocean can lead to more sea ice (at least for a while). This seems counterintuitive, especially in light of my comment about the Arctic sea ice and temperatures above.
The key is that the Antarctic and the Arctic sea ice regions are very different places. In the Arctic, we have a relatively shallow, semi-enclosed body of water. There is a lot of freshwater from rivers input into the surface of the ocean. This less saline water floats on the surface, while heavier and warmer water sits below – in other words the ocean is stratified. That heavier water has a lot of heat in it, but it is difficult for the heat to reach the ice. The waters in the Antarctic are not well-stratified and there is a lot of potential heat from the ocean that can melt ice.
Another difference is that because the Arctic Ocean is almost completely surrounded by land, there is not as much moisture available and snow fall is relatively low. In contrast, Antarctica is surrounded on all sides by an ocean. While the middle of the Antarctic continent is a desert (because moisture cannot reach the high altitudes inland), the coastal and sea ice regions actually receive a lot of snow.
The snow has two effects. First, when it falls into the open ocean, it serves to freshen (and hence stratify) the surface layers. Then the more stable ocean surface makes sea ice formation easier by keeping more ocean heat below the surface. Second, when it falls onto sea ice it accumulates on top and “weighs down” the sea ice. With Antarctic sea ice being on average much thinner than the Arctic, it is not uncommon for the weight of the snow to push the top surface of the ice below the water line. When this occurs, the snow gets flooded by the ocean waters, which then freeze and form what is called “snow ice”. Effectively, the snow is converted to ice and thickens the ice cover.
When the atmosphere is warmer, it can hold more moisture, which in the Southern Ocean will fall as snow. This increase in snowfall then leads to more sea ice growth. This potential effect has been long known to scientists, and Liu and Curry’s paper is evidence that supports this idea (with the same caveats above that this is just one paper). Thus, warmer temperatures can lead to more sea ice. At least up to a point. If, as expected, temperatures continue to warm over the Southern Ocean, eventually the direct effect of the warmer temperatures will overtake the indirect effect on sea ice via snow fall, and Antarctic sea ice will begin to decline.
Conclusion
Though I don’t have time to read nearly all of the posts here and even fewer of the comments, I am often impressed by the interest and passion expressed therein. I’m sure I haven’t answered all questions about sea ice here, but I hope I’ve addressed many things that people have been curious about, particularly issues that have come up over this past summer.
References
Liu, J., and J.A. Curry, 2010. Accelerated warming of the Southern Ocean its impacts on the hydrological cycle and sea ice, Proc. Nat’l Academies of Science, 107(34), 14987-14992, doi:10.1073/pnas.1003336107.
Mahoney, A.R., R.G. Barry, V. Smolyanitsky, and F. Fetterer, 2008. Observed sea ice extent in the Russian Arctic, 1933-2006, J. Geophysical Research, 113(C11005), doi:10.1029/2008JC004830.
Polyak, L., and 17 others, 2010. History of sea ice in the Arctic, Quaternary Science Rev., 29, 1757-1778, doi:10.1016/j.quascirev.2010.02.010.
Sigmond, M., and J. C. Fyfe (2010), Has the ozone hole contributed to increased Antarctic sea ice extent?, Geophys. Res. Lett., 37, L18502, doi:10.1029/2010GL044301.
Turner, J., R.A. Bindschadler, P. Convey, G. Di Prisco, E. Fahrbach, J. Gutt, D.A. Hodgson, P.A. Mayewski, and C.P. Summerhayes, 2010. Antarctic Climate Change and the Environment, Scientific Committee on Scientific Research (SCAR), ISBN 978-0-948277-22-1. http://www.scar.org/publications/occasionals/acce.html
The Vikings circumnavigated Greenland?
Really,
That’s news to me.
When and who?
Peter Foster says:
October 21, 2010 at 10:57 am
“One other aspect of snow on ice, is that if sea ice forms in quiet sea conditions it is transparent and allows IR radiation from the ocean to pass through it, thus allowing the ocean to lose heat.”
I should think the most significant effect of clear ice is that it works like a real greenhouse and blocks cooling by convection, evaporation, mixing of air and water, and longwave radiation (I don’t believe ice is very transparent to longwave) while allowing the shortwave radiation from the sun to penetrate and warm the water below it.
However, when it is covered with snow, the snow acts to reflect IR back into the ocean and so has an insulating effect which then allows upper ocean heat to increase and assist with ice melt.
Where developing ice is repeatedly smashed up by rough seas or strong winds then the effect is probably minimal but in Antarctica there are large areas of sea ice that form as a smooth sheet.
Perhaps Dr Meier could comment on the significance (or insignificance) of this effect.
Dr Meier
Thanks for your informative posts. I wonder if you can tell me the tidal fluctuation in the arctic? In our part of the world (Southern UK) a very high spring tide would come in at around 5.2 metres. A low one around 3.1metres. On top of this are waves that can be up to around 2 metres although around 60cm is more common.
If the arctic conditions are anything like similar its a wonder to me that any sea ice at all survives a summer. Can you help with any figures?
Also as regards to the ozone hole , how do we know it hasn’t always been there growing and shrinking in a random fashion. We have only had the instruments to measure it since the late 1950’s. How do we know it wasn’t much bigger (or smaller) in previous centuries?
tonyb
Only the first paragraph outside quotes in my response to Foster above is mine. The remainder is from Foster’s comment and should have been snipped.
Many thanks Walt,
This is why I love to visit WUWT as often as I am able, your post was very interesting indeed and written in a way that is understandable to the laypersons among us. All we have ever wanted is good accurate unbiased information and you have just served up a goodly portion of it.
Thank you again for sharing your insights and I hope you post again when more information comes to light, you can see just why WUWT has become the worlds leading science blog and Mr Watts is a person that does immense service to science as a whole, one day I hope his efforts will be recognized.
Yours in gratitude
Cassie K.
bob says:
October 21, 2010 at 12:17 pm
The Danish archaeologists are finding remnants of Erik and Leif’s descendants farther and farther up the east and west coasts. When the ice melts further north (ROTFLOL), then we will find more artefacts, I’m sure. And more graves and settlements.
No, we don’t have a press release from 1000 AD to confirm the circumnavigation.
Kiwi Yachtsman, Graeme Kendall, completes world sailing firsts;
Arctic North West Passage solo, non stop & in a record 12 days.
http://www.astralexpress.com/
You can read all his logs here too.
My question is that if the paleo study that shows ice levels over thousands of years much lower in the past is climatologically dubious, then how can you draw any climatological conclusion from 30 years of studies?
Thank you for your time and for coming here.
I find this interesting (SNOW). “when it falls onto sea ice it accumulates on top and “weighs down” the sea ice. With Antarctic sea ice being on average much thinner than the Arctic, it is not uncommon for the weight of the snow to push the top surface of the ice below the water line. When this occurs, the snow gets flooded by the ocean waters, which then freeze and form what is called “snow ice”. Effectively, the snow is converted to ice and thickens the ice cover.
If it snows alot on to sea ice can this raise sea leeves[sic ~ac]?.
sorry levels.
Thank you, Dr Meier, for a very interesting and informative article. Thank you also for not treating us like idiots. That animation is one of the best I’ve seen, although I don’t remember the ice retreating to the extent that it shows.
This year was always going to be a crap-shoot what with the strong El Nino, but I fully expect the ice to continue its recovery next year, especially if the regrowth to date is anything to go by.
Lastly, have you any comment to make with regard to the growing divergence between NSIDC sea ice extent and Jaxa? There was some 500,000 sq. km of a difference this year, from virtual parity in 2006.
Hey Pascvaks,
The ice sheet at the north pole acts like a thermostat – a negative feedback control. When ice builds up, this causes the Earth to warm. When the ice melts, the Earth cools. It is amazing how many “climatologists” don’t understand thermodynamics.
Good post. Clear and informative.
Same biased stuff by Meier who never answers the key question: if arctic sea ice was so stable in the past, where is the 100y, 50y or even 25 y old sea ice gone? Dr. Meier also shows his limited knowledge of atmospheric circulation patterns when comparing snowfalls between hemispheres, and of course fails to explain the recurrent shape of the non melting arctic ice, hardly dicatated by CO2 concentrations.
Despite a soporific tone, this is simply a rehash of the Serreze hardline.
bubbagyro says
“The Danish archaeologists are finding remnants of Erik and Leif’s descendants farther and farther up the east and west coasts. When the ice melts further north (ROTFLOL), then we will find more artefacts, I’m sure. And more graves and settlements.”
Ah, the mythical voyages of the descendants of Erik and Leif.
You are aware, are you not, that the coastline of Greenland is quite free of glaciers and ice for a substantial extent. Close to but perhaps not quite half.
And are you familiar with the topography of Pearyland, if there was evidence that Vikings were ever there, well its not buried by ice. There is evidence of Inuit culture there.
So, I’m still waiting for evidence of the circumnavigation of Greenland.
Thank you Dr Meier.
so it appears everyone is in agreement that the Arctic Ocean is warming thus melting the ice.
I draw you attention to lead scientist Ralph von Frese of Ohio State University who in 2007 suggested that the earth’s crust under the NE corner of Greenland was thinning and the rising magma was causing the ice to melt where previously there had been no melting.
This was followed in 2008 where a research team led by the Woods Hole Oceanographic Institution (WHOI) uncovered evidence of explosive volcanic eruptions deep beneath the ice-covered surface of the Arctic Ocean. The volcanoes lie along the Gakkel Ridge, a remote and mostly unexplored section of the mid-ocean ridge system that runs through the Arctic Ocean.
Then just recently the volcano in Iceland finally blew ( I won’t attempt to spell it)
As the Arctic ocean is basically trapped within a circle of land could this increase in submarine volcanic activity be causing the Arctic ocean to warm?
The voyage of the Manhattan was very controversial. It was an attempt to traverse the Northwest passage to show that it an international waters and not Canadian territorial waters. The Manhattan was intended to make the trip without assistance to prove that t Northwest passage was open, Supposedly there were American oil company maps showing it as international waters. This was in the newspapers so the maps may be more of less imaginary.
In any event the Manhattan could not traverse the passage on tis own and had to use Canadian icebreakers to be freed from the ice that had beset it.
So we ahve two things of interest here>
a) there was thought in the 1960s that teh NWP ws opne. This thought was strong enough to lead to the conversion of an oil tankers.
b) the oil tanker’s attempt was not successful
So was eh NWP open in the 1960s or not? This does have a bearing on the current discussion. Not mentioned in the article is that the second St. Roche voyage in 1943 found the NWP passage to be free of ice. Previous attempts have found a passage free of ice as well. If that had been the case or even if the ice had been slightly less, the Manhattan would have succeeded and the current discussion would be quite different.
My take away – a good description of system changes seen over an arbitrary time period. The short description period is also the only period of record. Speculation followed.
Since Dr. Meier is a contributor to this NOAA report and that many affirmations here can be questionned this should interest WUWT readership:
http://beta.images.theglobeandmail.com/archive/00958/Read_the_Arctic_Rep_958042a.pdf
Thank you Dr. Meier,
I liked your comment “nor does it contradict the reality that the Arctic is very different place than it was just twenty or thirty years ago.” Indeed, the Arctic will again be different in another twenty or thirty years, but probably it willthen be just like it was forty or sixty years ago.
Humans on the surface of the Earth have as much relevance as lichen on rocks in the long term. The planet will be here, long after humans become extinct. It is the nature of the Universe. We cannot “save the planet”, nor does it need saving. Are we worth saving? Unlikely.
” And whether or not it is clear to you, no doubt the universe is unfolding as it should.”
Regards,
Perry
This just in:
Report: Arctic temperature rising at near record rates, sea ice melting faster
1:56 p.m. CDT, October 21, 2010
WASHINGTON (AP) — The temperature is rising again in the Arctic, with the sea ice extent dropping to one of the lowest levels on record, climate scientists reported Thursday.
http://www.chicagotribune.com/news/nationworld/sns-ap-us-sci-arctic-warming,0,7127804.story
Perry: “Are we worth saving? Unlikely.”
Speak for yourself!
Perry: “Indeed, the Arctic will again be different in another twenty or thirty years, but probably it will then be just like it was forty or sixty years ago.”
There is no credible evidence for this claim.
Look at this graph closely
http://ocean.dmi.dk/arctic/icecover.uk.php
Is 2010 ice showing less or more than 2009, 2008 and 2007 what are your conclusions?
Dr. Meier,
Thanks. For the clean and clear text.
For (almost) the same solution enthalpy. I can get different entropic solutions.
example,
http://www.ehow.co.uk/about_6301314_do-want-frost-freezer_.html
And yet one more thank you for a clear, interesting, informative post here. 🙂