Hot summer after a cold winter
Joe D’Aleo, ICECAP
Washington DC and many cities of the east and south had a warm to record warm summer (while parts of the west had a cold to record cold) with the average for the nation the 4th warmest on record. For Washington, it broke many of the records set in 1980 and 1988. It tied with the number of 90F days set in 1988 and fell just 12 days short of the number of 90F days for the year (a few additional still possible) set in 1980.
A hot summer is very typical when a strong La Nina follows a strong El Nino winter (1999, 1988, 1966) or when record strong arctic blocking in winter fades (1977). This past winter we saw a record for negative Arctic Oscillation (AO) beating out 1976/77 and 1965/66

The summer was 2.2F above normal for the nation, ranking it as fourth warmest. See map:

That matches how much last winter the US averaged below normal (2.2F). Last winter was coldest in the south and southeast (in a few spots, coldest ever). Colder to the south of DC but recall DC and surroundings had a record seasonal snowfall.

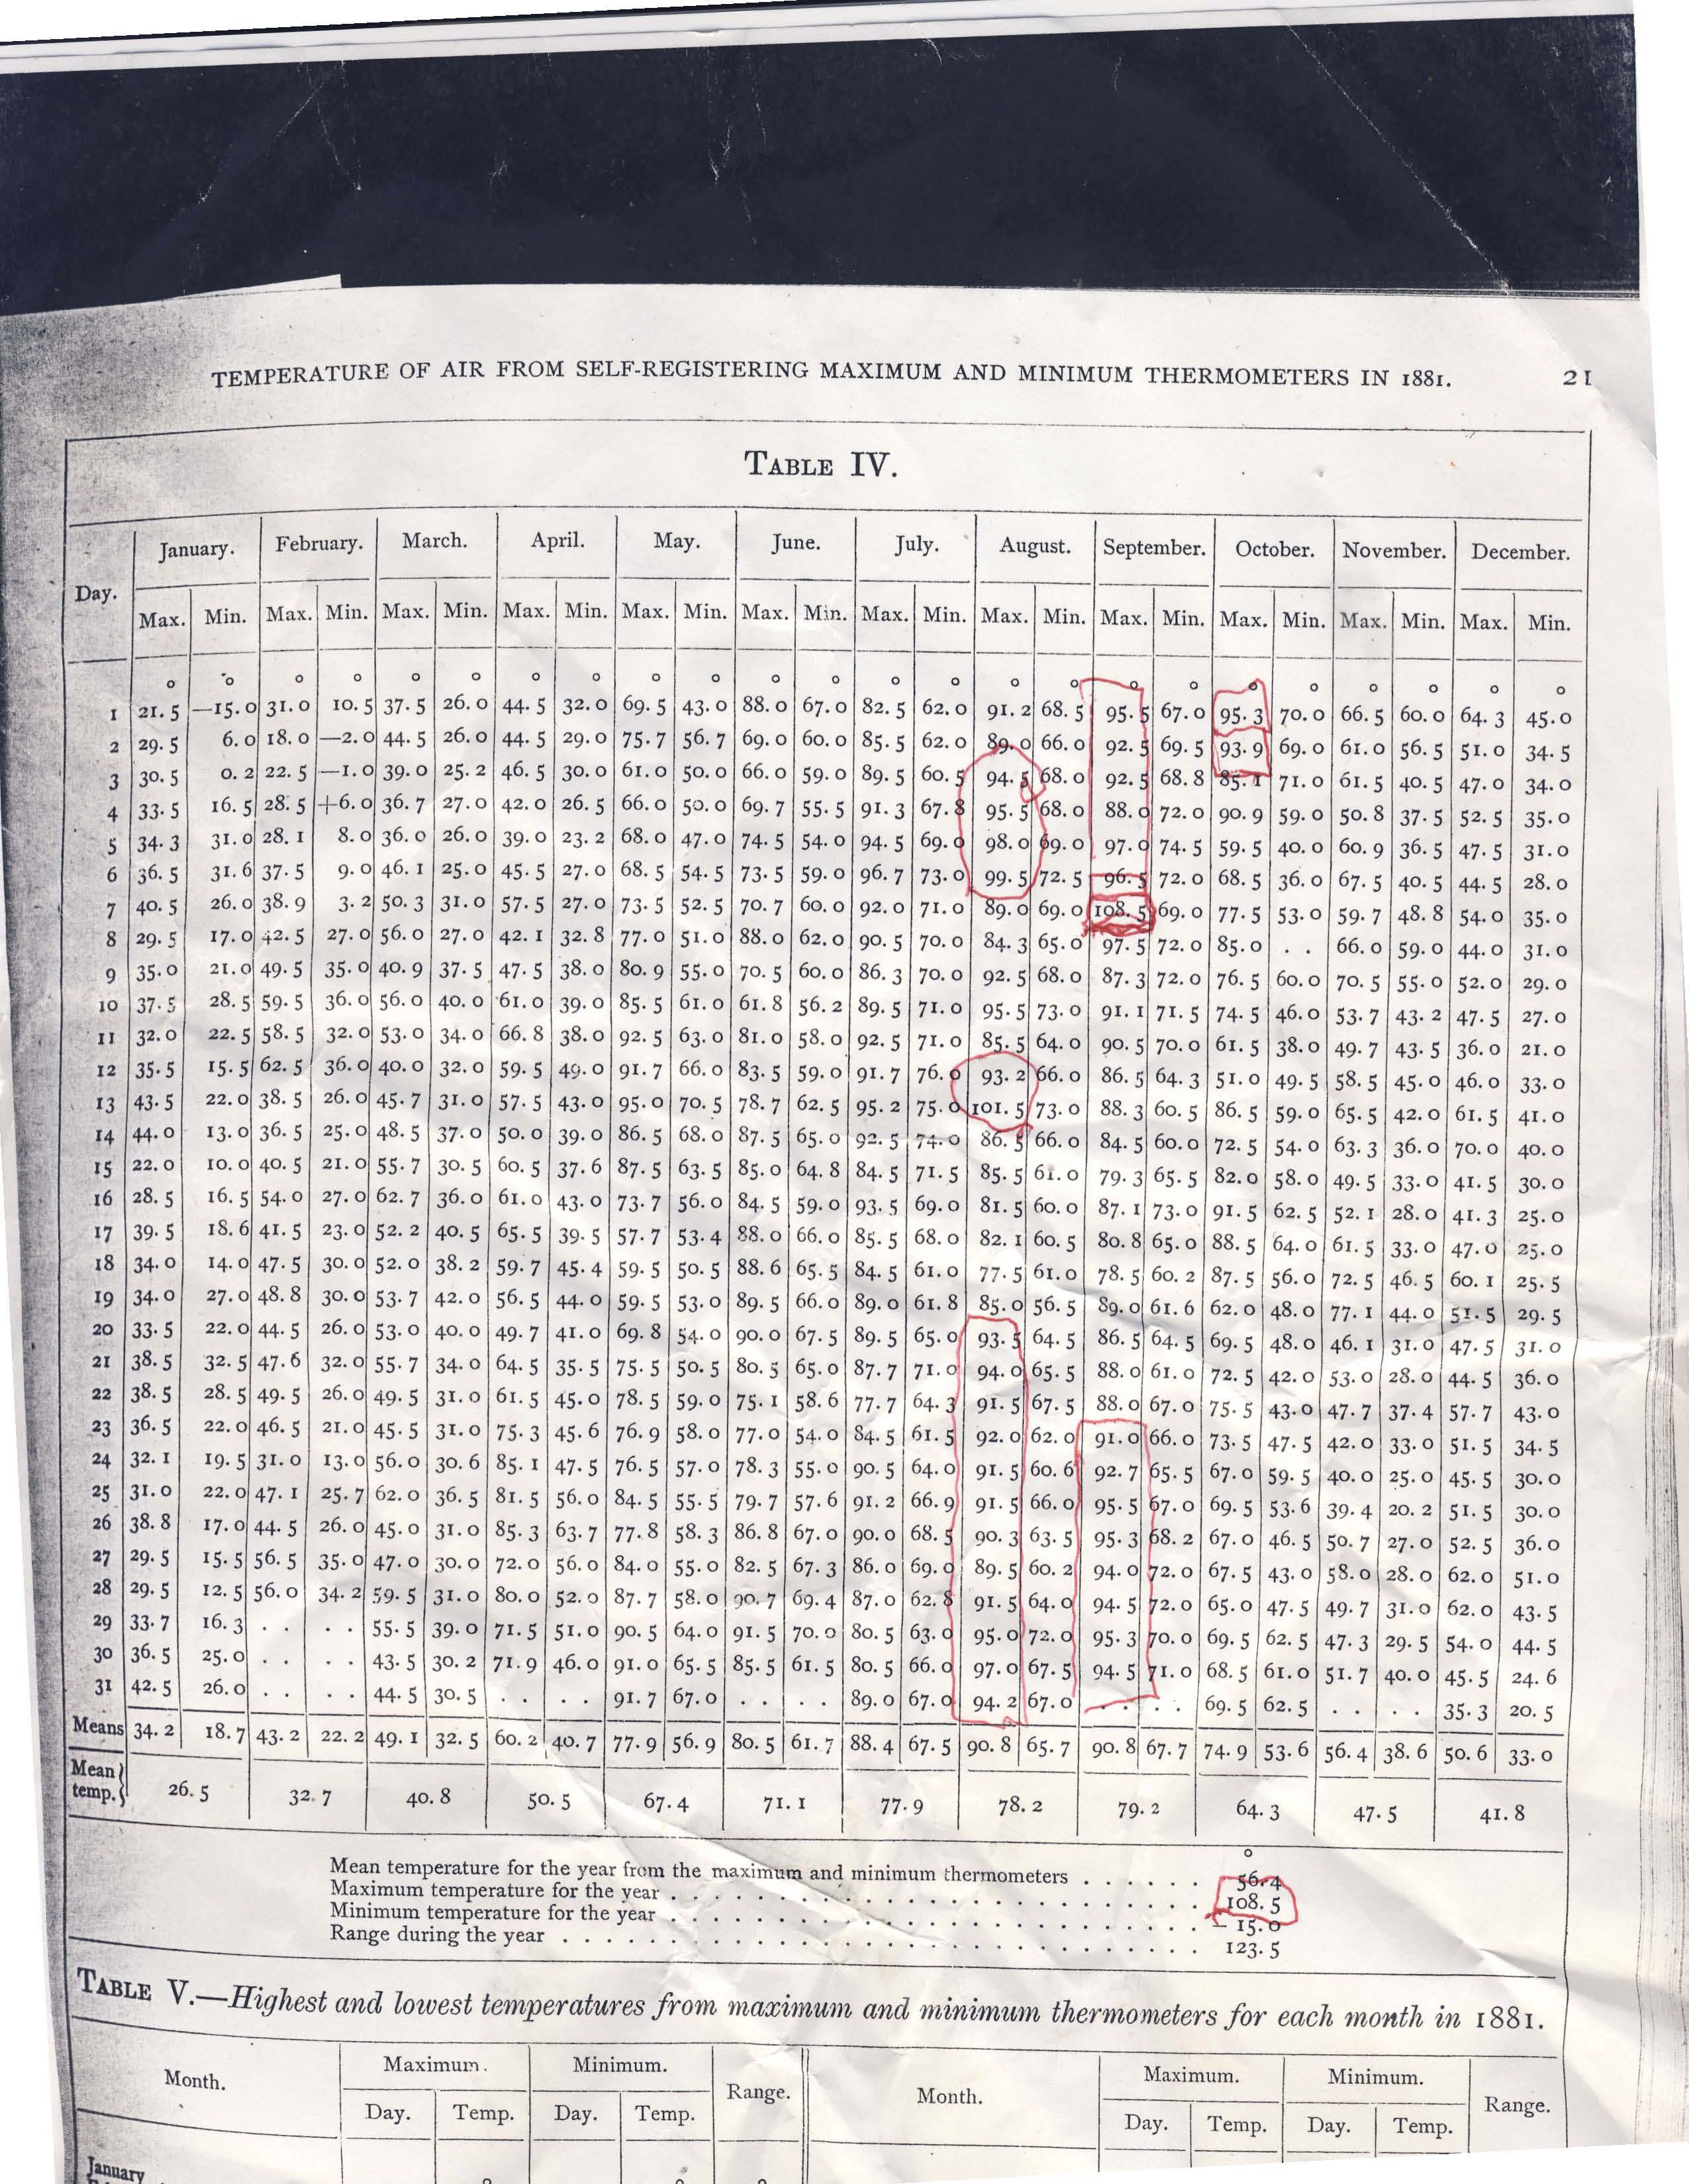
Besides 1980, 1988, other hot summers included 1881, where this record from “Andy” out of the Naval Observatory shows an amazing summer following a very cold January/winter. He writes:
I am attaching a rather rare document, Washington DC weather records for the year 1881 taken at the Naval Observatory.
I have highlighted an incredible late summer, early autumn heat wave that got started on August 20th and did not really end until October 4th. There has never been anything remotely approaching the intensity and duration of this heat wave for so late in the year in modern times.
An unbelievable temperature of 108.5 was recorded on the very late date of September 7th! Also the average September average high temperature of 90.8 dwarfs anything you can find in recent years. One could argue that the site or thermometer might reflect a warm bias. Examining the data, June was actually quite cool and July was about average. And back then, no one was pushing an agenda!
The summer this year was characterized by hot days with high humidities and thus very warm nights. Nighttime lows were especially above the normal. Ironically many of the same areas with warmth this summer had very cool summers the last two years with a record/near record cold July in 2009.

That was consistent with a summer after a La Nina winter, one with low solar and high latitude volcanic activity. Last summer and last winter we were told that was weather not climate. This makes any claims that a hot summer this year is indicative of a warming world disingenuous. With La Nina coming on, look for a cool summer again next year. With a negative PDO look for colder years ahead. This will accelerate when the Atlantic cools. The active hurricane season will remove some of the heat built up in the Atlantic by the El Nino suppressed activity last year and reduced winds (mixing) and increased sunshine with a suppressed jet stream, weakened suppressed subtropical high pressure due to record blocking this past winter.
Hmm. noticed the most populated (warm) areas are in the East UHE? in the mix too?
Meanwhile in Australia, Melbourne has according to BoM had a record cool start to spring still not having recorded a day above 17 degrees C. This is also due to a strong La Nina.
I read the book 1776 while on vacation, and it looks like that year in New England was a La Nina year. The summer was very hot, and the autumn was abnormally warm and dry, except when ferocious storms rolled through that were described as having an intensity suitable for hurricanes. The winter was harsh, complete with a frozen Delaware River and blizzards.
It’s pretty remarkable–and fortunate–that people bothered to keep meticulous records of the weather in that time despite the turmoil.
I give up. Warming is real.
This report means nothing to me because it does not distinguish between daytime highs and nighttime lows. Ninety degrees at three in the afternoon means something very different from ninety degrees at one in the morning. The latter can be caused by UHI. When showing charts of the sort shown above, there should always be two sets of charts, one for daytime and one for nighttime. It is really important. I am not at all impressed by higher temperatures at nighttime. I am greatly impressed by the fact that daytime temperatures are not rising. We will undoubtedly discover that we need more than two temperature measurements during each day. An entirely new regime of temperature measurement is sorely needed.
I can tell you that that map for Mason County West Virginia is absolutely false. For June to August we were just below normal to normal. When I see those maps, and they differ from the actual temperatures in our location I have no other choice but to believe that something untoward us going on at NASA. Someone can argue means and averages all they want but my slice of WV should be green on that Jun-Aug map.
“With La Nina coming on, look for a cool summer again next year. With a negative PDO look for colder years ahead. ”
You’ve been pushing this ridiculous meme for some time. If 2010 is indeed going to be the warmest on record than it’s fairly easy to guess that next year will be cooler, but how about making a real prediction. Why don’t you come out and make a prediction that the 2010’s will be cooler than the 2000s, or something like that.
First US Map: For a lot of California, especially Northern Ca from the Oregon border to Sacramento, summer was late to very very late. Temps averaged very below normal, 5 degrees in most places, and at times dropped to 10 degrees below normal for entire weeks. So, as long as comparisons are going to be made and believed, the 1st thing that has to happen is to establish confidence in the data reported. Many gardens either failed or were extremely late in this state.
Far as I can tell, numbers are fudged upwards for California from what really happened, and I assume that fudging was propagated to many other states.
Sorry, NOAA, but your believability rating is not so stellar.
Mark S wants a prediction. How about an unusual November chill sweeps leftists out of Washington?
It will be interesting to see the statistics for the UK. As everyone knows, the MET office is very pro AGW. However, in the UK, we had a cold winter (said to be the coldest for about 30 years) and we have had a cold summer (late June and July were warm but August and September has been cold). Tonight frost has even been forecasted for some parts of the South East.
I am waiting to see the spin on it when the ‘data’ is reported.
“but my slice of WV should be green on that Jun-Aug map.”
And I must have missed that cool green summer in South Texas.
Last summer was worse ( a triple digit Tmax almost every day) than this year,
but I can’t believe this year was below average. Could be my comfort zone is shrinking.
OT: Is that a sizable sunspot rotating into view?
Mark S says:
September 17, 2010 at 7:36 pm
2010 will only be the warmest year in the fantasy world of James Hansen. And spare us the faux outrage. If next summer we’re still experiencing la nina, it will be cooler. It isn’t a meme. It’s a simple observation.
If 2010 is indeed going to be the warmest on record than it’s fairly easy to guess that next year will be cooler,
Is that your winning method at the roulette wheel?
The White House and NASA are making press announcements today to promote Global Climate Disturbance (destruction) instead of GW and pronouncing 2010 to tie 1998 as the hottest year on record – globally. The political spin continues.
Meanwhile the US Chamber of Commerce and the State of Texas have separately filed suits that the US EPA had no basis to list CO2 as a criteria pollutant under the Clean Air Act. These suits are filed in different federal districts. Conflicting rulings will likely end up at the Supreme Court.
So California has Proposition 23 (November 2 ballot) to set aside its “Climate Change” (California’s phrase) program. They (CARB) says that the Western States’ Initiative ( CA, New Mexico, some Canadian provinces) is set to be ready to go.
What a mess. Note that the Texas suit is filed on the grounds that the conclusions of the IPCC, that were relied upon by the US EPA, are bogus and were demonstrated to be bogus based upon the UEA Climate gate affair and subsequent revelations about the IPCC use of inappropriate statements of data and conclusion. Texas may have just forced a federal court to get involved in climategate. No more whitewash.
I realize that this may be OT, but thought that we all benefit by this information.
Note NOAA’s quoted Long Term Average on the first anomaly chart. The selection of the period for the average means everything in calculating the anomaly. The period selected conveniently avoids the 30’s/40’s, and the late 90’s. So NOAA’s anomaly here has no meaning whatsoever, apart from its relationship to the stated period. There’s nothing proven or accomplished otherwise. To keep the fantasy of warming alive, we’re likely to see that period settle more and more, until it is only the winter of 1977.
Tom in Texas says: at 7:59 pm
“OT: Is that a sizable sunspot rotating into view?”
Sunspot? Yes. Have a look here:
http://www.solarcycle24.com/
Perhaps there should be an agreed upon “long term average” for it seems that NOAA documents leave this to the whims of the individuals writing these things up. For example, this one has the period 1901-2000. The report is dated May 7, 2010.
http://www.noaanews.noaa.gov/stories2010/20100507_aprilstats.html
I doubt there is going to be a significant difference regarding interpretation but, still, it seems unnecessary and odd.
Hardly surprising: effects of large high pressure anticyclones are heatwaves in summer and cold spells in winter, hence the temperature data over the US.
Theo Goodwin says:
September 17, 2010 at 7:35 pm
This report means nothing to me because it does not distinguish between daytime highs and nighttime lows.
Have a look at :
http://neo.sci.gsfc.nasa.gov/Search.htm
You can choose night or day, temperature or anomaly and supposedly do your own analysis
“This past winter we saw a record for negative Arctic Oscillation (AO) beating out 1976/77 and 1965/66”
And, similarly for the period of record, low solar activity.
Could there be a link ?
Mark S says:
September 17, 2010 at 7:36 pm
If someone is saying that 2010 is going to be the warmest on record based on the first 2/3 of a year, you might do well to challenge him to a bet.
From “regression to the mean” to signs that La Niña cooling is settling in, I don’t think the weather will keep up with a record pace.
The White House and NASA are making press announcements today to promote Global Climate Disturbance (destruction) instead of GW and pronouncing 2010 to tie 1998 as the hottest year on record – globally.
Policyguy, what do you make of the global temperatures for the period May 2009 – April 2010 (or June 2009 – May 2010)?
John F. Hultquist says:
September 17, 2010 at 8:39 pm
Tom in Texas says: at 7:59 pm
“OT: Is that a sizable sunspot rotating into view?”
Sunspot? Yes. Have a look here:
http://www.solarcycle24.com/
Wake me up when the corrected total sunspot area breaks 1,000:
ftp://fenyi.solarobs.unideb.hu/pub/SDD/data/hQL_SDD2010.txt
http://www.swpc.noaa.gov/ftpdir/indices/quar_DSD.txt
Really wake me up when we get anywhere near this day in SC23:
2003 10 30 271 293 5690 2 -999 C2.8 6 2 0 2 2 0 0
Looks like NASA and NOAA have taken up the Hide the decline that EAU/MET/Jones were doing.. just looking at regional temps for areas they are 1.5 deg C to high… in most of them…
Looks like an agenda thing to me…
“This trend was seen to continue in observations of the first sunspots of the new solar Cycle 24, and extrapolating a linear fit to this trend would lead to only half the number of spots in Cycle 24 compared to Cycle 23, and imply virtually no sunspots in Cycle 25. ”
http://arxiv.org/abs/1009.0784v1
I wonder if the SUN has anything to do with this…. COOLING?