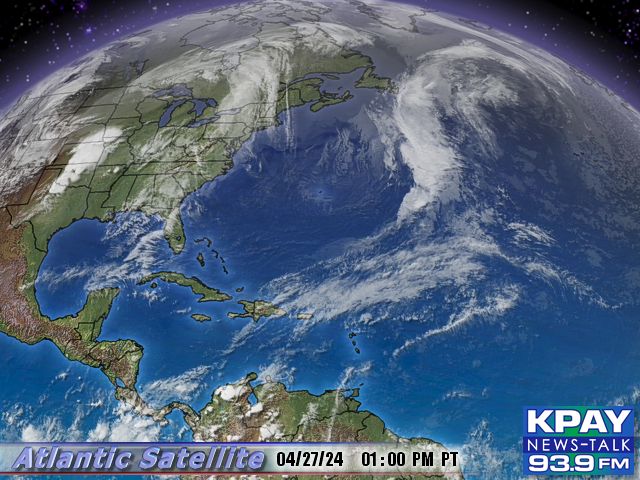
But just barely…see Danielle in lower right of image
Latest news:
WTNT31 KNHC 250256
TCPAT1
BULLETIN
HURRICANE DANIELLE ADVISORY NUMBER 14
NWS TPC/NATIONAL HURRICANE CENTER MIAMI FL AL062010
1100 PM AST TUE AUG 24 2010
…DANIELLE A HURRICANE AGAIN…
SUMMARY OF 1100 PM AST…0300 UTC…INFORMATION
———————————————–
LOCATION…18.2N 49.8W
ABOUT 795 MI…1275 KM E OF THE LEEWARD ISLANDS
MAXIMUM SUSTAINED WINDS…75 MPH…120 KM/HR
PRESENT MOVEMENT…WNW OR 295 DEGREES AT 18 MPH…30 KM/HR
MINIMUM CENTRAL PRESSURE…990 MB…29.23 INCHES
WATCHES AND WARNINGS
——————–
THERE ARE NO COASTAL WATCHES OR WARNINGS IN EFFECT.
DISCUSSION AND 48-HOUR OUTLOOK
——————————
AT 1100 PM AST…0300 UTC…THE CENTER OF HURRICANE DANIELLE WAS
LOCATED NEAR LATITUDE 18.2 NORTH…LONGITUDE 49.8 WEST. DANIELLE IS
MOVING TOWARD THE WEST-NORTHWEST NEAR 18 MPH…30 KM/HR…BUT IS
EXPECTED TO SLOW DOWN AND TURN TOWARD THE NORTHWEST DURING THE NEXT
COUPLE OF DAYS.
MAXIMUM SUSTAINED WINDS HAVE INCREASED TO NEAR 75 MPH…120
KM/HR…WITH HIGHER GUSTS. DANIELLE IS A CATEGORY ONE HURRICANE ON
THE SAFFIR-SIMPSON HURRICANE WIND SCALE. LITTLE CHANGE IN STRENGTH
IS EXPECTED TOMORROW…WITH SOME STRENGTHENING POSSIBLE BY
THURSDAY.
HURRICANE FORCE WINDS EXTEND OUTWARD UP TO 30 MILES…45 KM…FROM
THE CENTER…AND TROPICAL STORM FORCE WINDS EXTEND OUTWARD UP TO 140
MILES…220 KM.
THE ESTIMATED MINIMUM CENTRAL PRESSURE IS 990 MB…29.23 INCHES.
HAZARDS AFFECTING LAND
———————-
NONE.
Dr. Ryan Maue formerly of FSU, and Dr. Robert Hart, Professor of Meteorology at FSU maintain websites with various model graphics that allow the average meteorologist see some of what the professionals at the National Hurricane Center use to issue their long-range forecasts for Danielle — and her soon-to-be friends in her wake…
Tropical Cyclone Maps — GFS, HWRF, GFDL, NOGAPS, ECMWF updated 4-times daily
GFS, HWRF, GFDL, ECMWF wind swath maps — 0 to 180 hour forecasts + model spaghetti and animations. — updated at least 4-times daily.
Maue also daily updates the climatological ACE and year-to-date for the global basins on his Tropical Page at FSU. While the Atlantic is heating up, with the GFS forecasting 3-hurricanes at once in the next 6-days to be happily spinning in the Central Atlantic, the seasonal ACE is struggling to keep up with climo (previous 30-year average). The Western Pacific is at storm #6 (Mindulle) while Danielle is technically AL06 … and the ACE’s are roughly identical. The climo ACE in the Western Pacific is 300% that of the North Atlantic — and 2010 is so-far shaping up to be a somewhat typical La Nina summer/fall.
“”” Sleepalot says:
August 24, 2010 at 8:27 pm
Isn’t the Earth supposed to have 30% cloud cover? That doesn’t look like
30% to me. “””
No, I believe it is supposed to be about 60%; and that photo doen’t look like 60% either.
But when you see how white and reflective it is on top; and imagine how dark and black it is underneath; you can appreciate how those clouds trap the heat, and make the water underneath warm up to supply the energy that is needed to make a hurricane work.
The famous “Earthrise” picture from the moon, gives a better idea of what the “Blue planet” more typically looks like.
Of course AlGore in his famous Nobel Prize winning book has some rare photos of planet earth duing those fleeting moments when there isn’t a single cloud anywhere on earth. Well if I took pictures like that, I too would expect to win the Nobel Prize for it..
But back at the picture in hand; I can’t tell which of those blobs is supposed to be the Hurricane/storm/whatever.
coaldust says:
August 25, 2010 at 6:14 am
Yes, under CDO – “Central dense overcast”, pretty much so (at least eye
not visible), no.
The eye is clear because air from the top of the storm sinks into the eye. The air loses moisture during convection, so as it comes down, warming evaporates any remaining clouds. The process takes some time, and the eyewall isn’t quite as
firm as it will be soon.
George E. Smith says:
August 25, 2010 at 4:21 pm
If you visit http://www.goes.noaa.gov/browsh.html (IR photo of Caribbean, plus), Danielle stand out well. The water vapor image at http://www.goes.noaa.gov/browsh3.html shows a heap of dry air in the way, I’d expect the NHC discussions would talk about it.
If you visit http://www.nhc.noaa.gov/satellite.shtml , the “Floater” images are of active storms and can be helpful.