By Steven Goddard,
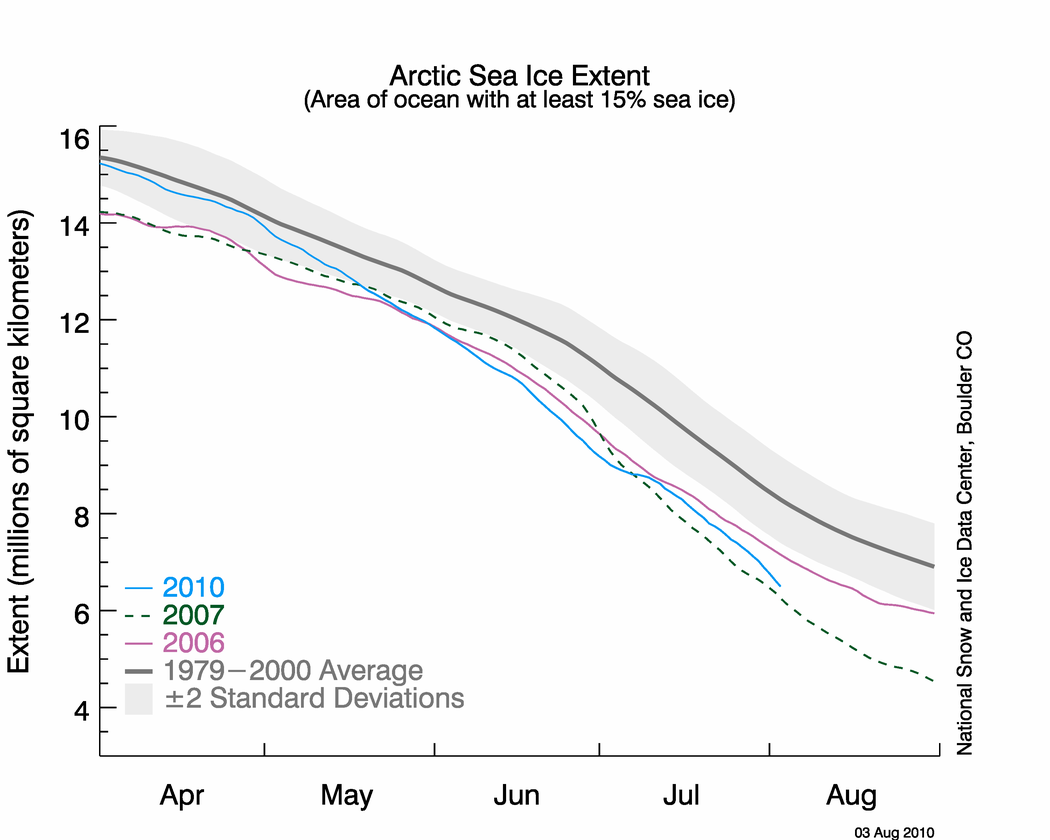
NSIDC published their sea ice news yesterday, and this one is definitely worth a read. Yesterday I pointed out that the graph below seems to be inconsistent with other data, including NSIDC maps.

http://nsidc.org/images/arcticseaicenews/20100804_Figure2.png
The problem is that the 2010 curve appears too close to 2007. Other data sources have the spread much larger, and NSIDC’s own maps show a larger spread. The area of green below represents regions of ice present in 2010, but not present in 2007. As of today, NSIDC maps show 10% more ice in 2010 than the same date in 2007.

Walt Meier from NSIDC responded with this remark :
4. Our sea ice maps are not an equal area projection. Thus one cannot compare extents by counting grid cells – this is probably the reason for the 7.5% vs. 3% discrepancy. Steve has been alerted to this issue in the past, but seems to have forgotten it.
What Dr. Meier seems to have forgotten is that pixels further from the pole in a polar map projection represent larger areas. Thus a correction would slightly increase the discrepancy, not decrease it. Sadly, DMI stopped updating their graphs two days ago – so I am no longer able top do comparisons between DMI 30% concentration and NSIDC 15% concentration. Their most recent graph shows 2010 well above 2007, and close to 2006.

Another data source – JAXA. The gap between 2010 and 2007 has been decreasing in NSIDC 15% concentration data, but has been increasing in JAXA 15% concentration data.


———————————————————————————————————————-
The next item which caught my attention is the discussion of multi-year ice.
Older, thicker ice melting in the southern Beaufort Sea
This past winter’s negative phase of the Arctic Oscillation transported old ice (four, five, and more years old) from an area north of the Canadian Archipelago. The ice was flushed southwards and westward into the Beaufort and Chukchi seas, as noted in our April post. Ice age data show that back in the 1970s and 1980s, old ice drifting into the Beaufort Sea would generally survive the summer melt season. However, the old, thick ice that moved into this region is now beginning to melt out, which could further deplete the Arctic’s remaining store of old, thick ice. The loss of thick ice has been implicated as a major cause of the very low September sea ice minima observed in recent years.
The blink comparator below shows the changes in multi-year ice between the end of March and the end of July.

The multi-year ice has largely survived the summer so far. Pixel counts show that ice greater than two years old has dropped by 11%, and ice between one and two years old has dropped by 4%. (These numbers are slightly low because of the distortion described above.) Most of the ice lost has probably been transported out the Fram Straight near Greenland, rather than melted in situ. The ice in the Beaufort Sea has split and moved north and west.
What about the future? The remaining multi-year ice in the Beaufort Sea is largely contained in areas which have dropped below freezing, and are forecast to remain below freezing for the next two weeks. The image below blinks between multi-year ice and current temperatures. Blue indicates below freezing temperatures.

The NCEP forecast below shows freezing temperatures over the ice for most of the remainder of the Arctic summer.

http://wxmaps.org/pix/temp2.html
It appears that the vast majority of the multi-year ice will survive this summer – just as it did in the 1970s and 1980s. The language in the NSIDC article seems to indicate that something fundamental has changed. I don’t see much evidence of that. In fact, given the large amount of 1-2 year old ice, we should see an increase in the amount of MYI next year.
Ice age data show that back in the 1970s and 1980s, old ice drifting into the Beaufort Sea would generally survive the summer melt season. However, the old, thick ice that moved into this region is now beginning to melt out, which could further deplete the Arctic’s remaining store of old, thick ice. The loss of thick ice has been implicated as a major cause of the very low September sea ice minima observed in recent years.
And no mention of the record high ice extent in Antarctica.

http://nsidc.org/data/seaice_index/images/s_plot_hires.png
I have alerted Dr. Meier to most of these issues by E-mail.
stevengoddard says:
August 5, 2010 at 10:37 pm
“Anu,
As usual, you forgot to use my complete quote : “Please propose a physical mechanism whereby the water heats underneath compact ice.”
When the ice is very compact (as it is this summer) it is difficult for the water below it to warm – because no sunlight reaches the water. “
This factoid is one of the reasons that it is so difficult to predict the final outcome of sea ice extent at the end of the melt season. A period of strong winds tends to facilitate the fracturing of the edges of the sheet, while clouds tend to prevent the sea warming. There are too many non-linear processes at work to enable accurate prediction even just a few weeks before the next re-freeze.
Chris V – Good find!
Steve –
Lower as in closer to the equator? I don’t think there’s much ice lower than 70N.
Here’s some other values for you:
Latitude Scale Factor
90N = 1
85N = 1.00
80N = 1.01
75N = 1.02
70N = 1.03
65N = 1.05
60N = 1.07
etc
So if the ice was indeed at lower latitude, you’d be overestimating NSIDC’s ice extents even more with your pixel counts. The way I make it, most of the ice lost is between 70-80N. So you’re still looking at your pixel counts overestimating NSIDC’s extents by between 2-7%.
Steve –
So if you were pointed out to be wrong yesterday, why are you still continuing to make posts claiming NSIDC is wrong.
Matt,
Given that the 2007 ice was centered around the pole, the excess ice in 2010 has to be at lower latitudes. You can see this clearly in the imagery.
http://climateinsiders.files.wordpress.com/2010/08/nsidcaugust032010vs2007.png?w=510&h=344&h=344
If I did apply the correction which you think is so important, it would increase the gap between 2010 and 2007, not decrease it.
Matt
You are going to believe what you want to believe.
I can see that logic is not relevant. Please don’t start a discussion about mathematics if you don’t intend to complete it.
Steve, NSIDC never really did answer the question did they?
Several posters on this thread have mentioned heat from below, which is mostly radioactive decay. Please allow me to add numbers to this assertion. The planetary thermal gradient is about 25C per kilometer depth in the crust. But the quantity of heat (not temperature) is low. Heat from the bottom of the sea is roughly 0.1 W/m2, which is about 1/10,000 the amount of heat from solar insolation.
Heat from below is tiny, even at the poles where solar insolation is small.
MattN
Walt Meier is travelling, and tells me that they are looking at it. I am sure that they want to get to the bottom of this as much as anyone.
stevengoddard says:
“The excess ice in 2010 is (of course) at lower latitudes. So any correction would increase the weighting of those pixels and therefore increase the difference between 2010 and 2007.”
No- you’ve got it backwards.
Say 1 pixel = 1 km2 at the pole.
With the scale factor (squared, because you’re calculating areas), at 70 degrees, 1.07 pixels = 1 km2. So 1 pixel = .93 km2.
So by assuming all pixels cover the same area (1 km2 in this example), you are OVERESTIMATING ice extent away from the poles, with the amount of overestimation increasing the further away from the poles you get.
Chris V
There is no longitudinal adjustment, because longitudes are not distorted – only latitudes. So nix your squared idea.
Pixels at 75N represent 3% more area than pixels at 90N, so each pixel at 75N gets multiplied by 1.03. This increases the area of ice in 2010 relative to 2007, because there is more ice in 2010 at lower latitudes.
Hope this helps.
Dan in California
Actually, no place on earth receives more summer solar insolation than the poles.
http://earthobservatory.nasa.gov/Features/EnergyBalance/page3.php
Steve, did you forget that you can actually download the area-per-pixel file from NSIDCʻs website and do your own ice extent calculations from the actual sea ice concentration data? Why not do that instead of pixel counting which everyone knows is inaccurate because the data are on a polar stereographic grid?
As previously alluded to by Gilbert K. Arnold, given that the purpose of the NSIDC map is to show ice area, it seems misguided to use a projection that preserves angles rather than area. Why not use a Lambert azimuthal equal area projection?
This posting appears to be another attempt to pretend that the ice is not shrinking in summer. The ice in 2010 did not recover as Steve has predicted all year, and in fact it has continued the amount of ice loss seen the last few years. I do not understand all this effort to try to hide the decline. No one is saying the ice decline is from CO2, but it is happening so it would be so much more informative to focus on the factors of the decline rather than pretending itʻs not happening. These sea ice posts are continually disappointing.
I seriously doubt NSIDC has suddenly changed the way they compute ice extent from the ice concentration data. They are a transparent institution who makes their data and their processing codes available. Steve should have downloaded the data and made his own calculations of ice extent if he was concerned processing recently changed. Counting pixels in a non-equal area grid is just plain wrong.
Steven:
Thanks for the correction. I verified the radioactive decay numbers, but just made an assumption about polar insolation. Heat from below is still tiny.
Dan
As the total Arctic and Antarctic sea ice extent seems to have remained relatively constant for the last 30 years, I wonder if a term describing the interaction between the two regions like “Trans-Arctic Oscillation” might one day enter the lexicon of Meteorology?
“Walt Meier is travelling, and tells me that they are looking at it. I am sure that they want to get to the bottom of this as much as anyone.”
Thanks for the update….
JJB
No method is perfect, but counting pixels is more than adequate for this exercise.
JJB,
Please explain why the NSIDC summer 2010 trend is so different from the JAXA and DMI trends.
The pixel counting discussion is simply a diversion to avoid dealing with the problem at hand.
JJB
I am not sure where you are getting your information from, but my summer 2010 prediction is right on track.
In fact, odds are my prediction will turn out to be too conservative.
Steven –
The reference given above by Chris V (August 6, 2010 at 11:03 am), Map Projections – A Working Manual is unambiguous. Figure 31 (found on PDF page 164, which is p.155 of the document) shows an illustration of the polar stereographic projection method. It can be clearly seen that a region near the equator projects into more pixels than an equal area near the pole. Or in other words, the area represented by a pixel decreases with increasing distance from the pole, that is, with decreasing latitude.
PDF page 172 (document p.163) has a table of the variation of scale factor with latitude, or it can be computed with excellent approximation using a spherical-earth assumption, as varying according to 2/(1 + sin(latitude)), cf. equation 21-7 in the reference.
I’m sorry that this discussion of projection is distracting from the main point of this post, which is the variation between the different estimates/metrics of sea ice extent. But the claim that the NSIDC is in error based on unweighted pixel count doesn’t hold up.
stevengoddard-
No, there is distortion along both latitude and longitude. There has to be- the stereographic projection is CONFORMAL. It preserves angles; the only way to do that is to have distortion in both directions.
And you don’t understand the concept of map scale.
On a stereographic projection, scale INCREASES away from the center of the map (in this case, the pole).
That means that means that the size of a 100 km2 land mass gets BIGGER ON THE MAP as you go from the pole (90 degrees) to 70.
Since it’s bigger ON THE MAP, it covers more pixels.
But the size on the earth of that 100km2 land mass hasn’t changed- it’s still 100km2.
So more pixels cover the same EARTH AREA at 70, compared to the same earth area at the pole.
That means that each individual pixel at 70 covers a SMALLER area ON THE EARTH, so you have to DIVIDE, not multiply, by the scale factor(squared-because we’re talking area) to correct for the distortion.
Here are a couple of good links that have info on map projections and scale:
http://egsc.usgs.gov/isb/pubs/MapProjections/projections.html#stereographic
https://www.e-education.psu.edu/natureofgeoinfo/
HaroldW
We don’t know what projection they are using and it doesn’t make any difference – the error is in the noise regardless of their choice of projection. If they are using a stereographic projection, that makes pixel counting more accurate, not less.
I never made any statements about how NSIDC does their weighting. This argument is a straw man discussion started by someone else. The fact is that NSIDC graphs are inconsistent with JAXA, DMI and their own maps.
HaroldW
Also, your interpretation of that document is incorrect. A projection that is intended to be accurate at 70 degrees is also going to be fairly accurate at 75 degrees. The equator is in the opposite direction.
The ice is at higher latitudes than 70 degrees, not lower latitudes. Comparisons of distortion at the equator are meaningless to this problem.