By Steven Goddard,
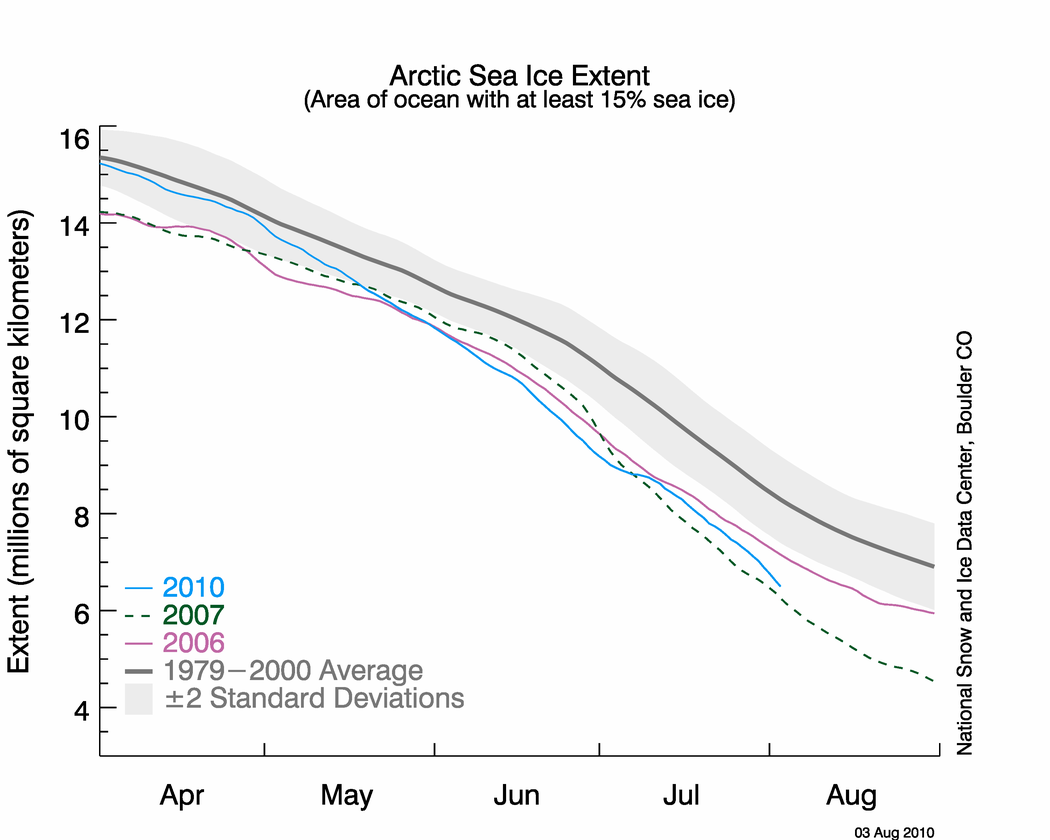
NSIDC published their sea ice news yesterday, and this one is definitely worth a read. Yesterday I pointed out that the graph below seems to be inconsistent with other data, including NSIDC maps.

http://nsidc.org/images/arcticseaicenews/20100804_Figure2.png
The problem is that the 2010 curve appears too close to 2007. Other data sources have the spread much larger, and NSIDC’s own maps show a larger spread. The area of green below represents regions of ice present in 2010, but not present in 2007. As of today, NSIDC maps show 10% more ice in 2010 than the same date in 2007.

Walt Meier from NSIDC responded with this remark :
4. Our sea ice maps are not an equal area projection. Thus one cannot compare extents by counting grid cells – this is probably the reason for the 7.5% vs. 3% discrepancy. Steve has been alerted to this issue in the past, but seems to have forgotten it.
What Dr. Meier seems to have forgotten is that pixels further from the pole in a polar map projection represent larger areas. Thus a correction would slightly increase the discrepancy, not decrease it. Sadly, DMI stopped updating their graphs two days ago – so I am no longer able top do comparisons between DMI 30% concentration and NSIDC 15% concentration. Their most recent graph shows 2010 well above 2007, and close to 2006.

Another data source – JAXA. The gap between 2010 and 2007 has been decreasing in NSIDC 15% concentration data, but has been increasing in JAXA 15% concentration data.


———————————————————————————————————————-
The next item which caught my attention is the discussion of multi-year ice.
Older, thicker ice melting in the southern Beaufort Sea
This past winter’s negative phase of the Arctic Oscillation transported old ice (four, five, and more years old) from an area north of the Canadian Archipelago. The ice was flushed southwards and westward into the Beaufort and Chukchi seas, as noted in our April post. Ice age data show that back in the 1970s and 1980s, old ice drifting into the Beaufort Sea would generally survive the summer melt season. However, the old, thick ice that moved into this region is now beginning to melt out, which could further deplete the Arctic’s remaining store of old, thick ice. The loss of thick ice has been implicated as a major cause of the very low September sea ice minima observed in recent years.
The blink comparator below shows the changes in multi-year ice between the end of March and the end of July.

The multi-year ice has largely survived the summer so far. Pixel counts show that ice greater than two years old has dropped by 11%, and ice between one and two years old has dropped by 4%. (These numbers are slightly low because of the distortion described above.) Most of the ice lost has probably been transported out the Fram Straight near Greenland, rather than melted in situ. The ice in the Beaufort Sea has split and moved north and west.
What about the future? The remaining multi-year ice in the Beaufort Sea is largely contained in areas which have dropped below freezing, and are forecast to remain below freezing for the next two weeks. The image below blinks between multi-year ice and current temperatures. Blue indicates below freezing temperatures.

The NCEP forecast below shows freezing temperatures over the ice for most of the remainder of the Arctic summer.

http://wxmaps.org/pix/temp2.html
It appears that the vast majority of the multi-year ice will survive this summer – just as it did in the 1970s and 1980s. The language in the NSIDC article seems to indicate that something fundamental has changed. I don’t see much evidence of that. In fact, given the large amount of 1-2 year old ice, we should see an increase in the amount of MYI next year.
Ice age data show that back in the 1970s and 1980s, old ice drifting into the Beaufort Sea would generally survive the summer melt season. However, the old, thick ice that moved into this region is now beginning to melt out, which could further deplete the Arctic’s remaining store of old, thick ice. The loss of thick ice has been implicated as a major cause of the very low September sea ice minima observed in recent years.
And no mention of the record high ice extent in Antarctica.

http://nsidc.org/data/seaice_index/images/s_plot_hires.png
I have alerted Dr. Meier to most of these issues by E-mail.
Mooloo
What do you get if you divide 6% by 6%?
Ice in 2oo7 and 2010 is identical north of 80N.
R. Gates says:
August 7, 2010 at 2:33
I would suspect that you’d gladly get many a skeptic to take you up on making that conclusion…which means they know nothing about the long term trends or dynamics of sea ice.
Ya, I know, not right now, but 40 years from now…..look out, the global warming monster will come out from under the bed.
By the way R. Gates, should anyone listen to you since your prediction about Arctic ice this year is so bad? You insisted for weeks that there was going to be dramatic ice loss in August. But the data in the shows you are wrong. With that in mind, should we trust your long term predictions when your short term ones are so bad?
Amino Acids in Meteorites says:
August 7, 2010 at 4:51 pm
R. Gates says:
August 7, 2010 at 2:33
I would suspect that you’d gladly get many a skeptic to take you up on making that conclusion…which means they know nothing about the long term trends or dynamics of sea ice.
Ya, I know, not right now, but 40 years from now…..look out, the global warming monster will come out from under the bed.
By the way R. Gates, should anyone listen to you since your prediction about Arctic ice this year is so bad? You insisted for weeks that there was going to be dramatic ice loss in August. But the data in the shows you are wrong. With that in mind, should we trust your long term predictions when your short term ones are so bad?
_________
Amino,
I’ve said since March that the sea ice extent will end up lower than 2008 and 2009, but higher than 2007, which happens to be right where we’re at right now. My comment about a downturn in late July and early August was about the time that Steve was getting all excited by the slowdown in extent decline at the beginning of July. He was claiming that the extent would begin to parallel 2006, and I said not so fast, I think you’ll see if more closely parallel 2007 with a some big drops in late July and into August, which is exactly what we’ve seen. So how is my prediction of ending up lower than 2008 & 2009 but higher than 2007 a “bad prediction”. I guess being right on target so far is the definition of “bad” to you…
Oh well, to each his own.
I don’t see a long term trend of ice loss. I do see a trend of ice loss since 1979. But that is not a long term trend. It is a short term. To just use data from 1979 to 2010 to establish what is normal in Arctic ice is bad science. We cannot establish anything from such a short data set.
But some are doing bad science and are thinking they have established what is normal in Arctic ice from that small data set.
stevengoddard says:
August 7, 2010 at 3:30 pm
R. Gates
Cryosat won’t tell you anything about historical ice thickness. There will be no frame of reference to compare against, but I am sure that won’t stop people from making things up.
_____
You are correct, CryoSat 2 will begin a new area of accurate sea ice volume measurements, and so we’ll need to be aware that anything before this period is extrapolated and prone to higher error rates. Never the less, when we get around to 2015 (by which date I’m forecasting we’ll see a 2.5 million sq. km Arctic sea ice minimum), we’ll also have several years of volume data that we can also use as a guage. So slowly, but surely, the “travesty”of not having accurate data on important climate related areas gets whittled away at…
No, R Gates
you said there was going to be dramatic ice loss in August. But, as I thought would happen, you change what you said now. You revise, as always happens in ‘global warming’. People don’t have to look very far to find your predictions of dramatic ice loss in August.
R. Gates
What possible logic could there be behind your forecast of 2.5 million?
REPLY: Yes, I agree. Even NSIDC thinks there will be at least 4 million, probably 5 million. I had an email exchange with Walt Meier that confirms this. 2.5 million is just unsupportable. – Anthony
stevengoddard says:
August 7, 2010 at 6:45 pm
R. Gates
What possible logic could there be behind your forecast of 2.5 million?
REPLY: Yes, I agree. Even NSIDC thinks there will be at least 4 million, probably 5 million. I had an email exchange with Walt Meier that confirms this. 2.5 million is just unsupportable. – Anthony
________________
I highly respect Walt Meier, and appreciate your private exchange with him, but I stand by my forecast of a 2.5 million sq. km. minimum during some summer by the 2015 Sept. minimum. (I hope no one thought I was talking about this summer, as I’ve never made that forecast). I’m hardly an expert like Walt nor like Julienne, but I’ve got what I feel are very good reasons for my longer range forecast. I’ve stated for many months that I thought the long and deep solar minimum of 2008-2009 had the effect on Arctic Sea ice of merely slowing down and leveling the accelerated decline we saw in 2007, but hardly mounting any sort of recovery. I feel quite strongly that upcoming solar max in 2013, combined with a what I think will be a strong El Nino in 2012-2013, will combine the general global warming trend of the last few decades to push the sea ice down to this level. I also don’t see any let up in warmer Arctic SST’s, and I also see the positive feedback increasing Arctic Dipole events combining with the above mentioned solar and ENSO mentioned events combining to push the sea ice down to the 2.5 million sq. km. range, somewhere in the summer of 2012, 2013, 2014, or 2015. Exactly which year will be subject to the actual weather of those summers, but I have confidence it will happen.
Just as shocked as everyone was initially at the low extent in 2007, I think this new low will be equally shocking (at least for some), but will set the intial stage for an ice free summer Arctic by 2030, though it could linger in a virtually ice free zone (1 million sq. km. minimums) for a period of time in the 2020’s.
Amino Acids in Meteorites says:
August 7, 2010 at 6:12 pm
No, R Gates
you said there was going to be dramatic ice loss in August. But, as I thought would happen, you change what you said now. You revise, as always happens in ‘global warming’. People don’t have to look very far to find your predictions of dramatic ice loss in August.
_____
Shame on you Amino. My forecast has been consistent since March, and after the ice extent loss slowed in early July, and Steve was forecasting that the decline track 2006, I stated that I doubted that and at the end of July and into to August we would see the decline accelerate once more and more closely parallel 2007 but not 2006. This is pretty much what has happened, and currently the ice is below 2008-2009, but above 2007, and certainly no longer looking like 2006, which it only paralleled for a week or so, but had totally different dynamics during that time.
R. Gates
Arctic ice has been tracking a little below 2006, just as I said it would in May and have said several times a week since.
R. Gates
Is it the record cold Arctic temperatures this summer which are convincing you that the ice is doomed?
stevengoddard says:
August 7, 2010 at 9:45 pm
R. Gates
Arctic ice has been tracking a little below 2006, just as I said it would in May and have said several times a week since
_________
So you are still good with your 5.5 million sq. km. minimum extent though, right?
A lot of numbers here and a lot of science but in terms of predictions what I see is Steve at 5.5 and R. Gates at 4.5.
R. Gates: “And BTW, I’ve been rock solid at a 4.5 million sq. km. projection for minimum melt (based on IJIS/JAXA data) for many months (since March actually), and that’s well documented here on WUWT, so please don’t try to put any other words in my mouth or spin what I say.”
Amino Acids in Meteorites says:
August 7, 2010 at 6:09 pm
“I don’t see a long term trend of ice loss. I do see a trend of ice loss since 1979. But that is not a long term trend. It is a short term. To just use data from 1979 to 2010 to establish what is normal in Arctic ice is bad science. We cannot establish anything from such a short data set.”
***
Well some can, how about “Global cooling since 1998”
****
But some are doing bad science and are thinking they have established what is normal in Arctic ice from that small data set.
***
Bad science? Take it up with Dr WHO, borrow his time machine and launch satelites from say 1800? Further back? Your choice and may I suggest using the latest version Cryosat. Let me know when its done, can’t wait to see a few hundred years of arctic ice minimums and maximums. What a trend that will be.
http://wattsupwiththat.com/2010/06/14/wuwt-arctic-sea-ice-news-9/#comment-409584
R. Gates
Have I given any reason to believe that I have changed my forecast?
Mooloo says:
August 7, 2010 at 3:23 pm
“I’ve been arguing the distortion effect is low, but it certainly is not low for this reason.
Any percentage changes are measured as a percentage of the whole. If the count total for the whole is artificially low – which it is – then the percentage change will be wrong. Even if the area being counted is the part with no distortion.
Rather the effect is low because the portion most distorted – the pole at 6% – is also the area with the least volume.”
What you say is true, but slightly misses my point. The distortion effect could certainly introduce a (small) bias into the total. But the inconsistency Steve noted is a difference from one year to another, in both of which the relevant peripheral areas were in this low distortion zone; the central polar area was always filled. So the bias cannot have significantly changed between the two. The discrepancy must be real.
Steve,
I just did some calculations of my own using the binary sea ice data available on the NSIDC website, and from a simple pixel count, I get the same % difference between 03 August 2007 and 2010 as you’ve calculated from the NSIDC timeseries — 3%. Not sure where you’re getting your 7.5% from.
Here’s the numbers I got from a simple pixel count (pixels with concentration > 15%):
2007 = 9578 pixels
2010 = 9895 pixels
I can send the code if anyone wants to verify.
Conclusion: NSIDC plots are correct. There must be an error in Steve’s pixel count.