By Steven Goddard,
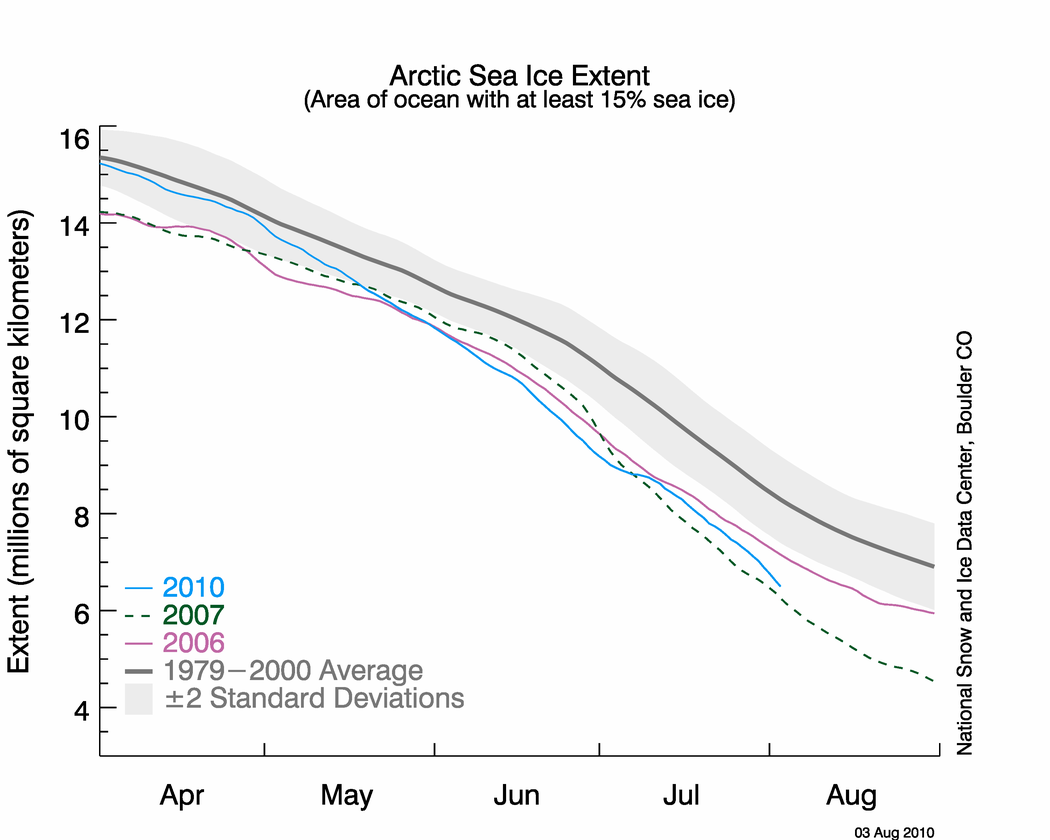
NSIDC published their sea ice news yesterday, and this one is definitely worth a read. Yesterday I pointed out that the graph below seems to be inconsistent with other data, including NSIDC maps.

http://nsidc.org/images/arcticseaicenews/20100804_Figure2.png
The problem is that the 2010 curve appears too close to 2007. Other data sources have the spread much larger, and NSIDC’s own maps show a larger spread. The area of green below represents regions of ice present in 2010, but not present in 2007. As of today, NSIDC maps show 10% more ice in 2010 than the same date in 2007.

Walt Meier from NSIDC responded with this remark :
4. Our sea ice maps are not an equal area projection. Thus one cannot compare extents by counting grid cells – this is probably the reason for the 7.5% vs. 3% discrepancy. Steve has been alerted to this issue in the past, but seems to have forgotten it.
What Dr. Meier seems to have forgotten is that pixels further from the pole in a polar map projection represent larger areas. Thus a correction would slightly increase the discrepancy, not decrease it. Sadly, DMI stopped updating their graphs two days ago – so I am no longer able top do comparisons between DMI 30% concentration and NSIDC 15% concentration. Their most recent graph shows 2010 well above 2007, and close to 2006.

Another data source – JAXA. The gap between 2010 and 2007 has been decreasing in NSIDC 15% concentration data, but has been increasing in JAXA 15% concentration data.


———————————————————————————————————————-
The next item which caught my attention is the discussion of multi-year ice.
Older, thicker ice melting in the southern Beaufort Sea
This past winter’s negative phase of the Arctic Oscillation transported old ice (four, five, and more years old) from an area north of the Canadian Archipelago. The ice was flushed southwards and westward into the Beaufort and Chukchi seas, as noted in our April post. Ice age data show that back in the 1970s and 1980s, old ice drifting into the Beaufort Sea would generally survive the summer melt season. However, the old, thick ice that moved into this region is now beginning to melt out, which could further deplete the Arctic’s remaining store of old, thick ice. The loss of thick ice has been implicated as a major cause of the very low September sea ice minima observed in recent years.
The blink comparator below shows the changes in multi-year ice between the end of March and the end of July.

The multi-year ice has largely survived the summer so far. Pixel counts show that ice greater than two years old has dropped by 11%, and ice between one and two years old has dropped by 4%. (These numbers are slightly low because of the distortion described above.) Most of the ice lost has probably been transported out the Fram Straight near Greenland, rather than melted in situ. The ice in the Beaufort Sea has split and moved north and west.
What about the future? The remaining multi-year ice in the Beaufort Sea is largely contained in areas which have dropped below freezing, and are forecast to remain below freezing for the next two weeks. The image below blinks between multi-year ice and current temperatures. Blue indicates below freezing temperatures.

The NCEP forecast below shows freezing temperatures over the ice for most of the remainder of the Arctic summer.

http://wxmaps.org/pix/temp2.html
It appears that the vast majority of the multi-year ice will survive this summer – just as it did in the 1970s and 1980s. The language in the NSIDC article seems to indicate that something fundamental has changed. I don’t see much evidence of that. In fact, given the large amount of 1-2 year old ice, we should see an increase in the amount of MYI next year.
Ice age data show that back in the 1970s and 1980s, old ice drifting into the Beaufort Sea would generally survive the summer melt season. However, the old, thick ice that moved into this region is now beginning to melt out, which could further deplete the Arctic’s remaining store of old, thick ice. The loss of thick ice has been implicated as a major cause of the very low September sea ice minima observed in recent years.
And no mention of the record high ice extent in Antarctica.

http://nsidc.org/data/seaice_index/images/s_plot_hires.png
I have alerted Dr. Meier to most of these issues by E-mail.
“In the noise.”
stevengoddard says:
“We don’t know what projection they are using and it doesn’t make any difference”
Yes, we do know- I posted a link earlier to the NSIDC website that shows what projection they use. Polar stereographic on the secant at 70 degrees.
And it does make a difference. There is a reason why there are many dozens of different map projections; you choose the projection to based on what you want to use the map for.
If you want to measure areas accurately over large areas of the earth, you need to use an equal area projection- that’s why they exist. The projection used by NSIDC is not equal area, so you can’t use it to accurately measure areas.
And since you’re talking about differences in ice extent of only a few percent, that accuracy is important.
I have no idea how the Aug 2010 ice extent compares to 2007 (and i really don’t care). But I do know that you can’t measure it accurately by counting pixels on a stereographic projection.
Chris V
There are quite a few different projections they could be using. You are talking about a different projection from what we were talking about earlier.
I’ll send the ball over to your court. Prove to us that the East Siberian Sea has almost no area, which is the necessary corollary of your argument. You are claiming that the green region is distorted. Do the math and report back.
[youtube=http://www.youtube.com/watch?v=kvatHj3T-hA]
Or you can start with the NSIDC maps if you prefer.
http://nsidc.org/data/seaice_index/images/daily_images/N_daily_extent.png
http://nsidc.org/data/seaice_index/images/daily_images/N_record_extent.png
Chris V,
You said “Polar stereographic on the secant at 70 degrees”
You do realize that that the ice is north of 70 degrees?
Suppose for a minute that the argument made by ChrisV is correct. Another corollary would be that the claimed NSIDC ice loss is exaggerated, because it is at lower latitudes. Note that the discrepancy between 2007 and 2010 (green) covers most of the area which NSIDC reports as missing from 2007.
You can’t claim that region is sometimes large and sometimes small, depending on what is convenient for the current argument.
[youtube=http://www.youtube.com/watch?v=kvatHj3T-hA]
Amino Acids in Meteorites says:
August 5, 2010 at 8:31 pm
“It is unfair to compare a year of data (2010) to a time period that began when Arctic ice was larger from the 1945 to 1976 cooling in the earth. To get a true picture of climate we should see what climate has done for 1000, or more. ”
Its been said ‘Climate is what you expect, weather is what you get.’ It doesn’t take 1000 years to define climate. But… if you object to using a single year (2010) as a comparator, stop using 2007 for min ice extent or 1998 for max global temperatures. And stop using the ice extent on a month-by-month basis to draw any inference at all.
Chris V-
Just let it be – Steve clearly doesn’t want to get to the bottom of this. You and I have both linked to the NSIDC site which clearly states which projection they’re using. Steve claimed to me that the ice was at lower latitudes, now he claims its at upper latitudes. He’s just playing games now, and any further facts won’t sway him – his head is firmly buried in the sand.
And no, Steve, that would not be a corollary. NSIDC ice loss is not exaggerated because they aren’t trying to calculate ice loss from a pixel count off a stereographic map. Stop making stuff up.
Matt,
The NSIDC graph shows 2010 almost the same as 2007. Look at the overlay of their maps below. Their graph is simply not credible.
[youtube=http://www.youtube.com/watch?v=kvatHj3T-hA]
Their graph does not agree with DMI or JAXA. How can you continue to ignore this blatantly obvious fact?
Chris V
The ice is at lower latitudes from the pole and higher latitudes than 70N. The discussion of projections has discussed two different types of projections.
If you feel the need to quote half sentences out of context, then your position isn’t very strong, is it?
Sorry, last message was directed at Matt – not Chris V.
I agree with those who say that for a stereographic projection pixels at the pole represent more area than pixels away from the pole; however, I agree with Steve Goddard that it’s probably insignificant. According to the very useful map projection document, the correction factor at 67 degrees is 1.04137. So that’s the maximum adjustment within the Arctic Circle. If the raw pixel count shows 10% more ice than 2007, the adjusted pixel count would be at least 10%/1.04137 = 9.6%. If the raw pixel count shows 7.5% more ice than 2007, the adjusted pixel count would be at least 7.5%/1.04137 = 7.2%.
stevengoddard says:
“There are quite a few different projections they could be using. You are talking about a different projection from what we were talking about earlier. ”
No- I (and Matt, and Harold…) have been talking about the same projection since the beginning the one NSDIC does use. What map projection were you talking about?
“You said “Polar stereographic on the secant at 70 degrees” You do realize that that the ice is north of 70 degrees?”
Yes I do- that doesn’t change how the scale varies across the map. It just means that distortion is smallest at 70. North of 70, areas are reduced, south of 70, expanded. But there is still 6% distortion between the the pole and 70 degrees, and about 2.2% distortion between 75 and 70 degrees.
Your calculated difference was what, 4.5%? The distortion across the map is greater than that.
“You are claiming that the green region is distorted.”
Not a claim- it’s a fact, based on the map projection. Heck- the entire map (like every map) is distorted.
When choosing a map projection, you (should) choose one that distorts the stuff you’re not interested in.
To minimize the distortion, NASA and NSIDC made this polar stereo projection true at 70 degrees rather than at the poles. While this increases the distortion at the poles by six percent, the latitude of 70 degrees was selected so that little or no distortion would occur in the marginal ice zone.
So the maximum distortion at the pole is 6% too small compared to 70°.
The ice we are counting is well within the 70° band, so it is also distorted onto the small side.
Integration quickly reveals that the error in pixel size is very small during high melt, because the area at maximum distortion is the small area round the pole, whereas the areas least distorted are much larger.
(We can see the scale effect by assuming bands of 5°, recalling that the bulk of each band is in the outer half and therefore at less distortion. The area between 90° and 85° will be on average some 5% too small, but is only 1/16th of the area inside 70°. The area between 85° and 80° will be some 3.5% too small, but is only 3/16th of the total area. The area from 80° to 75° will be some 2% too small, and is 5/16th of the area. The area from 75° to 70° is only 0.5% too small and is the 7/16th of the area. That is for over half the area inside 70° the distortion is less than 2%.)
Round up, because the pole isn’t a perfect circle, and some melt is in the region closer to the pole and as we get to 75° the distortion in the centre is proportionally more important. That still gives pixel counting at high melt will introduce an error in the region of 3% too high on the projection given.
It does not explain NDISC’s discrepancy.
Now the NSIDC maps show a leveling off in Sea Ice. I’m going to trust DMI from now on, instead of the NSIDC!
http://nsidc.org/data/seaice_index/images/daily_images/N_stddev_timeseries.png
So, if I understand this correctly, and tried to put it in simple terms… Can someone tell me if the following is correct?
“Polar stereographic on the secant at 70 degrees” means that:
1. everything at the 70 degrees is on a scale of 1-1
2. everything north of 70 degrees would be shrunk (each pixel represents more actual area) by some amount
3. everything south of 70 degrees would be enlarged (each pixel represents less actual area) by some amount
If I have that understood correctly, can someone show on these maps where 70 degrees is? That may help clear up all the confusion.
JJB says:
August 6, 2010 at 12:53 pm
“This posting appears to be another attempt to pretend that the ice is not shrinking in summer. The ice in 2010 did not recover as Steve has predicted all year, and in fact it has continued the amount of ice loss seen the last few years. I do not understand all this effort to try to hide the decline.”
LOL. I think your calling things a little early there.
If we match the ice loss of 2006 for the remainder of the season, this years minimum ice extent will beat 2009 by a good margin. The average melt for the remainder of the season based on JAXA data has been as low as 25,000 sq km per day in some years and as high as 50,000 sq km in others. The years that have higher melt rates late in the season do so because they lost their first year ice later so the higher loss rate is seen late in the season.
This year the first year ice was lost very early early. I dont consider conditions particularly favour rapid loss of multi-year ice this year. I’d be expecting a repeat of 2003 or 2006 ice loss rate for the remainder of the melt season bringing this years result above 2009.
Not bad for the “warmest” year on satellite record with an ice pack that lost a lot of multi-year ice in 2007. In fact, a little mystifying if you believe AGW is destroying the Arctic Ice Pack.
I believe I made a mistake in my previous comment. I thought the correction factors in the table were for area, but they are probably for distance, and must be squared to adjust distances. 1.04237^2 = 1.08445, so the correct results are, I believe, 10%/1.08445 = 9.22%; 7.5/1.08445 = 6.92%.
…squared to adjust areas…
Those who think the map is distorted at lower latitudes should write to NSIDC and tell them that their 2007 ice loss maps exagerated the magnitude of the loss.
Steve, NSIDC takes the sea ice concentration data on the polar stereographic grid and derives the ice extent using the “actual” area per pixel. I certainly wouldn’t publish any numbers assuming a constant 25 sq-km per pixel.
The idea that NSIDC is suddenly manipulating the data to show a steeper decline in the 2010 extent is wrong. If you do the extent calculations accurately (i.e. using the actual area per pixel for each pixel which you can get from NSIDC’s ftp site, together with the sea ice concentration data) you will get the values that we record. Any differences in extent between institutions is a result of using different data sources, different algorithms, different thresholds for ice, different weather filters, etc.
For those interested, you can see the grid projection here:http://nsidc.org/data/polar_stereo/ps_grids.html
Note: To minimize the distortion, NASA and NSIDC made this polar stereo projection true at 70 degrees rather than at the poles. While this increases the distortion at the poles by six percent, the latitude of 70 degrees was selected so that little or no distortion would occur in the marginal ice zone.
And SnowLover, the extent is leveling off again because of ice divergence under the central Arctic low pressure. That in no way implies that earlier ice loss was incorrect.
Steve Goddard says:
“Those who think the map is distorted at lower latitudes should write to NSIDC and tell them that their 2007 ice loss maps exagerated the magnitude of the loss.”
The map they use isn’t designed to be used for calculating ice areas directly.
When NSIDC calculates ice areas, they calculate each pixels individual area, based on the map scale at that point:
“Each pixel’s area is calculated individually, and is obtained by multiplying the nominal pixel size (625 km²) by the square of the map scale at the center of the pixel. Pixel areas range from 382 to 664 square kilometers for the Northern Hemisphere and 443 to 664 square kilometers for the Southern Hemisphere, under the polar stereographic projection and grid used for the input data sets.”
From here: http://nsidc.org/data/docs/noaa/g02135_seaice_index/index.html#doc_info
NSIDC does it the correct way.
Julienne said:
“And SnowLover, the extent is leveling off again because of ice divergence under the central Arctic low pressure. That in no way implies that earlier ice loss was incorrect.”
_______
Julienne,
Question: This divergence I take it pushes the ice a bit outward? Is it in a sense the opposite of compaction? If so, it seems so long as the surrounding water stays warmer than normal, I would posit that we might see the net effect being a bit more net ice melting before the September minimum as the divergence keeps more ice over warmer water for a longer period. Is this even a potential?
JJB says:
August 6, 2010 at 12:53 pm
This posting appears to be another attempt to pretend that the ice is not shrinking in summer.
Really? Wow, that’s wild, man!!
Marge says:
August 5, 2010 at 8:17 pm
Alternatively, when your mandate is to give nothing but an anti-warmist perspective
Amino Acids in Meteorites says:
August 5, 2010 at 8:36 pm “There are people in this comment thread who have been given this mandate?”
I find that at least as plausible as the implication that scientists at NSIDC are mandated to “give an alarmist perspective, right or wrong”.
“Or is there a better word than mandate, did you mean something other than mandate?”
Perhaps you should address that question to Mark.