By Steven Goddard,
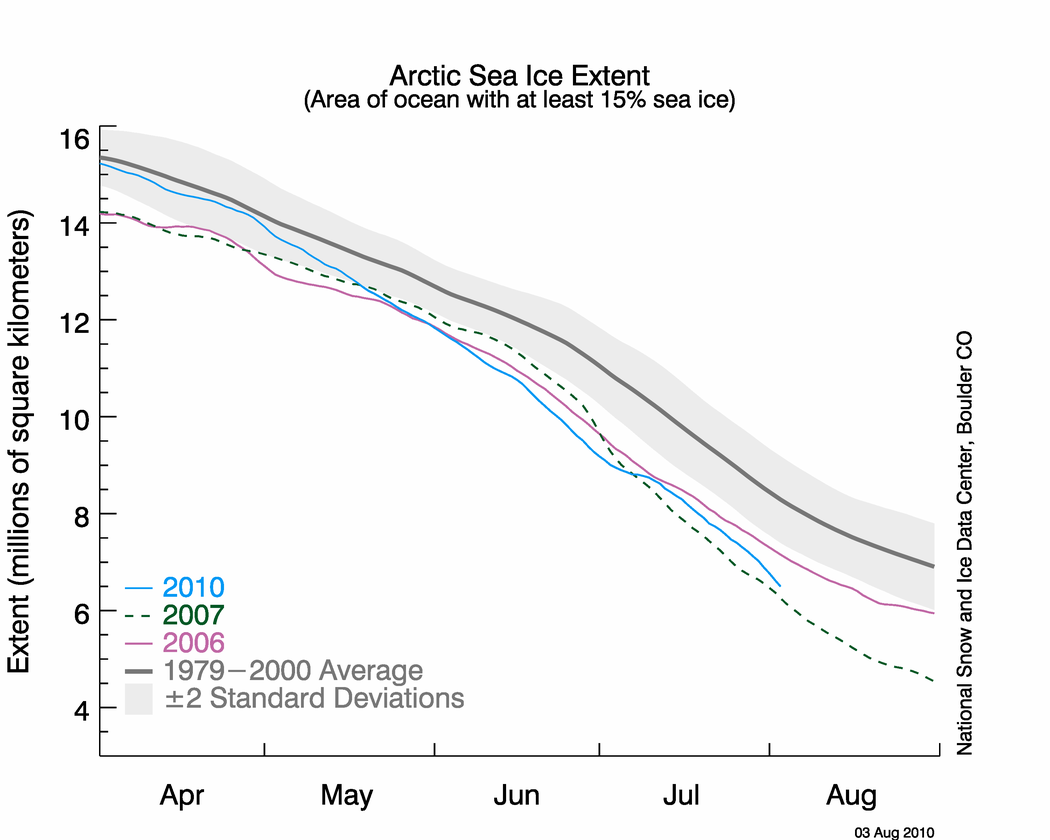
NSIDC published their sea ice news yesterday, and this one is definitely worth a read. Yesterday I pointed out that the graph below seems to be inconsistent with other data, including NSIDC maps.

http://nsidc.org/images/arcticseaicenews/20100804_Figure2.png
The problem is that the 2010 curve appears too close to 2007. Other data sources have the spread much larger, and NSIDC’s own maps show a larger spread. The area of green below represents regions of ice present in 2010, but not present in 2007. As of today, NSIDC maps show 10% more ice in 2010 than the same date in 2007.

Walt Meier from NSIDC responded with this remark :
4. Our sea ice maps are not an equal area projection. Thus one cannot compare extents by counting grid cells – this is probably the reason for the 7.5% vs. 3% discrepancy. Steve has been alerted to this issue in the past, but seems to have forgotten it.
What Dr. Meier seems to have forgotten is that pixels further from the pole in a polar map projection represent larger areas. Thus a correction would slightly increase the discrepancy, not decrease it. Sadly, DMI stopped updating their graphs two days ago – so I am no longer able top do comparisons between DMI 30% concentration and NSIDC 15% concentration. Their most recent graph shows 2010 well above 2007, and close to 2006.

Another data source – JAXA. The gap between 2010 and 2007 has been decreasing in NSIDC 15% concentration data, but has been increasing in JAXA 15% concentration data.


———————————————————————————————————————-
The next item which caught my attention is the discussion of multi-year ice.
Older, thicker ice melting in the southern Beaufort Sea
This past winter’s negative phase of the Arctic Oscillation transported old ice (four, five, and more years old) from an area north of the Canadian Archipelago. The ice was flushed southwards and westward into the Beaufort and Chukchi seas, as noted in our April post. Ice age data show that back in the 1970s and 1980s, old ice drifting into the Beaufort Sea would generally survive the summer melt season. However, the old, thick ice that moved into this region is now beginning to melt out, which could further deplete the Arctic’s remaining store of old, thick ice. The loss of thick ice has been implicated as a major cause of the very low September sea ice minima observed in recent years.
The blink comparator below shows the changes in multi-year ice between the end of March and the end of July.

The multi-year ice has largely survived the summer so far. Pixel counts show that ice greater than two years old has dropped by 11%, and ice between one and two years old has dropped by 4%. (These numbers are slightly low because of the distortion described above.) Most of the ice lost has probably been transported out the Fram Straight near Greenland, rather than melted in situ. The ice in the Beaufort Sea has split and moved north and west.
What about the future? The remaining multi-year ice in the Beaufort Sea is largely contained in areas which have dropped below freezing, and are forecast to remain below freezing for the next two weeks. The image below blinks between multi-year ice and current temperatures. Blue indicates below freezing temperatures.

The NCEP forecast below shows freezing temperatures over the ice for most of the remainder of the Arctic summer.

http://wxmaps.org/pix/temp2.html
It appears that the vast majority of the multi-year ice will survive this summer – just as it did in the 1970s and 1980s. The language in the NSIDC article seems to indicate that something fundamental has changed. I don’t see much evidence of that. In fact, given the large amount of 1-2 year old ice, we should see an increase in the amount of MYI next year.
Ice age data show that back in the 1970s and 1980s, old ice drifting into the Beaufort Sea would generally survive the summer melt season. However, the old, thick ice that moved into this region is now beginning to melt out, which could further deplete the Arctic’s remaining store of old, thick ice. The loss of thick ice has been implicated as a major cause of the very low September sea ice minima observed in recent years.
And no mention of the record high ice extent in Antarctica.

http://nsidc.org/data/seaice_index/images/s_plot_hires.png
I have alerted Dr. Meier to most of these issues by E-mail.
latitude says:
August 5, 2010 at 6:37 pm
At least they can’t claim the NWP opened up.
Someone will. After an icebreaker goes through they’ll start talking about how boats can make it through in 2010.
Mark says:
August 5, 2010 at 6:51 pm
When your mandate is to give nothing but an alarmist perspective, you give nothing but an alarmist perspective, right or wrong!
I’ve seen government employees do such when the government does that mandating.
Tim L says:
August 5, 2010 at 7:30 pm
stevengoddard says:
August 5, 2010 at 6:37 pm
Billy Liar
Please propose a physical mechanism whereby the water heats underneath compact ice
steve, ever been in a mine shaft under ground? is it warm or cold?
Why is it everyone assumes it is cold water on the bottom of the ocean?
Is the center of the earth frozen? or molten?
just saying ……
_______________________________________________________
Because cold water is more dense and it sinks. And also because it has been measured. http://www-argo.ucsd.edu/
“…What is Argo?
Argo is a global array of 3,000 free-drifting profiling floats that measures the temperature and salinity of the upper 2000 m of the ocean. This allows, for the first time, continuous monitoring of the temperature, salinity, and velocity of the upper ocean, with all data being relayed and made publicly available within hours after collection….”
However if you are talking the temperatures around the ring of fire or “plates” all bets are off.
http://oceanservice.noaa.gov/education/yos/multimedia/oceanexplorer.noaa.gov/oceanexplorer.noaa.gov/explorations/06fire/background/chemistry/media/eifuku_champagnebubbles.html
Page down for some really great photos:
http://www.barking-moonbat.com/index.php/weblog/more_bothersome_volcanoes/
muographer says:
August 5, 2010 at 7:49 pm
Why the splitting hairs over pixel size and the fixation with 2007 as a single point of reference? Take a look at the big picture: 2010 is well below the ’79-2000
That is far from the big picture.
It is unfair to compare a year of data (2010) to a time period that began when Arctic ice was larger from the 1945 to 1976 cooling in the earth. To get a true picture of climate we should see what climate has done for 1000, or more. It was much warmer on earth 1000 years ago than 1945-1976. So you should compare present data to that 1000 year time period, not to a cool time on earth that made Arctic ice larger than it has been over the last 10 years.
The reason total ice is smaller now is because there was a warming trend from 1977 to 1998 caused by a PDO (+). It’s very important in science to strive to be absolutely fair.
jcrabb says:
August 5, 2010 at 7:57 pm
It is interesting that NSIDC sea ice extent data was acceptable back in early July
Would you cite why you are able to say that?
muographer writes:
“Why the splitting hairs over pixel size and the fixation with 2007 as a single point of reference? Take a look at the big picture: 2010 is well below the ’79-2000 average. Its called ‘climate’, not ‘weather’ for a reason … the long period behavior (average over several years, trends) is the message.”
In a contest between fact and trend, fact wins every time.
Marge says:
August 5, 2010 at 8:17 pm
Alternatively, when your mandate is to give nothing but an anti-warmist perspective
There are people in this comment thread who have been given this mandate? Or is there a better word than mandate, did you mean something other than mandate?
Slight correction: “Fram Strait”, not “Fram Straight”.
IanM
Marge says:
August 5, 2010 at 8:17 pm
Alternatively, when your mandate is to give nothing but an anti-warmist perspective, you give nothing but an anti-warmist perspective, right or wrong.
The skeptic questions, the anti-warmist accuses.
Alternately, when your are nothing but a warmist harp seal, you give nothing but harps and always wrong!
Harp on warmists!
A better map than using an equal area map (polar projection) would be to use Bucky Fuller’s Dymaxion AirOcean Map (http://en.wikipedia.org/wiki/Dymaxion_map). This is the only map that I know of that has the least amount distortion for the shape of the landmasses If one of the panels is centered on the North Pole it is very easy to calculate the areal extent of the sea ice.
muographer says:
August 5, 2010 at 7:49 pm
Why the splitting hairs over pixel size and the fixation with 2007 as a single point of reference? Take a look at the big picture: 2010 is well below the ’79-2000 average. Its called ‘climate’, not ‘weather’ for a reason … the long period behavior (average over several years, trends) is the message.
_________________________________________________________
Fine then look at the WHOLE Holocene:
Greenland Ice Core graph – 10,000 years:
http://jonova.s3.amazonaws.com/graphs/lappi/gisp-last-10000-new.png
And then couple it with this:
Temperature and precipitation history of the Arctic
“..Solar energy reached a summer maximum (9% higher than at present) ca 11 ka ago and has been decreasing since then, primarily in response to the precession of the equinoxes. The extra energy elevated early Holocene summer temperatures throughout the Arctic 1-3° C above 20th century averages, enough to completely melt many small glaciers throughout the Arctic, although the Greenland Ice Sheet was only slightly smaller than at present… As summer solar energy decreased in the second half of the Holocene, glaciers reestablished or advanced, sea ice expanded, and the flow of warm Atlantic water into the Arctic Ocean diminished. Late Holocene cooling reached its nadir during the Little Ice Age (about 1250-1850 AD), when sun-blocking volcanic eruptions and perhaps other causes added to the orbital cooling, allowing most Arctic glaciers to reach their maximum Holocene extent…”
You might also want to read:
Lesson from the past: present insolation minimum holds potential for glacial inception (2007)
The 20th century the sun has been very active according to this paper and NASA But as we enter the new century according to the Solar Dynamics Observatory Mission News that no longer holds true.
If I were you I would be petitioning Congress to emit as much CO2 as possible!
Does anyone know where the rotten ice is that Dave Barber spoke about and was going to melt away in a hurry?
Amino Acids in Meteorites says:
August 5, 2010 at 8:21 pm
Mark says:
August 5, 2010 at 6:51 pm
When your mandate is to give nothing but an alarmist perspective, you give nothing but an alarmist perspective, right or wrong!
I’ve seen government employees do such when the government does that mandating.
_____________________________________________________
If you are a scientist and your employer – corporate or government – tells you to lie, you lie or you quit. Those or your only two options in the USA unless you are a certified Professional Engineer.
That is straight from the lawyer I consulted on a case of certificate falsification…. I quit.
CNN reports that Canadian and British marine archaeologists have discovered HMS Investigator in Mercy Bay, Aulavik National Park. Apparently this ship set sail in 1850 to find sister ships which sailed in 1845. Their position suggests they have navigated through most of the Northwest Passage. What is the implication for sea ice extent in 1850, if these ships reached so far west within the Northwest passage?
muographer says:
August 5, 2010 at 7:49 pm
Why the splitting hairs over pixel size and the fixation with 2007 as a single point of reference? Take a look at the big picture: 2010 is well below the ’79-2000 average. Its called ‘climate’, not ‘weather’ for a reason … the long period behavior (average over several years, trends) is the message.
Tell me how, even in a recovering arctic ice pack, you could have expected any of the years immediately following 2007 to get close to the 79′-2000 average. Thats simply an absurd proposition and that it hasnt does not prove that a long term downward trend leading to the 2007 loss has continued beyond that point.
Your entire argument is disingenuous. 2007 and the years leading up to it, for whatever reasons, changed the rules through extensive loss of multi-year ice. 2007 began with a lot more multi-year ice than 2008, 2009 and 2010 so the result for 2008 to 2010 must be seen in that context. What would the minimums have been in 2008 to 2010 if they had started wth the same amount of multi-year ice as 2006 did (or as 1979 even)?
Measuring 2008-2010 against the long term average loses some context in this case. Weather conditions that might have had very little impact on a “normal” arctic ice pack will see different results through the course of a melt season on an ice pack that has lost much of its multi-year ice.
For some time we will see only modest increases in the minimum extent due to the lack of multi-year ice and probably still some years that it falls. But I certainly haven’t seen anything in the past 3 years to indicate things are getting worse. Rather there are indications that the ice pack is gradually starting to recover.
BTW looking at current JAXA data, I’m still with Steven on a September minimum of close to 5.5 million sq km which would be 250,000 sq km above the 2009 result. Perhaps more if DMI temp data is right and the temps drop below zero in the Arctic basin within the next week (as they did in 2006).
stevengoddard says:
August 5, 2010 at 7:25 pm
Billy Liar
The Arctic Ocean is stratified. There is a thick layer of cold water underneath the ice, which does not mix with the warmer water below. If it did, there wouldn’t be any ice in the Arctic.
———–Reply:
So you’re saying the cold, dense, heavy water stays in the upper level, while the warm, expansive, lighter water stays in the lower levels? And both are moving subject to tides and earth’s rotation yet stay in equilibrium? Does not your model defy that common force called gravity? All it takes is one small vertical perterbation, and the two horizons start to trade places. After that, there’s no stopping them. Admittedly I have no data to support my idea yet logic can be a magnificient, overpowering force.
In terms of the stratification of temperatures in the Arctic, this is the cross-section across the whole Arctic produced by the US Navy (Aug 1, 2000).
The temperatures are around -2.0C for the first 100M or so. If the ice is only 2 or 3 metres thick, the temperature below this is really just above the melting point of salty ocean water so would be -1.9C for example. Remember the least dense form of ocean water is frozen sea ice, it will always float, and then the next least dense water will be the warmest layer of water available. After that, the colder the water, as long as it stays above the transitional freezing temperature, will be the most dense and will sink to the bottom (or more accurately the temperature profile will reflect the density).
So below 100M, the temperature then rises to reach a peak of about 0.6C or so and this goes down to about 1000M. Below that, it gets colder and the coldest water is roughly at the bottom at 4000M, and is about -0.8C (Antarctic waters are similar but they don’t get above 0.0C in the warm 100M to 1000M layer).
There is a seasonality trend as well where the whole profile gets just slightly colder in the winter months. This cold dense -0.8C water will seek out the lowest levels possible and thus will actually flow out of the Arctic (and Antarctica) wherever the geography of the ocean bottom allows it and will become the deepest water in the deep oceans. (This also means the deep ocean will not really warm up until there is no sea ice anymore).
http://a.imageshack.us/img62/7945/arcticdeepoceantemp.gif
Steve Goddard,
You want a physical mechanism to explain how warm water gets under ice? Ever hear of ocean currents? El Nino will cause arctic sea ice to melt. If ENSO is changing to La Nina soon, or has already, then I expect we will see much larger ice extent in 2011.
RockyRoad
The Arctic Ocean is stratified with layers of different densities due to the amount of dissolved salts. The more dense water stays near the bottom, and the less dense water stays near the top.
Gail Combs says:
“Because cold water is more dense and it sinks. …….”
Water is most dense at around 278K. As it cools towards the feezing point it becomes less dense and tends to rise. So in terms of artic water, cold water is less dense and its the warmer water that sinks.
Eric Flesch says:
August 5, 2010 at 6:50 pm
The phenomenon of limb foreshortening is well understood, being practiced daily by those who measure sunspot area.
eg: g 2010 08 04 14 27 32 11093 15 137 23 222 10.35 353.40
where sunspot 11093 was near the limb (foreshortened) and was measured in appearance as 15 Umbra and 137 whole spot.
Upon correction for foreshortening, the umbra was calculated at 23 and whole spot at 222 (if seen from directly above, which it was not).
Therefore, the same pixel that represents X area at the north pole is going to represent much greater area as the radius from the pole increases, while the image is centered above the pole.
A simple empirical experiment with a sphere and a marking pen will suffice to drive the point home.
I don’t think anyone is “lying.”
We all are subject to conformational bias though, aren’t we?
I have seen little discussion of the relationship between the Beaufort Gyre and the 2007 record Arctic sea ice minimum. It seems possible that the record ice loss was connected to a breakdown in the Beaufort Gyre – whether an anomaly or something that is a 30/40/50 year cycle remains little known. It takes approximately 4 years for ice normally to circulate completely in the Beaufort Gyre – and the map above of multiyear ice suggests that the Beaufort Gyre is well along in reestablishing multiyear ice on its circumference – and will complete the cycle in 2011. Once that occurs, it would seem probable that the enclosed area within the gyre will see a resurgence of multiyear ice, as well.
The area per pixel should be easy to resolve.
NSIDC, at http://nsidc.org/cgi-bin/get_metadata.pl?id=nsidc-0081 , describes the dataset as “gridded onto a polar stereographic grid…These data are stored as one-byte flat scaled binary arrays with one byte per pixel, at a resolution of 25 km.”
Per http://en.wikipedia.org/wiki/Stereographic_projection#Properties ,
“Stereographic projection is conformal, meaning that it preserves the angles at which curves cross each other (see figures). On the other hand, stereographic projection does not preserve area; in general, the area of a region of the sphere does not equal the area of its projection onto the plane. The area element is given in (X, Y) coordinates by
dA = 4 / ((1 + X^2 + Y^2)^2) * dX * dY.
Along the unit circle, where X^2 + Y^2 = 1, there is no infinitesimal distortion of area. Near (0, 0) areas are distorted by a factor of 4, and near infinity areas are distorted by arbitrarily small factors.”
It should be noted that “the unit circle” is the equator. Considering that pixels are spaced at 25 km, the distance from the pole to the equator, approx. 10000 km, should be 400 pixels. So the X and Y in the area equation above should be (horiz. distance in pixels)/400 & (vert. distance in pixels)/400.
If the above stereographic is correct, then Eric Fleisch is incorrect when he states that “pixels away from the North Pole represent smaller area than pixels at the North Pole.” From the dA equation above, area per pixel decreases as one departs from the map center (North Pole in this case).
To estimate the amount of area distortion, I’ll take a stab that the leftmost extent of the ice — that is, near Yukon/Alaska — is perhaps 100 pixels from the center, or at the coordinates (X= -1/4, Y=0). From the dA equation, the area per pixel there is about 89% of the polar value. Pixels closer to the pole will be in between the 89% and 100% limits. Referring back at the map at http://wattsupwiththat.com/2010/08/04/discrepancies-in-sea-ice-measurements/ , the green and red areas are at fairly similar distances from the pole, so at first glance I wouldn’t think that the difference between accounting for pixels with the accurate formula, vs. assigning equal areas per pixels, would be terribly significant. But it’s certainly within mathematical possibility that it can provide the difference between 103% and 107.5%. It seems a recount (with non-equal-area accounting) is called for.
Can someone — possibly Steve or Dr. Meier — confirm these calculations?
Steven Goddard:
“Billy Liar
Please propose a physical mechanism whereby the water heats underneath compact ice.”
Apparently you haven’t figured out that liquid ocean water is WARMER than ice. The NATURAL FLOW OF HEAT is from warmer to colder. That is, water HEATS ICE!!! The current continually brings water from outside the area against the edges of the ice and underneath, or, are you going to deny than ANY ice melts every year??
Come on man, get REAL!!