By Steve Goddard

JAXA shows the area immediately west of Barrow, Alaska as ice free. And it appears to be melting away from the shore.
The animation below shows the month of May so far.
This apparent melt surprised me, because the University of Alaska reports sea ice at Barrow 4-1/2 feet thick and topped by another foot of snow. The ice has thickened six inches during the past month and about 18 inches since the start of the year.


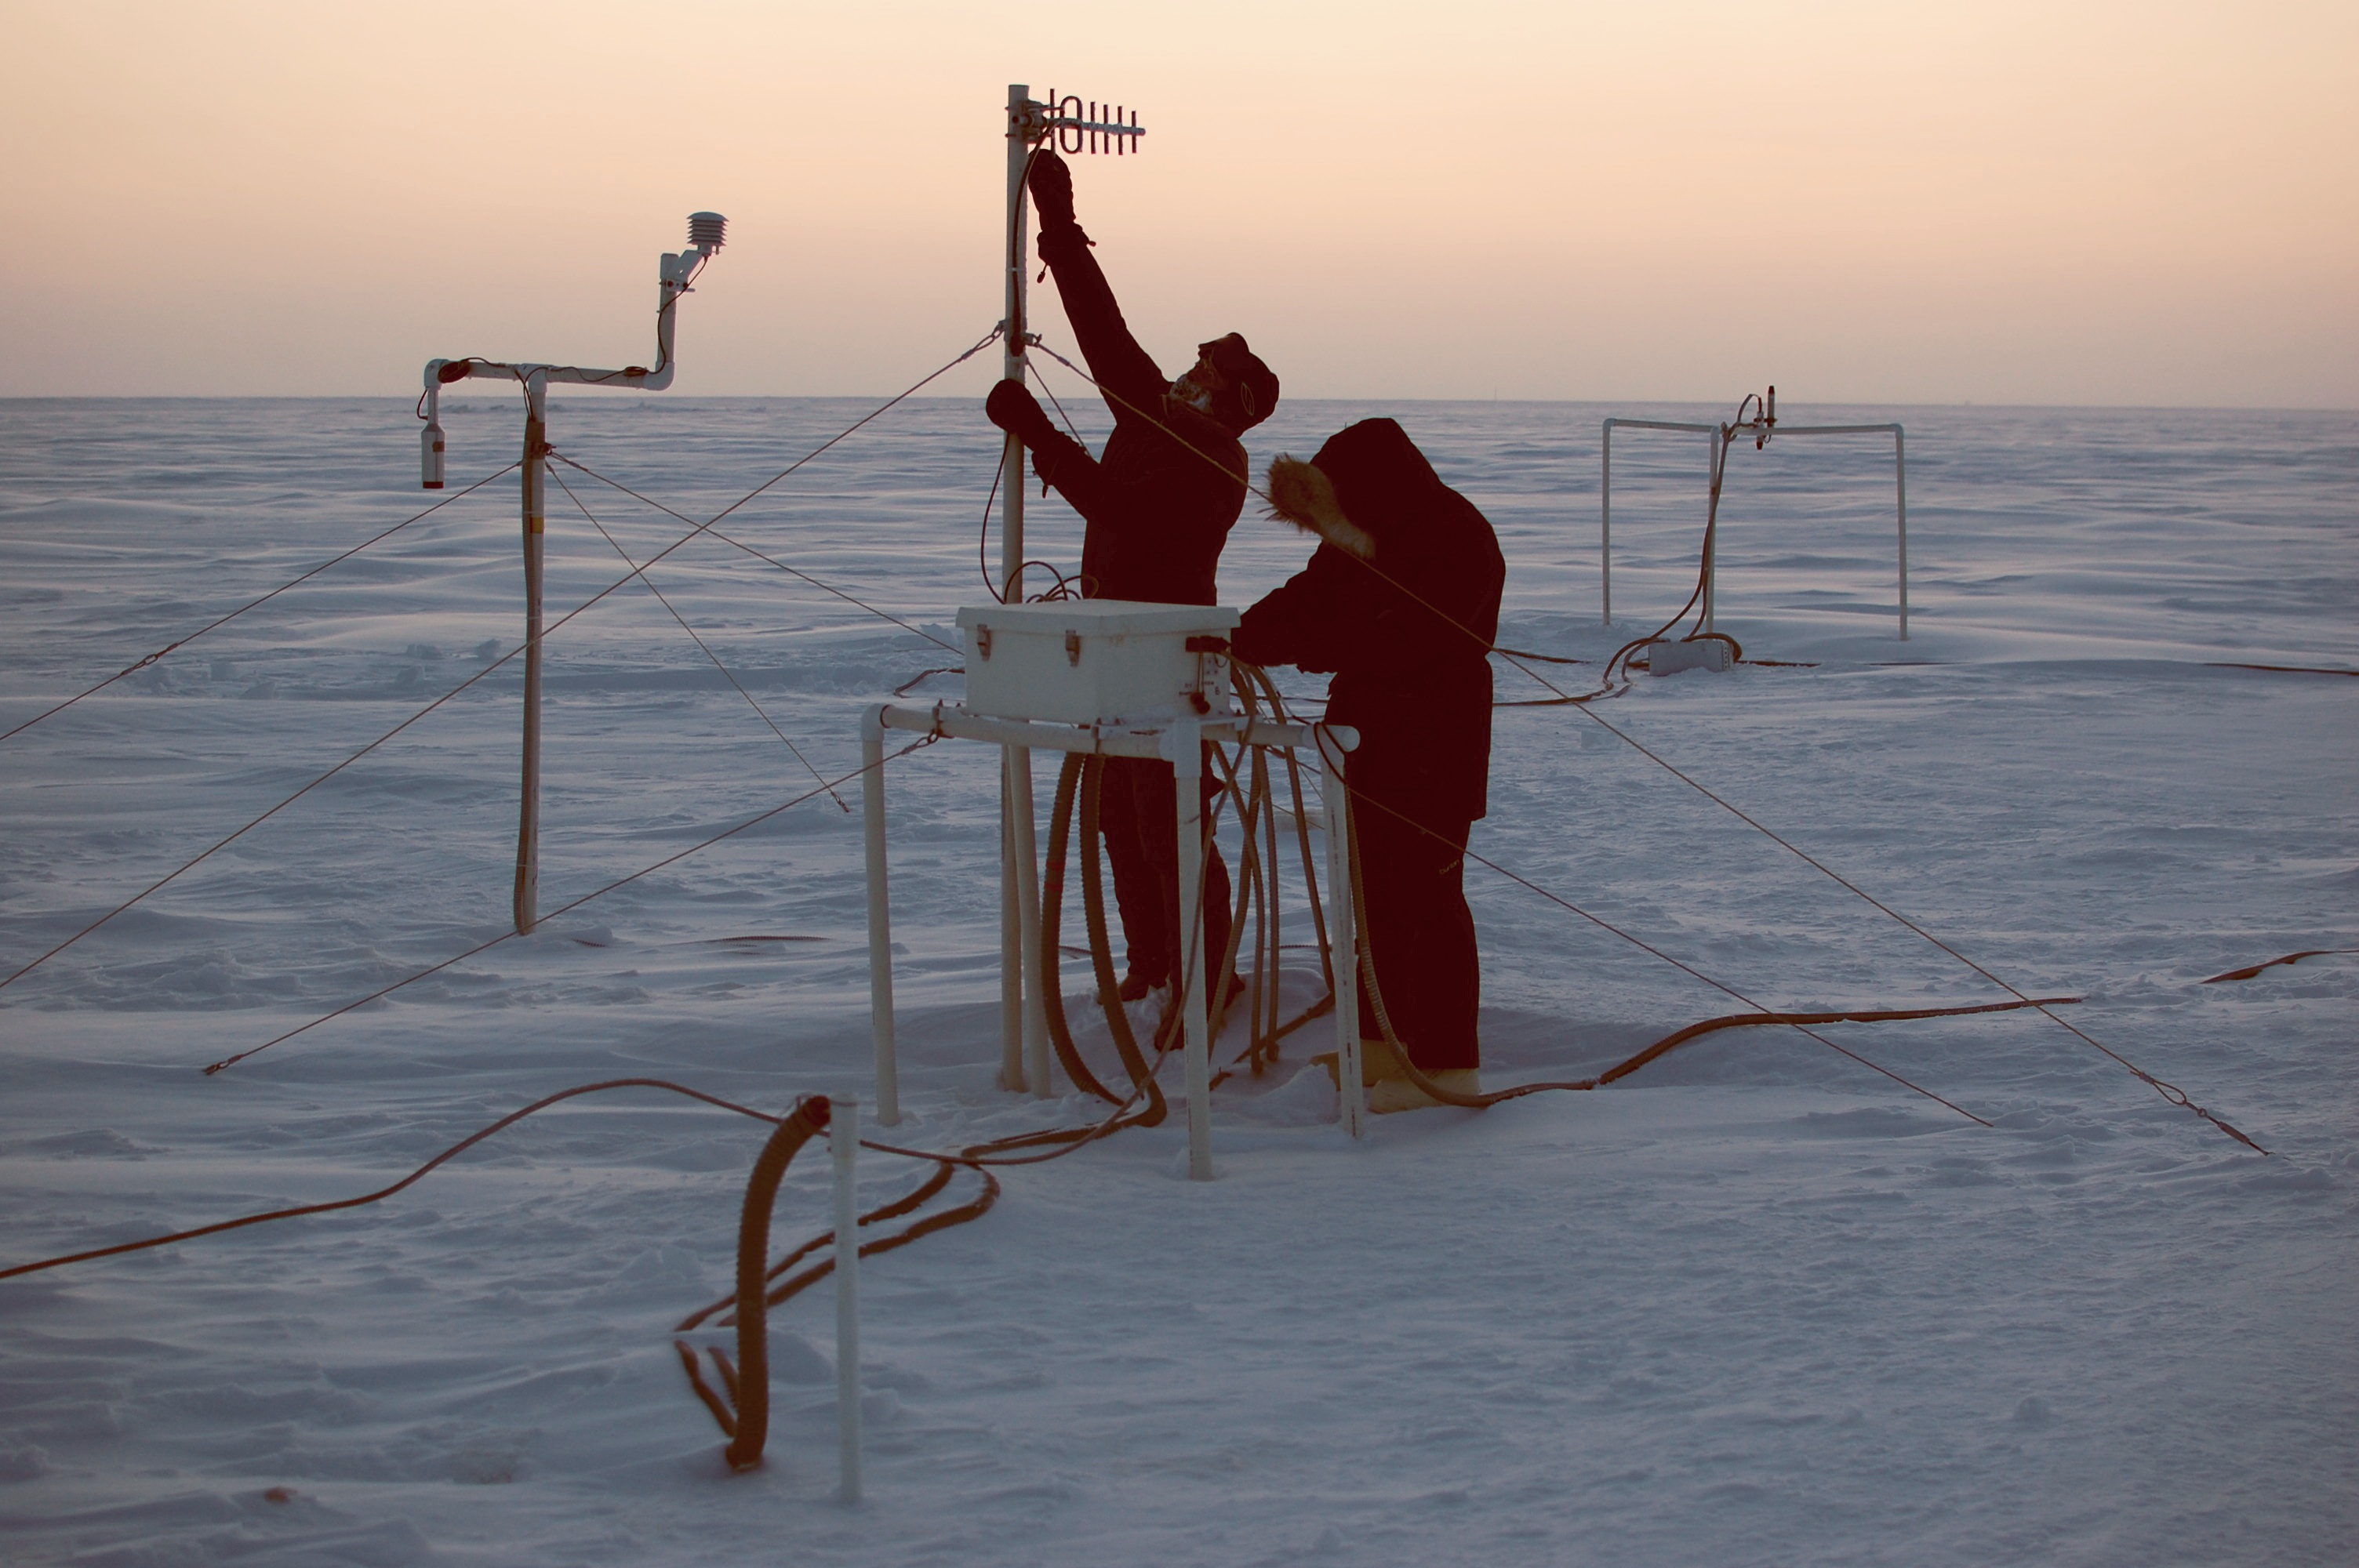
The sensor is located immediately offshore of Barrow, as seen below.

Below is the current view of the ice from Barrow.

We have an apparent paradox. The ice has been steadily thickening all year, yet a big hole has appeared in the ice near Barrow. The hole can be easily seen in the enhanced NASA satellite image below.

What could be causing the hole? The edges of the ice are clean and it has been too cold all month to melt, so something else must be going on.
The video below of the entire Arctic makes it clear. There has been a clockwise circulation which is shearing the ice away from the land in at least four locations (outlined by blue squares.)
We have found the recent decline in the JAXA extent graph, and it isn’t primarily due to melt.

stevengoddard says:
May 27, 2010 at 3:58 pm
Ice is three dimensional. If it is losing area on the leeward side of a peninsula due to shear, then it is increasing volume by piling up on the windward side.
One would think that might be happening but I can’t see where it is. The big hole north of Alaska should then pile up along the other side of the basin, Siberia. But there are plenty of open leads, and then big holes, along there too. The only place I can’t see clearly (too thick clouds) is NE of Greenland. Kind of a small area for all the missing ice to be?
Billy Liar says:
May 27, 2010 at 11:59 am
And don’t call him ‘Sheerly’!
Gary Pearse says:
May 27, 2010 at 1:30 pm
Spectacular summary. Well done!
And to whomever it was felt it was pointless to have a close up of the ice: I will often include the steps of discovery so others can see the process happen. Throws some folks who want the pablum pre-chewed; helps other learn to not stop at the first odd thing but keep going till the picture forms. Also, I’m fond of both close up and far away views of things. You see different details. Like the edge on the ice…
@Anu:
As you ought to know, it’s not the size, it’s the change of size that matters (ie. the anomaly). This graph:
http://www.john-daly.com/polar/flows.jpg
from this writeup:
http://www.john-daly.com/polar/arctic.htm
Has the rather interesting image of that Pacific water hitting the edge of the ice right where you would push to get the gyre to move… and with water draining away toward Canada off the other side. That the Pacific water is closer to the surface says to me that it is what is hitting the ice, not the deeper Atlantic currents that go all sorts of odd directions.
So I’d suggest two things. First, read that article. It will clear your cobwebs a bit. Second is more speculative.
I’d speculate that the increased gyre is partly due to increased Pacific inflows as the residual heat works it’s way out of the Pacific. It’s an 18 year lag from Equator to Arctic, so in 5 or 6 years it runs out, but until then it’s a heat engine running for the polar radiator.
So my speculation would be that the gyre speed could be matched to Pacific heating cycles, but with a 15-18 year lag; and I’d speculate that Arctic “melt” (that doesn’t melt but breaks up and washes out) is going to similarly lag Pacific heat.
You get 5 more year of Arctic Panic, then it’s game over.
R. Gates says:
May 27, 2010 at 7:08 am
Warmth in the Arctic winter. Interesting concept.
Just to be accurate the graphs you show don’t show warmth they show an anomoly from the norm. This years Barrow weather record shows that the thermostats only hit 0oC in the past few days. Back in March it reached a barmy -40oC.
There has been no warmth in Barrow this year to melt the ice. That will come from now onwards.
Excerpt from E.M.Smith on May 27, 2010 at 5:00 pm:
See here, specifically this graph. Esteemed Arctic sea ice experts like Berber, Meier, Stern, and Zhang agree with you, the Arctic Ice Death Spiral will soon have a long extended pause.
Of course all that evil human-made CO2 is still up there so it will resume eventually. In about twenty years from now.
R. Gates says: AGW or not, one of the forms of energy that sunlight is converted to wind…and so when looking at the total energy balance of a system, you need to look at all the forms of energy that solar radiation may be converted to and that multiple forms of energy (that once were sunlight) can cause sea ice to melt. That was my point.
And it’s a broken one.
The wind comes from the DIFFERENTIAL heating, not heating per se. A colder arctic can just as easily be the driver for higher winds. So I’d postulate that a drop in atmospheric thickness and a reduction in 03 (leading to higher IR radiation to space) at the poles (both most likely from changes in solar activity) result in higher heat transfer to space at the poles. That makes for a higher temperature differential with the (still warm) oceans that have spent 30 years in the warm phase of the PDO. Thus higher winds from LESS solar activity. (Note: No CO2 need apply).
Now play this forward for 30 years and we’ll have one very very cold arctic and a pretty cool Pacific and Atlantic oceans. And a very solid ice cap. Then the PDO can flip again and we’ll start the whole PDO cycle all over again.
So please, when doing all your ‘thought experiments’, please remember that a heat engine is driven by a heat DIFFERENTIAL and not by a heat level.
I never said wind would increase or decrease because of AGW. But but one thing is certain, if AGWT is correct, that extra energy that is not leaving the earths systems will be somewhere.
AGWT ? That’s a new one on me. “T” ? Well, it’s been a month, guess it’s time for the AGW crowd to mutate their argument again… and their name… and …
Oh, and all that “excess heat” – it’s all “in the pipeline”. Now all you have to do is find the pipeline… (It’s not the air, nor in the water, nor even in the land… maybe it’s hiding in the Aether…. or the ‘zero point’ energy of all the CO2 atoms or… /sarcoff>
So enjoy your hunt for “The Lost Energy of Hansen and Cru” … I hear it’s a great work of fiction…
I guess winds moving around the ice will always have a impact on ice extent. Winds from the north for example will somtimes push ice north of Europe out into the north Atlantic ocean where it will melt faster.
One other important point is the possibility that the older thicker ice is melting more and more leaving the arctic with a higher percentage of young thinner ice. Thinner ice is easier to break and easier to move around by wind and sea currents. This will potentially make faster transportation of sea ice out into open waters, depending on the wind direction of course. I think the potentially largest leaking and melting of arctic sea ice would happen if there is wind patterns favoring transportation of ice out into the Atlantic sea. See this youtube animation illustrating this possibility http://www.youtube.com/watch?v=Co68_tod0dQ&feature=PlayList&p=26FEF7FD6D6260E1&playnext_from=PL&index=0
Good night!
k winterkorn: “My linear projections show that if the rotation is this fast now, that by 2035, the ice cap will be rotating so fast that all the polar bears will spin off into the water and drown, and the baby seals will be crushed as the ice caroms off the coastline.”
lmao
Incidentally, my seven year-old daughter also thought this was hilarious and she fervently adores both polar bears and baby seals.
stevengoddard says:
May 27, 2010 at 1:47 pm
Phil,
So you are suggesting that the ice is simultaneously thickening and melting? Good call.
How do you get that from being told that it’s not ‘shear’ that causes polynyas, I guess ‘Normal Ice Decline’ didn’t make for a good headline?
stevengoddard says:
May 27, 2010 at 2:16 pm
Anu,
The unusual “melt” in 2007 was on the Pacific side, in the Chukchi and east Siberian seas .
Maybe by late September.
And yet in this year of record Spring melt, it is the areas closest to the incoming Atlantic warm water that show the biggest sea ice loss compared to the 1979-2008 mean:
Baffin/Newfoundland Sea:
http://arctic.atmos.uiuc.edu/cryosphere/IMAGES/recent365.anom.region.4.html
Greenland Sea:
http://arctic.atmos.uiuc.edu/cryosphere/IMAGES/recent365.anom.region.5.html
Barents Sea:
http://arctic.atmos.uiuc.edu/cryosphere/IMAGES/recent365.anom.region.6.html
Kara Sea:
http://arctic.atmos.uiuc.edu/cryosphere/IMAGES/recent365.anom.region.7.html
Laptev Sea:
http://arctic.atmos.uiuc.edu/cryosphere/IMAGES/recent365.anom.region.8.html
Hudson Bay:
http://arctic.atmos.uiuc.edu/cryosphere/IMAGES/recent365.anom.region.13.html
The areas not yet melting are all farthest from the North Atlantic, and its warm water flow into the Arctic:
http://nsidc.org/arcticmet/factors/land_sea_distribution.html#ocean_currents
Notice where all the biggest melts are:
http://nsidc.org/data/seaice_index/images/daily_images/N_daily_extent_hires.png
Are you going to have a special “Arctic Sea Ice News” when 2010 drops out the floor ?
http://www.ijis.iarc.uaf.edu/en/home/seaice_extent.htm
E.M.Smith:
“AGWT ? That’s a new one on me. “T” ? Well, it’s been a month, guess it’s time for the AGW crowd to mutate their argument again… and their name… and …”
Mike, what R. Gates means by AGWT is “Anthropogenic Global Warming Thermogeddon,”
[snip]
E.M.Smith says:
May 27, 2010 at 5:45 pm
The wind comes from the DIFFERENTIAL heating, not heating per se.
_______________________
I appreciate the point and I agree, but it does not invalidate my basic point that thermally derived wind represents another form of what was originally solar energy. You can’t get differential heating without just plain heating…you need the solar energy.
Thank for a good comment Anu!
I you list of great links I want to add the Arctic sea ice VOLUME. Because the ice has a thickness and is not just flat 🙂
http://psc.apl.washington.edu/ArcticSeaiceVolume/IceVolume.php
http://psc.apl.washington.edu/ArcticSeaiceVolume/images/BPIOMASIceVolumeAnomalyCurrent.png
R. Gates says:
May 27, 2010 at 8:16 am
If models don’t help us speculate, what good are they?
Very good question. The answer should be based on the state of the model. If the model has been tested and verified then they should help us make intelligent decisions. If they haven’t … well, now you know the problem.
Here is a illustration of what might be happening in the Arctic at the long run.
R. Gates says:
May 27, 2010 at 7:27 pm
If winds are picking up in the Arctic due to increased differential heating due to extra heat trapped, then the winds should also be increasing all across the globe. Not just in the Arctic and nowhere else.
Bering Strait water flow properties:
http://psc.apl.washington.edu/HLD/Bstrait/bstrait.html
Mattias says:
May 27, 2010 at 7:57 pm
Thank for a good comment Anu!
I you list of great links I want to add the Arctic sea ice VOLUME. Because the ice has a thickness and is not just flat 🙂
That’s very true, the shrinking volume of Arctic sea ice is a key component of how much the ice extent will shrink in the years and decades ahead.
I look forward to the CryoSat-2 data, and updates to the PIOMAS Arctic Ice Volume chart.
http://www.esa.int/esaLP/ESAOMH1VMOC_LPcryosat_0.html
E.M.Smith says:
May 27, 2010 at 5:00 pm
Read your own citation:
http://www.john-daly.com/polar/arctic.htm
Also note that, even in your citation, the Atlantic has 10 times the flow of water into the Arctic as the Pacific (8 Sv vs. 0.8 Sv). Half the entering Pacific water flows against the Beaufort Gyre.
You get 5 more year of Arctic Panic, then it’s game over.
At least you attempted a prediction – when it is falsified, you might be able to change your mind and move on. That’s better than those who prescribe everything to “natural variation”, and thus will never admit that CO2 is changing the climate.
jakers
If the ice is pulling away west of Point Barrow, then it is probably piling up east of Point Barrow.
According to NOAA:
‘Upper atmospheric winds conducive for storms. Wind shear, which can tear apart storms, will be weaker since El Niño in the eastern Pacific has dissipated. Strong wind shear helped suppress storm development during the 2009 hurricane season. ‘
So, why would the winds be stronger in the Arctic and not in the Atlantic if Anthropogenic Global Warming has created excess heat?
Problem: Making predictions based on PIOMAS and other models that depart from the reality of what’s going on.
Didn’t learn a darn thing from Pioneer, Voyager and HST observations of changing climate on other planets in the Solar System.
Garbage In to Spagehtti code / Garbage Out from Spaghetti code
Smokey says:
May 27, 2010 at 7:11 pm
E.M.Smith:
“AGWT ? That’s a new one on me. “T” ? Well, it’s been a month, guess it’s time for the AGW crowd to mutate their argument again… and their name… and …”
Mike, what R. Gates means by AGWT is “Anthropogenic Global Warming Thermogeddon,” [snip]
_________________
Hey Anthony, I realize that we “warmists” are outnumbered here and merely tolerated or seen as side-show attractions, but I sure don’t think we should be called such names and you’d never let us get get away with calling AGW skeptics “Fascists”…oh well, I know, it’s your site and you can do want you want…
REPLY: I agree, out of line, snipped. -A
Anu says:
May 27, 2010 at 7:11 pm
[Steve Goddard]
Are you going to have a special “Arctic Sea Ice News” when 2010 drops out the floor ?
http://www.ijis.iarc.uaf.edu/en/home/seaice_extent.htm
Soooo close…
11,230,469 km2 (May 27, 2010)
http://www.ijis.iarc.uaf.edu/en/home/seaice_extent.htm
Sea ice extent value to beat for May 27, 2006: 11,222,500
Still, we have a few more days in May, and 2010 has the steepest melt curve in recorded history. I’m going to go out on a limb and predict 2010 breaks through the floor before June.
Mattias says:
May 27, 2010 at 8:06 pm
Thanks for posting that animation. It’s an improved and extended version of one I linked to earlier
Dave Wendt says:
May 27, 2010 at 12:37 pm
I think it shows even more clearly that the primary driver of the decline in ice age, and as a consequence ice volume, was a dramatic shift in the circulation patterns of the Beaufort Gyre and the Transpolar Drift that occurred in ’89-’90 possibly related to the AO. See Rigor’s and Wallace’s notes for their animation that I included in my comment above.
Since the shift in the BG and the TPD seems largely unrelated to CO2, and on its own seems sufficient to account for the declining sea ice, it’s likely that in this case the canary in the coal mine might be dropping off its perch not because of bad gas but just because of plain old age.
stevengoddard said May 27, 2010 at 10:22 am
“It does “appear” from the JAXA maps to be melting, and that is exactly the belief being expressed in dozens of comments over the last few weeks – wrt the decline in the sea ice graphs.”
That’s cause it is melting, in the Pacific, in the Atlantic and Hudson bay. You have picked areas in the Arctic basin which you don’t think is melt but “shear” due to overall rotation. However temps in the regions are now around 0C and so this is actually higher than the melting point of the ice. This is why you don’t see this in mid winter but do tend to see it in Spring onwards, look at the multiyear animations for proof it is a combination of factors.
If it was just “shear” then we’d expect some to stay constant and some to shrink back to nothing, lets see if they do.
Andy