By Steve Goddard

JAXA shows the area immediately west of Barrow, Alaska as ice free. And it appears to be melting away from the shore.
The animation below shows the month of May so far.
This apparent melt surprised me, because the University of Alaska reports sea ice at Barrow 4-1/2 feet thick and topped by another foot of snow. The ice has thickened six inches during the past month and about 18 inches since the start of the year.


The sensor is located immediately offshore of Barrow, as seen below.

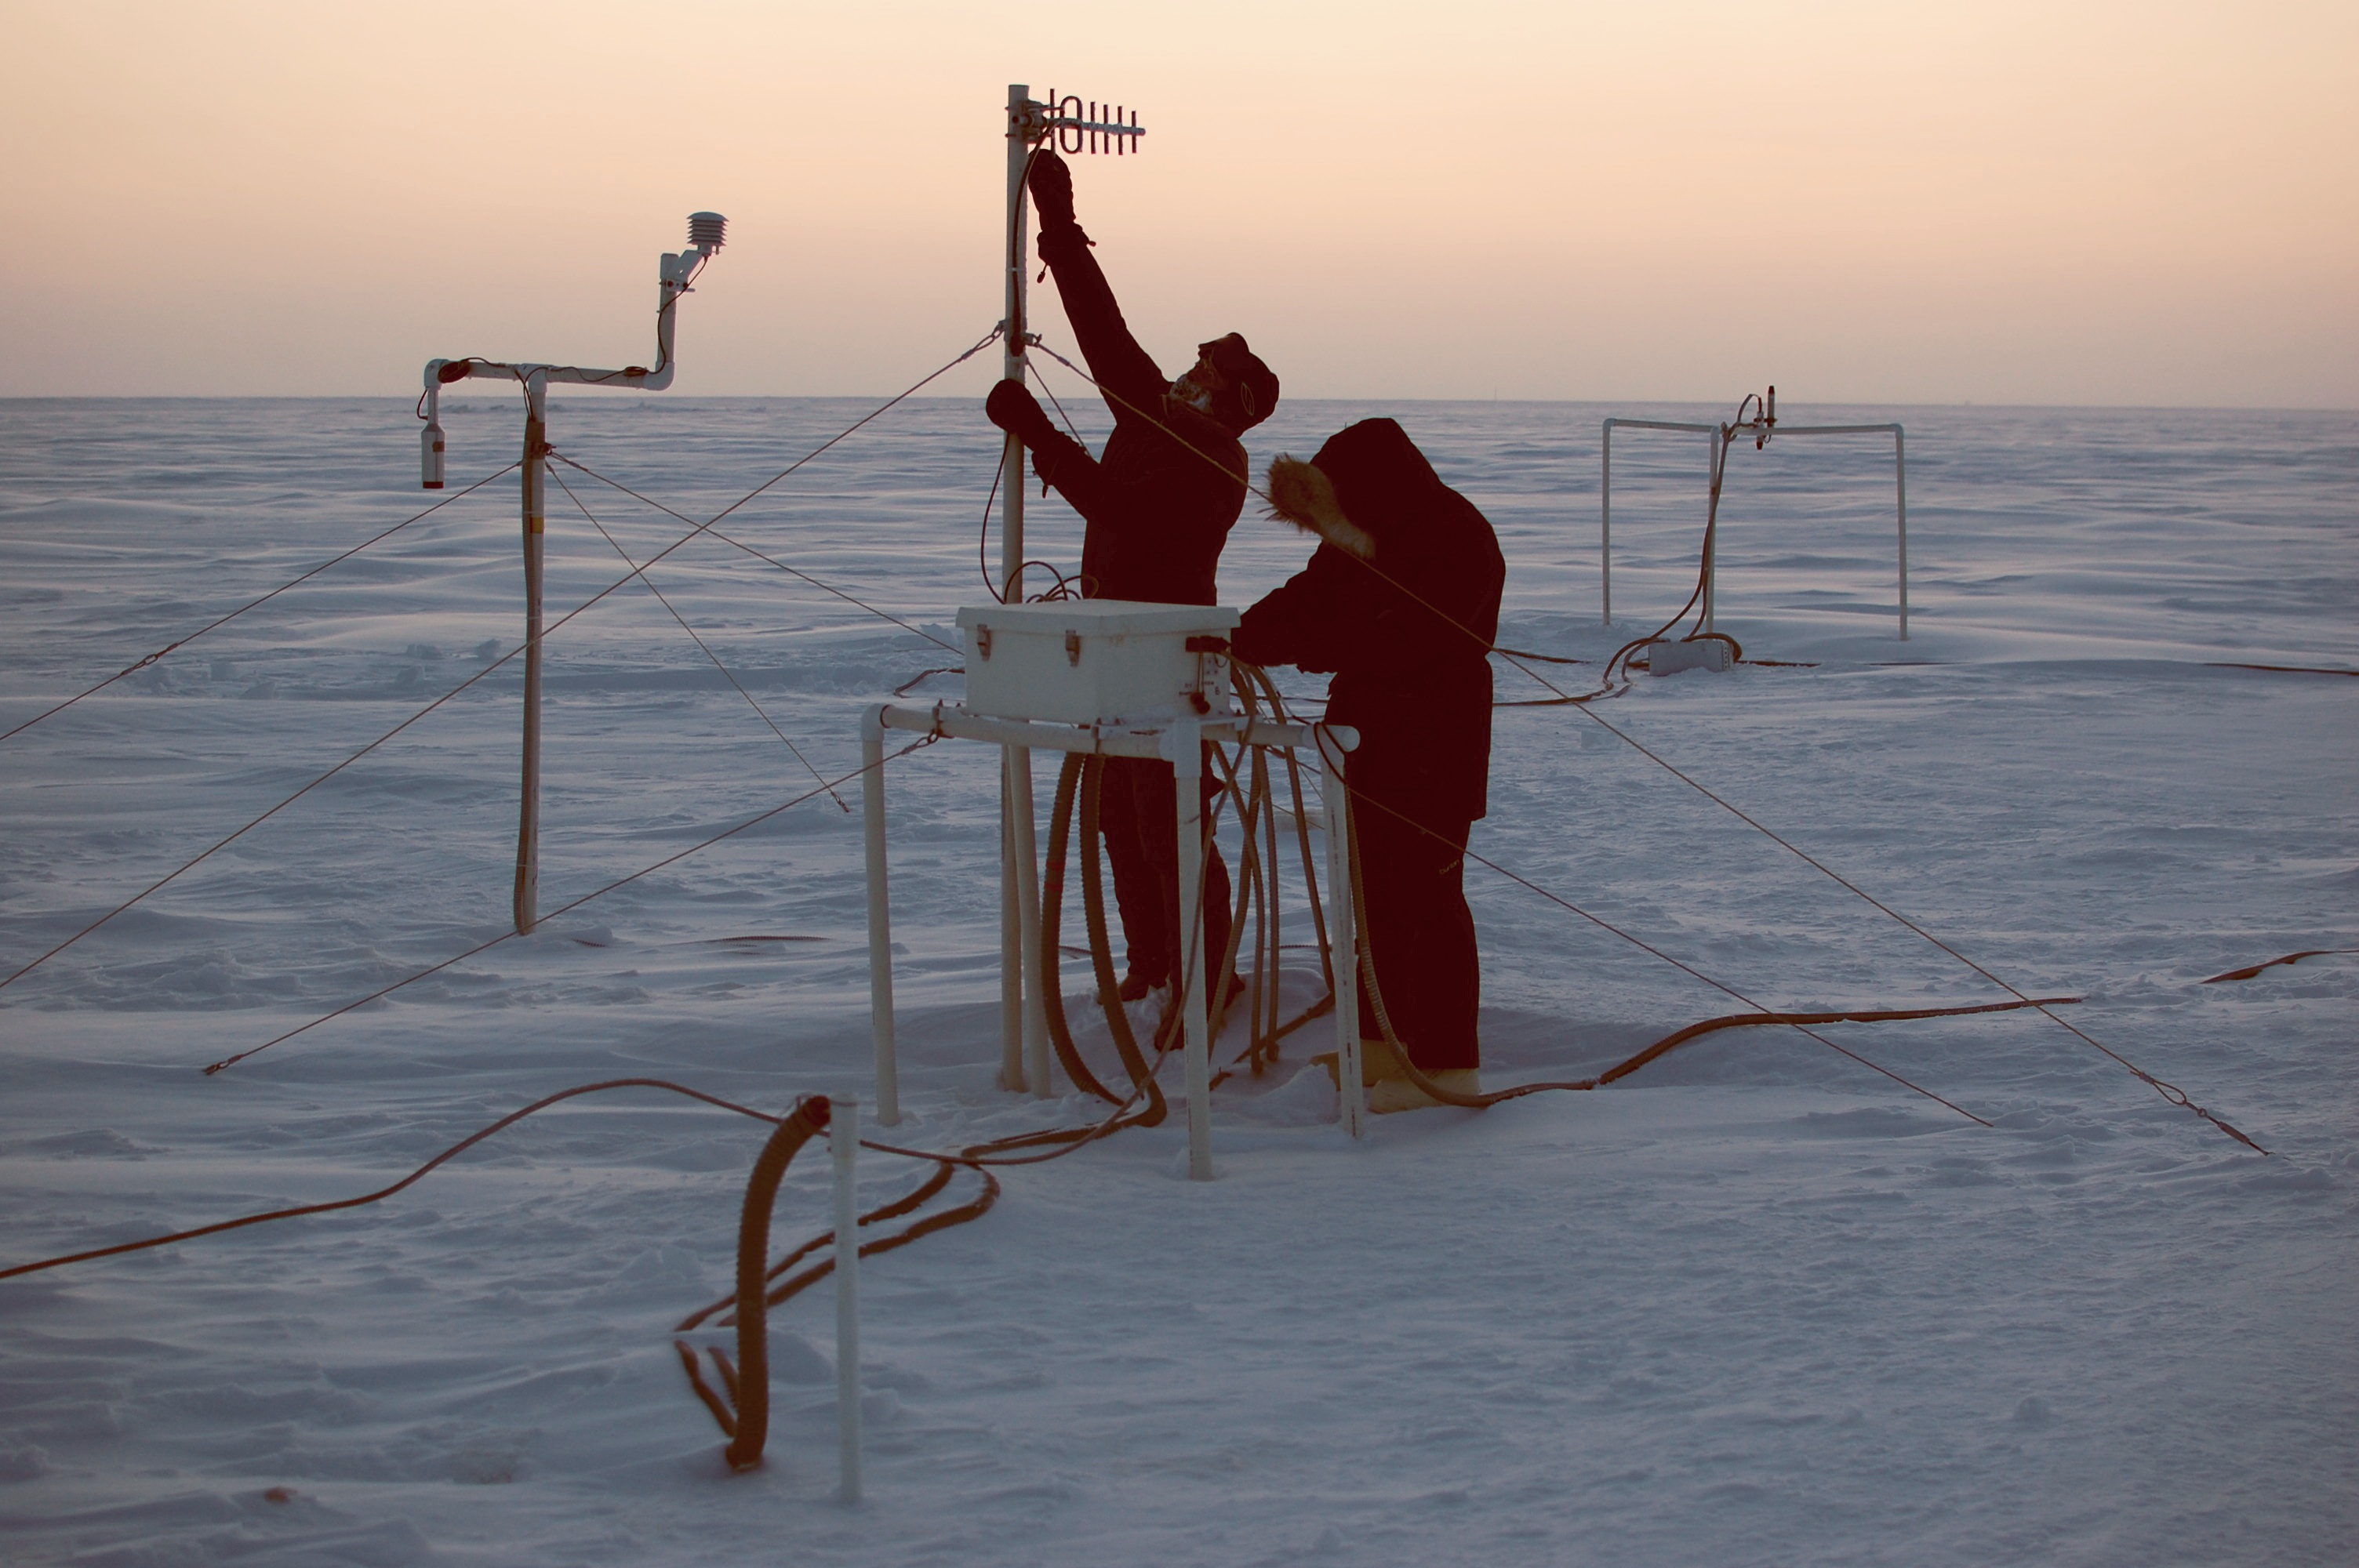
Below is the current view of the ice from Barrow.

We have an apparent paradox. The ice has been steadily thickening all year, yet a big hole has appeared in the ice near Barrow. The hole can be easily seen in the enhanced NASA satellite image below.

What could be causing the hole? The edges of the ice are clean and it has been too cold all month to melt, so something else must be going on.
The video below of the entire Arctic makes it clear. There has been a clockwise circulation which is shearing the ice away from the land in at least four locations (outlined by blue squares.)
We have found the recent decline in the JAXA extent graph, and it isn’t primarily due to melt.

It’s worse than we thought…sorry couldn’t resist
It’s global warming, absolute proof, what else can it be, WAGTD!
Less sarcastically it’s interseting that the ice appears to be thickening despite this apparent clearing (not melting)of ice.
If we’re going along those lines, Eddie, perhaps someone should “hide the decline”! Now who could we get to do something like that?
Steve, maybe I’m a bit thick, but your points seem difficult to follow.
Why do you show the current photo of Barrow? Are you saying something is wrong with the satellite photographs? I think the photo shows a dark line near the horizon which could be an ice opening. But, again, what has this photo got to do with the apparent point of your article?
All you need to show is the animation of the entire arctic area in support of your hypothesis of a clockwise rotation. Or are you also saying that the AMSR-E graphs are inaccurate? If so, why did you place so much emphasis on the same graph back when the red worm was strong?
This is shear madness … couldn’t resist either.
But a death spiral is so much more interesting than mere wind or currents. Come on Mr. Goddard, you need to get with the program.
Is it similar to what NASA reported in 2007?
http://www.nasa.gov/vision/earth/lookingatearth/quikscat-20071001.html
http://wattsupwiththat.com/2007/10/03/nh-sea-ice-loss-its-the-wind-says-nasa/
Here you go again Steve…
First, you said:
“The video below of the entire Arctic makes it clear. There has been a clockwise circulation which is shearing the ice away from the land in at least four locations (outlined by blue squares.)”
RESPONSE: It’s called the Beaufort Gyre, and it’s a nearly constant feature of the Arctic ocean. Nothing new this year with that.
__________
Then you said: “We have found the recent decline in the JAXA extent graph, and it isn’t primarily due to melt.”
Seems that no matter what happens, AGW skeptics will try to find any OTHER reason for the ice to decline in the Arctic, other than the fact that the region has seen the bulk of global warming so far. And have you considered the fact that thinner ice, with lower volume will be more easily moved by the Beaufort Gyre? I remember no too many weeks back that you had reported (erroneously) that the sea ice off of Barrow was “at least 10 feet thick”. I of course quckly corrected you and first pointed out the fact that it was only a little over 4 feet thick. Now at least you’ve got that right, but please don’t try to make the clockwise circulation of ice in the Arctic anything new. It exists pretty much all the time, every year, so that pretty much every year the ice is subject to the same clockwise sheer forces…but thinner ice can be sheered away much more easily.
Now I can begin to see what your repsonse and other AGW skeptics may be if we see a summer sea ice minimum in the arctic that is below 2008 and 2009— you’ll claim that early melt season “sheering forces” tore the ice away, and that it had nothing to do with warming or climate change…all the while, completely ignoring all the other consequences of the obvious warming in the arctic, such as the melting of permafrost. Last time I checked, the Beaufort Gyre wasn’t able to melt permafrost.
For those interested, this graph shows the warmth the Arctic has seen over the past few months:
http://data.giss.nasa.gov/gistemp/graphs/
Though of course, we’ve already heard why the GISS data is not to be trusted…so I guess “sheering” forces must the reason. 🙂
REPLY: Seems that no matter what happens,, that AGW alarmists will ignore any other possibility than CO2 as a cause. – A 🙂
Two days ago, on my plane trip from Minneapolis to Narita/Tokyo (then to Manila), the plane’s route is south Alaska including Anchorage. I saw thick snow on the mountains and glaciers east of Anchorage. At least 1 1/2 hrs of the plane ride above Canada and Alaska, sights of snowy mountains. After Anchorage, a lake, then lowlands, and then the snowy mountains are back. I thought that if south Alaska has wide snow cover, then north of Alaska should have wider and thicker snow cover. The sea west of south Alaska, is it Bering Sea, has lots of floating ice. Further north of that area, the sea ice are more compact. So I doubt that it’s correct to say “less/declining ice extent” up there.
It’s the rotation of the earth and the curvature of the land northward that is east of Barrow is blocking the movement of the ice. There must be a huge shove of ice at the location where the ice is jamming. Anyone living up there and can take pictures?
Thanks for the videos that makes it easy to see! And thanks for the explanation that’s makes it easy to understand. 🙂
See the current Barrow Sea Ice Radar imagery here:
http://seaice.alaska.edu/gi/observatories/barrow_radar
There is some cool stuff on this site.
It appears to me to be new, clear ice, forming at lands edge due to wind driven leads opening along the shore line as the, snow covered, pack moves away. In some areas the wind blown snow is covering the new ice. The ice measuring station, originally at the ice edge, has moved out as the ice is moved.
R. Gates says:
May 27, 2010 at 7:08 am
gosh R Gates, why are you so long winded all the time?
There is not ‘warmth’ in the Arctic. You call it warmth and then provide a temperature anomaly map that you think proves it. But the anomaly map is just showing there’s above average temperatures. Which means, for example, instead of being -25F it’s -22F. And you call that warmth.
You don’t know what you are doing R Gates. And I appreciate that you talk a lot so that everyone can see that you don’t.
Meanwhile south of the Mason Dixon line, and the equator, winter is setting in. It appears the Antarctic is growing above norm: http://arctic.atmos.uiuc.edu/cryosphere/IMAGES/seaice.recent.antarctic.png
As to the Arctic, give it a rest on all sides. There is more we don’t know that we do know. Currents, wind, tides, rotations, etc. Harping on a single factor is rather misleading.
Anthony said:
“REPLY: Seems that no matter what happens,, that AGW alarmists will ignore any other possibility than CO2 as a cause. – A :)”
______________
Touche’ — except I really hate being called an “alarmist”, that indicates something far different that simply studying whether or not CO2 is causing climate change, inferring that the change might be catastrophic, etc. I currently am far more interested in what is happening and why, then the impacts of that, and I think you be hard pressed to find postings on this site where I’ve raised “alarmist” kinds of issues.
Amino Acids in Meteorites says:
“You don’t know what you are doing R Gates…”
_______________
That well may be the case…or may not be. But I posit a question here: If I’m right, and the summer sea ice minimum is this year turns out less than 2008 or 2009, and not more, as Steve has said he believes will happen, then what? I suspect that your AGW skeptical nature will find other reasons why I just happened to be right, such as “sheer” forces or wind or who knows what else. I was ridiculed yestereday for example for pointing out that waves change the albedo of ocean water, especially for low sun angles, until I had to dig up all the research to prove my point.
I may well not know what I am doing, but I think I know a bit more about the Arctic then given credit…:)
Mike Jowsey wrote May 27, 2010 at 6:53 am:
Why do you show the current photo of Barrow? Are you saying something is wrong with the satellite photographs? I think the photo shows a dark line near the horizon which could be an ice opening. But, again, what has this photo got to do with the apparent point of your article?
Here’s a stab at it –
The Barrow photo appears to support the claim that it is still very cold and area ice has been increasing in thickness. So, if is cold enough to make area Ice increase thickness, what caused the gap between the land South and West of Barrow and the arctic ice mass? His observations point toward the shear forces, rather than to warming induced melting. He’s just covering the bases, by providing various forms of information to support the conditions at this time. I find his approach to be very helpful. Hopefully these comments are pretty close and address your question.
In my opinion, too much is focused on the ice and not enough on the water under this ice, nor the wind and water currents.
As a harbor master in the lesser 48 for the best part of a decade, we most often had the fresh water lake frozen over.
The BP oil spill in the Gulf is having a devistating effect on the Arctic. We simply must take them to the World Court and sue their pants off. Who needs Big Oil anyway? After all what have they ever done for us? It’s a crying shame that Alaska has a Gopper for Governator, and Canada has a Conservative PM, but at least we can give trillions in compensation to Russia and Northern Europe. Right?
Since BP is a “British” firm, we really take the GB to court and make the paupers too. Left?
______________________
For more charts:
http://www7320.nrlssc.navy.mil/pips2/index.html
Steve, in the MODIS imagery you can see fast ice attached to the shore near Barrow, even Elson Lagoon appears to still be ice covered. The camera image you show in your post also shows open water beyond the fast ice still attached to the shore. Thus, your post is very misleading and conclusions reached do not follow from the figures you chose to display.
R. Gates is correct, the Beaufort Gyre is always present, but for thinner ice, the ice moves more easily. It would probably have been good to include in your post the SLP fields as you can see a very well-developed Beaufort Sea High. And then it would have been good to discuss the implications of a strong Beaufort Sea High. It doesn’t surprise me at all to see the ice being pushed away from the shores of Barrow by the Gyre, especially given how thin that ice is.
I’m also curious why you wouldn’t bother actually addressing the decline that according to the latest AMSR-E data shows it has now become the lowest extent on record for this time of year. Seems you want to hide the decline.
I think it’s important to remember that there are so many processes at work, many of them linked, so it’s not that easy to separate them out. Changes in atmospheric circulation are a consequence of changes in energy balance, so it’s a bit of a chicken-and-egg issue. Thus, saying it’s all wind w/o understanding that wind changes may also be a result of warming, is just plain wrong. Just as it would be incorrect to say all the changes in the ice cover are a result of warming.
R. Gates
If it turns out that my forecast for summer ice is incorrect, I’m sure you will let me know. That judgment date is still 3-1/2 months off, so why speculate now?
The Naval Ice center has alot of information about the state of the Arctic sea ice. For other “Ice Watchers”, here is an article about the PIPS model used for short term forecasts.
http://www.tos.org/oceanography/issues/issue_archive/issue_pdfs/15_1/15_1_preller_et_al.pdf
An interesting read.
The curent PIPS 2.0 model forecasts are available at,
http://www7320.nrlssc.navy.mil/pips2/ithi.html
This includes concentration, movement and thickness data; both current and archives from prior years. I find comparisons of the 2007, 2008, 2009 and 2010 data for the same date interesting. The current thickness for 2010 depicts a substantially greater average thickness across the entire arctic basin than is shown for 2009. It certainly doesn’t look like the ice volume model estimate that are referenced here by the AGW fans.
The model includes the current movement vectors and illustrates how the Beuafort Gyre changes and how movement toward the Fram Strait is an on-again-off-again dynamic.
It’s an interesting site to click around to see a different set of ice data.
The post by Henry chance @ur momisugly May 27, 2010 at 7:36 am may be the best reflection in a response. The sharp edges reflect a tearing effect. Hydraulic lifting of the ice?
Plate movement, volcanic activity, collision of sub-surface currents?
All this weather and climate talk is a debate in vacuum. The best we can hope for in understanding long term trends and application thereof is how it affects us, not how we affect it. Most of us are along for the ride and filling dead time…
Its obvious.
God put his/her finger on the ice to prevent rotation, while the Earth and water continued to spin underneath, causing the differential motion.
Well, that is according to the Gospel of Gore in the New Warmist Testament, anyway (King James version).