UPDATE 4/23 4PM: I’ve been in contact with the Eureka Weather Station manager, and despite the incredible nature of the temperature jumps that are outside of normal experiences, such as July 14 2009, they do appear to be real. The METAR coding errors are another issue. I have many pictures now, plus a plan map, and a better meteorological insight than what can be gained from the meager online metadata. I’ll have an updated post later tonight or tomorrow – Anthony
Ecotretas find more cases of missing “M”s and mangled data in METAR reports making it into climatic temperature data. I’ve reposted his findings below and added some of my own notes [in brackets] to strengthen his findings. This time it’s Eureka, Nunavut, Canada. From “Up Here” magazine:
The first High Arctic Weather Station in history, Eureka was established in April 1947 at 80-degrees north latitude in the vicinity of two rivers, which provided fresh water to the six-man United States Army Air Force team that parachuted in. They erected Jamesway huts to shelter themselves and their equipment until August, when an icebreaker reached Eureka – as it has every year since – and brought permanent buildings and supplies. For decades after that, small, all-male crews would hunker down for entire winters, going a little stir-crazy from the isolation.

As I pointed out last Saturday there’s a common reporting flaw in world meteorological stations that use the METAR weather data format to report their hourly temperatures. Just one bad report in a cold location in the Arctic or Antarctic is enough to throw off the whole month’s worth of data when averaged. And it is monthly data that is used for climate. The all time high temperature error identified below has found it’s way into Wikipedia as “factual” when it is clearly wrong.
Some METAR and other kinds of unidentified errors also seem to be finding their way into official Environment Canada data. I’ve made screencaps. Given the importance of this weather station as the last surviving GHCN station that far north, also used in GISS, you’d think better quality control would be done, particularly when EC has a statement about data quality on each data page. What has been found seems to point to a corrupted dataset there.
– Anthony
=======================================
Eureka by Ecotretas


[Images above from GISS – click to enlarge]
Eureka, in Nunavut Canada, is a very special meteorological station. As can be seen in the first image above, it is responsible for the very big stripe on the very top of Canada. As can be seen on the second image, the data from only one station is responsible for a very big percentage of global temperatures… Both graphs can be obtained here.
So, one would imagine that data for this station is quality proof. We found two sources for temperature data: at Weather Underground and at the National Climate Data and Information Archive.
The first interesting data about this station is its record high temperature, which according to Wikipedia was reached on July 14, 2009, with 20ºC. [image below added by Anthony]

[UPDATE: Wikipedia editor removed the sentence above within 8 hours of this posting. See discussion here]
On Weather Underground, the monthly page for that day does say that 20ºC was the maximum temperature. But when you check the METAR data, the maximum temperature was 14ºC.
[Here is where it really gets strange, I’ve added two screencaps from Environment Canada, on for the monthly data, another for the daily data from July 14th, 2009. They don’t match! The 20.9C value never appears in the July 14th hourly data. Click images below to enlarge, EC’s July 2009 Monthly report on the left, July 14th, 2009 daily/hourly data on the right. Perhaps EC corrected the error in the daily/hourly data, but missed the monthly? – Anthony]


[click images above to enlarge]
[It also shows up as 20.9C on the EC yearly report for 2009, shown below]

Checking the Environment Canada page, the maximum for the date was 14.4ºC.
Things were different on the day before, July 13th. Maximum temperature for Weather Underground was also 20ºC, while at Environment Canada was 19.6ºC. But if you check the graphs below, some special heat occurred at 10PM, when temperatures soared some 15ºC!
(click images to enlarge)


[Image below added by Anthony. Here is the METAR report for Eureka, via Weather Underground, the error is highlighted in yellow, note the jump in temperature followed by a fall the next hour]

[In the image below added by Anthony, note the implausible temperature jump in the Environment Canada data for July 13th, 2009 at 22:00 where it was 5.9C at 21:00, jumping to 19.6C at 22:00, then back down to 4.1C at 23:00. Looking at the weather conditions of clear sky and moderate sustained winds from the North ~ 24 km/hr, there does not appear to be a meteorological explanation. Looking at the METAR data above, it appears the temperature was rounded up by the observer to 20C from 19.6. This makes me wonder if the event could be caused by something like a plane, truck, or snow-cat parked briefly near the sensor. In the Arctic, vehicles are left to idle, as turning them off allows them to freeze up, sometimes never to be restarted. ]

As Anthony Watts pointed out at Watts Up With That, the Eureka station registered the biggest rise in temperature probably seen on the Earth’s surface: 86ºC in one hour, on March 3, 2007! Now this data is available on Weather Underground, but seems not to exist in Environment Canada. The graph differences are clear below:


But that seems not to be the case in other examples. Take January 1st, 2007, for instance. Both Weather Underground and Environment Canada agree: there was a mighty spike at noon. Seems like the “M” problem affects both:


[Here’s the METAR data with the missing “M”, note at 11AM the M reappears]

There are times where differences are not so big, but the “M” problem is still there. Check the images from Weather Underground and Environment Canada for September 26, 2006:


Other times, changes are so significant, that something must be wrong. Check out the temperature rise on June 20, 2005. On the left, the weekly graph from Weather Underground shows a great surge in temperatures, confirmed by the Environment Canada graph for the day.


=====================================
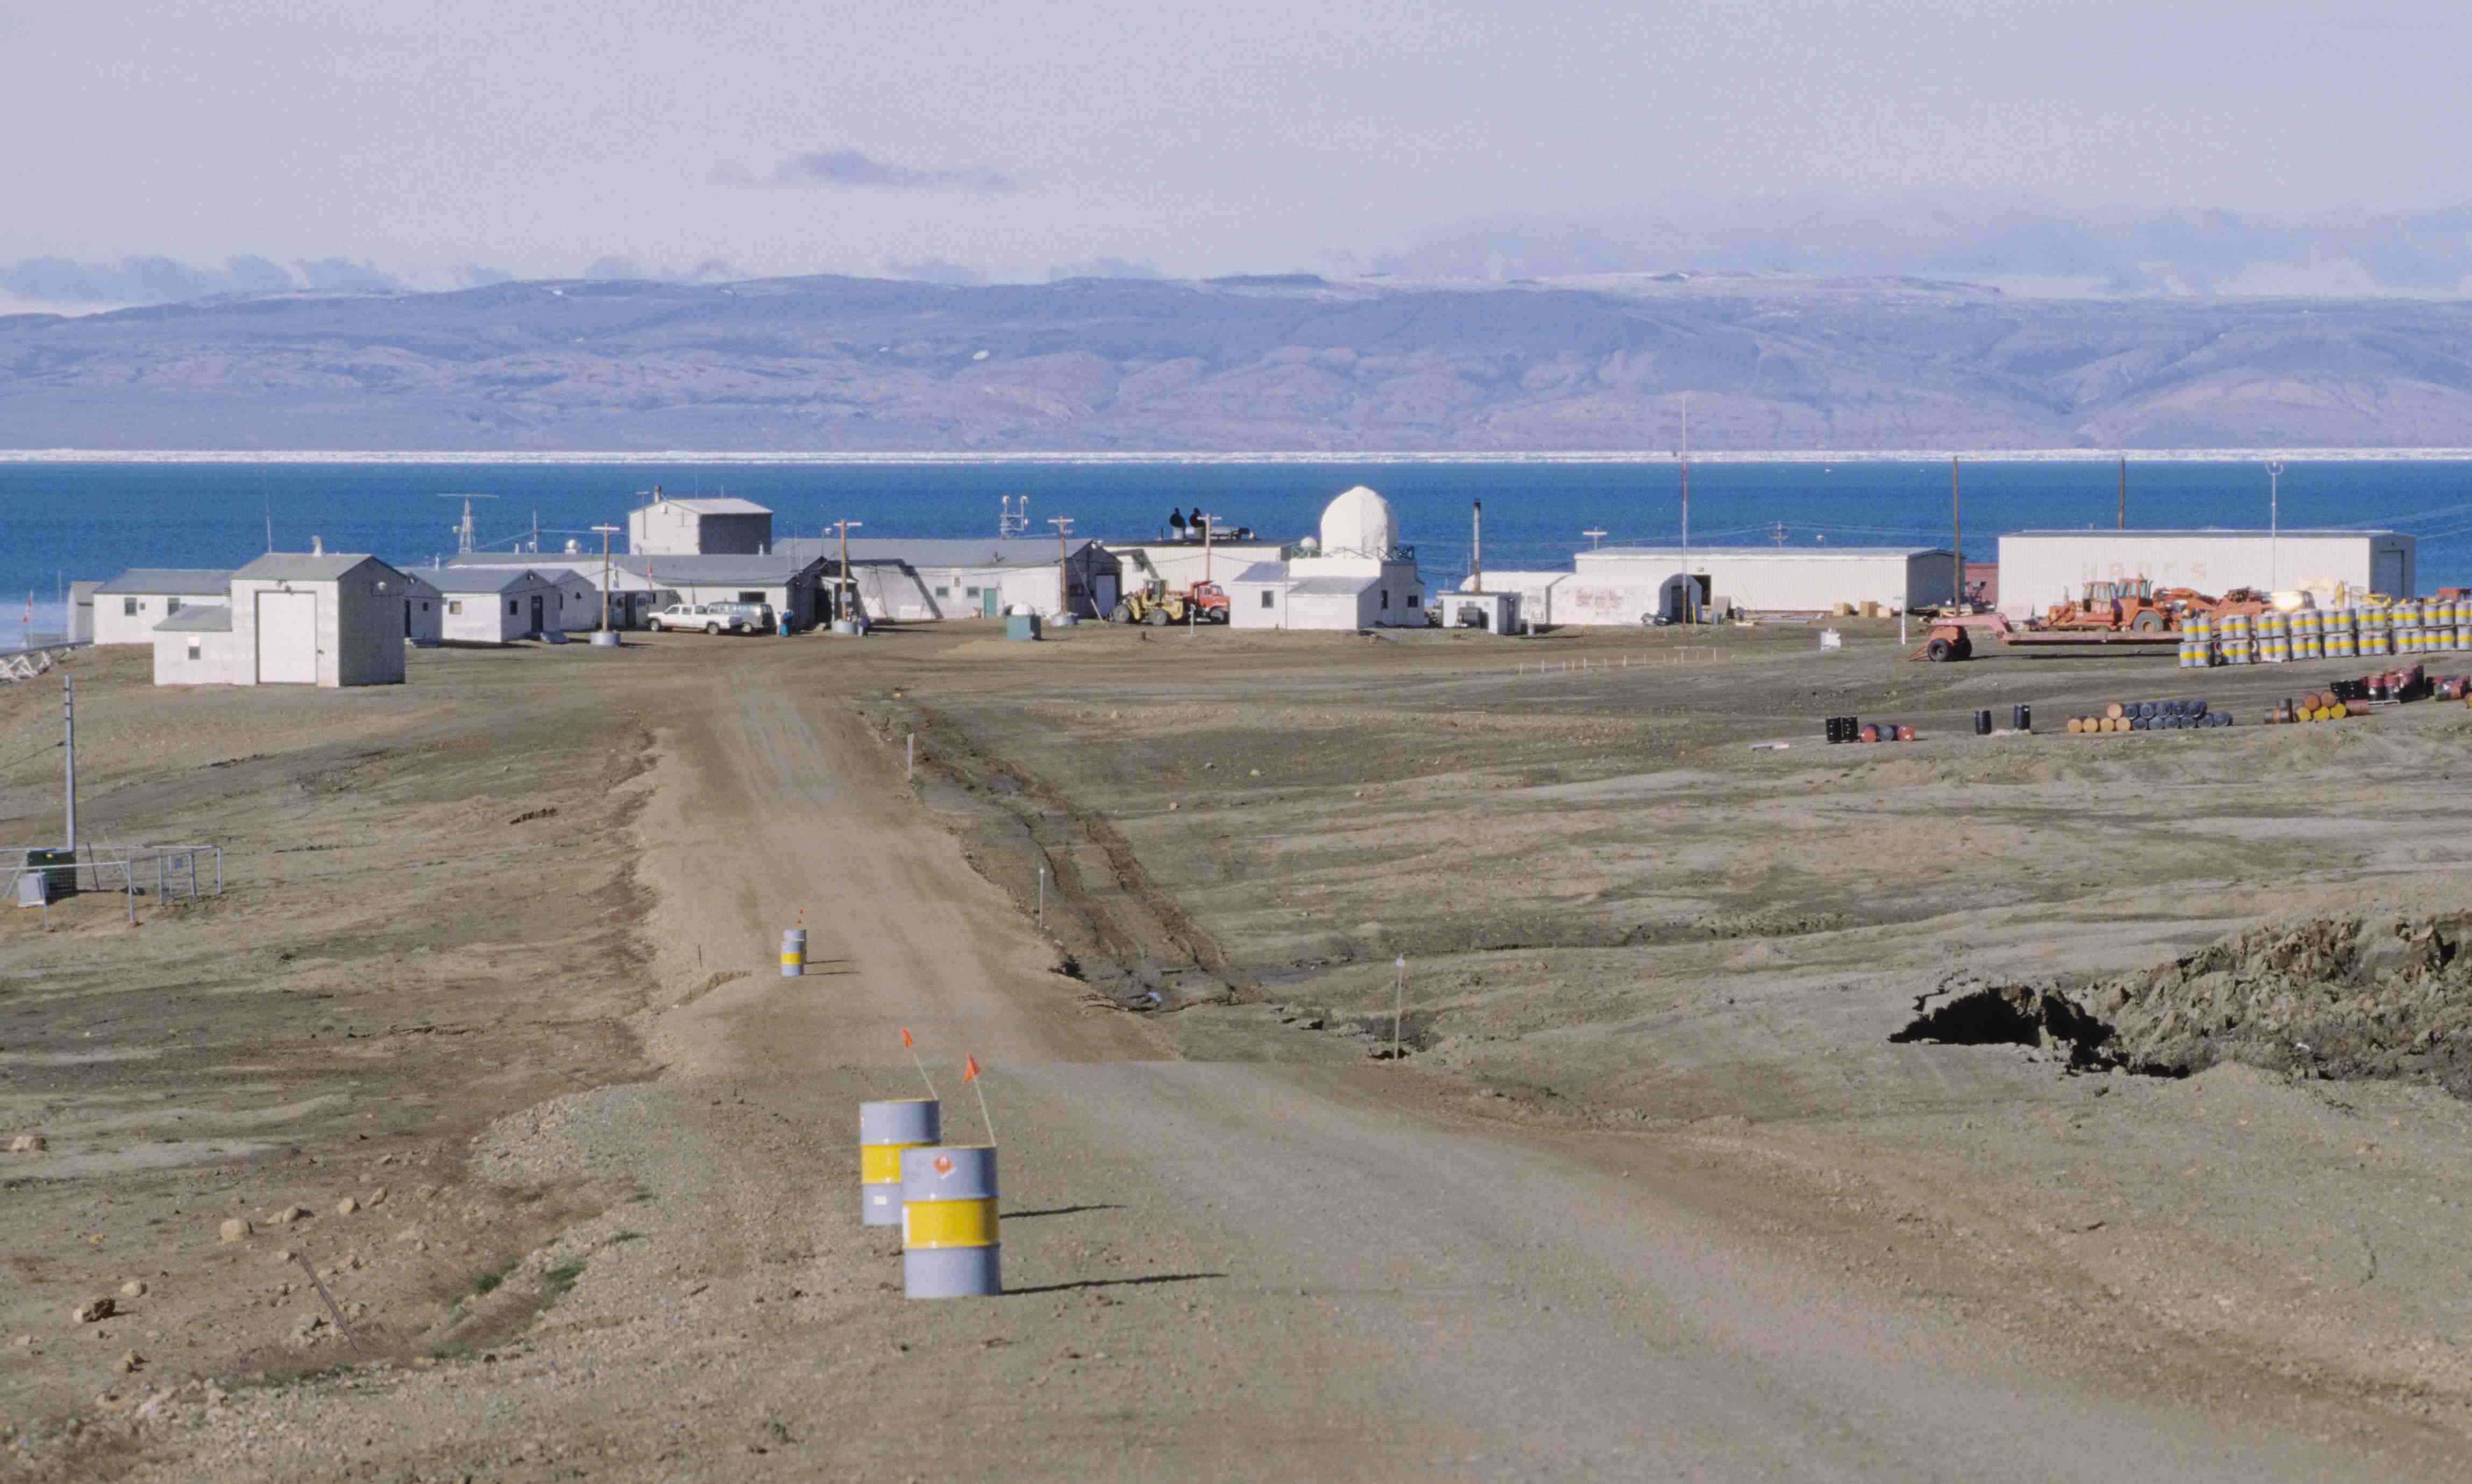
Thanks to Ecotretas for his sleuthing, I’m sure there are many more like this yet to be discovered. It seems with Eureka, more is going on than METAR errors. The temperature rises reported seem impossible given the meteorological conditions, and because they seem to be automated, suggest sensor error or perhaps sensor environment contamination (like a vehicle or other heat source). If you look at this 1997 image from Wikipedia (and click it to get the super hi-res version and pan around) you’ll see a number of vehicles near buildings. Where is the temperature sensor? – I don’t know, but if someone can find out it might shed some light on this mystery.
The fact that the obvious error on July 14th is now cited in Wikipedia as an “all time record high”, when it doesn’t appear in the EC hourly data, is troubling. – Anthony
Tim Clark (09:47:16):
The weather station is visible to the left of balloon man at: http://xpda.com/arctic04/PICT7627.jpg
Cross-reference with image here taken on top of the hill behind/right of balloon man (on page for Aug 22, top): http://www.zeco.com/upload/rep_ptb_2008-09-16_133549/GREL0801-log.pdf
http://friendsofginandtonic.org/ is so lame it hurts.
This is a great thread and this site is MOST addicting!
As for another “gate”: What about “Sign-Gate”?
Thanks Anthony and the other big names…I’ve learned a ton and have come to respect you all a great deal over the last 6 mo. I’m currently working my way through the infamous Unit Root thread over on Bart’s blog– most facinating and the details are definitely way over my head but not the basic idea.
How about negate?
James
Anthony, just an update for your update.
Appears someone at Wikipedia reinserted the statement, claiming verification from EC and using the METAR data. They then go on to do a little bashing of your website and claim they need to remain neutral!
REPLY: yes I saw that, quite humorous. -A
Wait a minute! Isn’t this how “smoothing” works?
Please tell me that massive inconsistencies such as this are identified and smoothed out of the data.
Isn’t this a process that Dr Hansen has openly admitted is a crucial aspect of data presentation?
Surely then the GISS map is showing us the data “post smoothing”, in which case the anomolous temp reading is meaningless.
If the data has been smoothed, then these odd readings should not in themselves constitute a problem.
Anthony, let me set the record straight!
I am the station manager of Eureka and was on site when we broke a new all time high on July 14, 2009 of 20.9°C and have the picture to prove it! The reason there was such a big fluctuation in temerature from the METARS before and after the record breaking temperature was all due the direction of the wind. If you look at the location of the weather station (and where the stevenson screens are), it is located about 300 metres inland from the north shore of Slidre Fjord. Normally our winds are from the East, South or West which cools off the air as it passes over the cold waters of the fjord. However, when the wind switches from the north the temperature will be representative of the inland over the Fosheim Pennisula. Inland temperatures can be 10 – 15°C warmer during the summer months than along the shoreline where we are situated.
There was no malfunction of equipment nor data entry errors. It is all due to local effects and whether the wind blows from the north (inland) or not.
Having said that, I have personally seen the effects of global warming at Eureka over the past 12 years as each summer we break a new record maxium high and we see more and more mudslides on the tundra as the permafrost melts even lower and can no long support the clay and dirt above it.
If you or anyone else wants to see my picture of our RTI showing 20.9°C please e-mail me at EurekaWxStn@ec.gc.ca
I have many more pictures of Eureka I am willing to share.
Rai LeCotey – Eureka Station Manager
REPLY: Thanks, what about the day before, with 19.6? I’ll drop you a note for the pix.
That’s hilarious. That’s like saying that surfacestations.org is strongly opposed to thermometers.
Buried in the recently released NASA emails, there is a forwarded email from Phil Jones of UEA/CRU referring to Environment Canada and the good homogeneity work that EC has been doing. The email can be found in the large part 4 of the NASA emails at page 59 or the 618 page Adobe pdf. It is dated 15/8/2007 at 10:12:05 The relevant part of the forwarded email is:-
So it seems to me very likely that Environment Canada is involved with NASA and UEA/CRU in adjustments and manipulation of real temperature data in Canadian stations used in NASA and CRU global compilations. Assuming that the temperature data freely available online in Environment Canada’s website is actually the real temperature readings, it should be simple to compare the EC data for specfic Canadian stations that are used by NASA for the same day and month to see how similar or different the data is.
It would be good if as many independent comparisons could be made by different people for various Canadain stations and dates/periods and the results posted here in WUWT.
Or during the past 12 years have you been breaking new records of wind direction? How are the wind flow studies doing?
Gail Combs (08:46:34) :
Chiefio, do you have the hourly data? can you tell if they actually drop 2 hrs worth of data each day and when it began?
Look here.
The mean temp for the 14th was 11,46 ºC based on hourly temps, standard deviation 1,66 ºC. Mean plus five s.d. is 19,8 ºC, plus six s.d. is 21,4 ºC. Not impossible, but…
Rai LeCotey (Eureka Station Manager) (14:13:51) :
I am the station manager of Eureka and was on site when we broke a new all time high on July 14, 2009 of 20.9°C and have the picture to prove it!
It good to have someone who was there! I also make lots of photos myself.
I would like to ask, to a first-hand witness them, what happens so that the max temp is 6 degs above the highest hourly record. I’m sure this has to be simple, but I can’t figure it out by myself.
RHS (08:06:32) : Especially since the lo-boy has an attachment to be towed with a forklift. I’m willing to be with the placement of the lo-boy that the gauge is affected by the occasional placement of something with hot exhaust.
So, is that a white pole with graduation on it between the low boy and the white box? Maybe a snow depth pole? Oh, for just a bit more resolution…
Also, as a quasi-military base, what’s the odds that there is a regularly scheduled ‘perimeter check’ that has someone drive around checking that everything is stowed where it belongs? It would explain the 10 to 10 schedule and the low measures at lunchtime and dinner (18:00)
So folks start working at, oh, 8 AM. First ‘patrol’ is 10:00. Long lunch. After lunch run at 2 pm. Check just before dinner at 5pm (17;00) then a nice dinner “hour” from 5 pm to 6:30 or so, post dinner check at 19:00 (7 pm) and then a gap until the “bed check” at 10pm (22:00) where the “warmth source” lingers a bit longer than usual so you get a larger “anomaly” rise. Not that folks on the ‘graveyard’ shift tend to go a bit more leisurely than most… (Did I ever mention that I LOVE to work ‘graveyard’ due to the peaceful nature and “calm” pace … )
So all it takes is that the measurement station be “near” or “downwind” from that convenient place to park the ( truck | forklift | staff car ) while sucking on that thermos of chocolate and meeting your ‘appointed rounds’…
I do find that periodicity in the record highly suspicious. I’ve made enough schedules to recognize those times as ‘frequently chosen’ times for checkin / checkup times. The old Dr. Pepper jingle was “10, 2 and 4”. Not that much different from “10, 2, and 5”. The ‘bracket dinner’ at a shift change is also common. If you have an 8 am to Midnight coverage split at 4 pm (one shift 8 am to 5 pm, the next at 3 pm to Midnight (or 4 pm to 1 am) you get the ‘last run’ of the morning guys just before dinner and the ‘first run’ of the evening shift just after dinner. Then all it takes is a ‘bed check’ symmetrically scheduled with the first morning check at 10 am / 10 pm.
So I’d put my money on the temperature station being near a convenient place to park a security truck while filling out a log book and sucking on a cup of java…
Gail Combs (08:46:34) : Chiefio, do you have the hourly data? can you tell if they actually drop 2 hrs worth of data each day and when it began?
No, I don’t. The hourly data for many countries are not available, so I’ve not dug into them. Canada does make hourly data available (I THINK!) though I don’t know if they charge (many places do charge) but I’ve focused on the bigger annual / monthly views. Maybe that needs a re-visit… Anthony is more in touch with the daily sources than I am. Being a Met guy and all means watching the daily pattern for a few weeks a frequent behaviour for weathermen, not so much for computer geeks…
I forwarded this post to Env. Canada’s contact point. See their response here:
http://fnieuwenhuis.xanga.com/725951059/eureka-data-issues/
The Sun was maybe 15 degrees above the horizon at 10 PM, so maybe the Sun came out from an otherwise overcast day to cause the warm reading?
Tim Clark (09:47:16) : At least this is the source of the anomalous heating!
http://csailor.50webs.net/eureka/pic/eureka/pic105.html
What A Hoot!
Lets see, a bunch of young guys stuck as far away from anywhere as you can get and bored beyond belief… what to do what to do..
I know, lets burn all the cardboard and shipping pallets trash on the beach and alternate between jumping into 0 C Ocean and “chestnuts roasting on an open fire” 😉
Just the thing to tell folks back home and just the thing to embarrass the newbies with. “WE all went swimming in the Arctic Ocean. Are YOU the wimp in this crop?”
FWIW, I’ve been in ‘frozen cold’ swimming three times. Once for a couple of hours in the ocean at about 40 F water temp with a wet suit. Once without the wet suit for a couple of hours but with frequent runs to the blanket (though eventually got quite hypothermic… took me about 8 hours to get ‘warm’ again.) And once when the water was about 32 F / 0 C in a mountain stream of snowmelt. I can ‘relate’ to the guys in the image. The “plunge” part is a bother, but as long as you don’t put your head underwater too long it’s not so bad for the first 20 minutes or so. (At least if you are a bit pudgy 😉
Ben Kellett (13:52:52) : Wait a minute! Isn’t this how “smoothing” works? Please tell me that massive inconsistencies such as this are identified and smoothed out of the data. Isn’t this a process that Dr Hansen has openly admitted is a crucial aspect of data presentation?
I’ve been through all the GIStemp code and while there is talk of “homogenizing” I’ve not seen “smoothing” as a topic.
Surely then the GISS map is showing us the data “post smoothing”, in which case the anomolous temp reading is meaningless. If the data has been smoothed, then these odd readings should not in themselves constitute a problem.
Unfortunately, the GIStemp process is more about extending the reach of data than about ‘smoothing’ errors out. The initial steps “warm” the data by about 0.6 C ( I ran a benchmark on it through the ‘homogenize’ step). Also, as other stations were dropped from the record, the surviving stations, such as Eureka, gain ever more importance and influence. They are the SOURCE of the data that are ‘homogenized’ in to the now missing areas. So if anything this “smoothing” is better described as “spreading”.
Finally, since the “monthly mean” is what is handed to GIStemp, the impact of anomalous daily data are already ‘baked in the cake’ of the monthlies long before GIStemp ever sees it. This means that the monthly data will already be ‘lifted’ and that the ‘lift’ will be spread far and wide as the smoothing / spreading “spreads the wealth” to all those grey areas that have no data.
But yes, I’d agree with you (and it would seem, Hansen) that this “smoothing” spreading is an essential part of the “Global Warming” process. Without it we would find that it’s still cold everywhere else…
So… read the station manager’s explanation (thankyou sir BTW for sending that) but now I have MORE questions.
1. That great big stripe in the GISS map is mostly over land. But the station manager says the temperature is governed most often by the prevailing wind coming off the sea?
2. Inland, (where the big GISS stripe is) the temps in summer are 10 to 15 degrees higher than the station…. so the areas temps in GISS are being UNDER reported?
3. When the prevailing wind changes direction, the station gets a big temp hike. Can understand that. But doesn’t that mean that cold air is coming onto land from the other side, so the temps are falling over most of the area when the weather station temps are rising?
This was actually easier to understand when I thought the numbers were just wrong. Now I think the numbers are right, the area they represent is just wrong. What kinda gate is that? Finaly-found-some-proper-data-but-its-for-the-ocean-next-door-gate is a bit long. It’s? Its? It is? Can we have an its-gate too?
Here’s a quote from Anthony Standen’s Science Is a Sacred Cow (1950):
The Eureka METAR report (Weather UnderGround) shown by Anthony for 140200Z (9PM) shows a temperature of 20C, but if it had been measured at 20.9C then some unusual rounding scheme must have been used. Of course it is possible it was still warming at observation time. There seems to be only a 10 degree shift in the wind from the previous hour with a speed increase of only 1 knot. An hour later the wind had reverted to its 01Z direction and lost that 1 knot.
Indeed, the daily summary sheet does show a max-temp of 20.9 so where did that come from? METAR stations do not, repeat DO NOT, report max or min temperatures in their observations, nor would a rise of .9C or the slight wind shift require a SPECI report.
I must be missing something.
Rai LeCotey, thanks for writing in. The Eureka station data uniquely influences a vast amount of the GISS temperature record (perhaps more than any other station on the planet). Does this mean that the entire arctic temperature anomaly is really measuring nothing more than shifts in the wind pattern on a tiny peninsula? That’s staggering.
If one were to remove individual records when the wind was blowing from the north, how would that change the anomalies? That sounds like one ‘adjustment’ that would actually make sense.
Grumbler (06:00:17) : “A man with with one watch knows the time. A man with two watches is never sure.”
I have around seven clocks that I rely on. Some use electronic chips to tell the time, others are actual computers, another is directly controlled by the mains frequency. I keep them in step using a time signal from a satellite. I provide video evidence and photos with timestamps to the police as evidence of crimes, therefore I need the times to be reasonably correct.
If only weather station thermometers were calibrated every day.
Unfortunately, our ‘official’ temperature recording site has not moved for over 50 years and thus is greatly influenced by the cold Arctic water from Slidre Fjord when the winds are from the East, South or West during the summer months.
This has probably given a big misrepresentation of how warm the Arctic is actually getting.
I would not be surprised to see temperatures up to the mid twenties or even near 30°C far inland where there are no winds. The Arctic is heating up! Wildlife come to the shoreline to cool off, Muskoxen are taking dips in the Fjord, permafrost is melting down in some areas to 10-12 ft, there is more and more open water over the Arctic ocean every year and the Ayles Ice Shelf has broken away.
How much more does one need to see before you believe the Arctic is dramatically warming up.
We’ve had a warmer than usual winter this year with a number of daily maxiums broke and I would expect another record breaking summer.
Hot in Eureka Rai
I think it is real, there were a lot of other things going on that the METARs reveal. In the days before there was quite a bit of rain in the area, and the day of (and hours preceeding) there were reports of Towering Cumulus and AltoCumulus Castellanus. Both of those cloud types say the atmosphere is unstable and usually you should be on the lookout for showers and virga (showers that evaporate before reaching the surface, also reported in the days prior). In the hours prior, there were TCUs over the mountains to the west (it looks like this place is in a valley). What it looks like to me is they got an outflow, because with that observation and after it, there are no more records of unstable cloud types through the 16th. An outflow coming down the mountainside like that would cause the air to warm rapidly. There would also be added moisture from the TCU that collapsed, and potentially from any snow that was melted on the way down. These are called Chinooks which someone referenced earlier. It looks to me like this one had a little bit of a different trigger.
Rod Smith: Many metars will carry the max and min temps for the previos 6 hours and for the previous 24 on the 6 hourly and midnight UTC observations. This station doesnt, but it wouldnt surprise me if they fill out a daily form to record absolute max and min temps, precip totals, and max wind speeds like a large number of reporting stations do. So while it wouldnt show up in the metar data, it would be on record.
One other thing I forgot…
While the main wind speed shows northerly (010), the remarks on the observations on each side of the one with 20C state the winds at the camp are still from the West (290), the direction of the mountains. The nrly winds seem to occur at the same time each day which leads me to think it is a local effect caused by the valley.
Neel: I stand corrected on min/max temperature reporting. Thank you.
I guess these things changed out from under me. The last decoders I wrote (a long time ago) didn’t need that, but I seldom look at METARS any more and I guess I’m out of date. I see it in US METAR information.
But looking at WMO docs on FM-15 Code, I don’s see it. It seems likely it is a regional variation.