UPDATE 4/23 4PM: I’ve been in contact with the Eureka Weather Station manager, and despite the incredible nature of the temperature jumps that are outside of normal experiences, such as July 14 2009, they do appear to be real. The METAR coding errors are another issue. I have many pictures now, plus a plan map, and a better meteorological insight than what can be gained from the meager online metadata. I’ll have an updated post later tonight or tomorrow – Anthony
Ecotretas find more cases of missing “M”s and mangled data in METAR reports making it into climatic temperature data. I’ve reposted his findings below and added some of my own notes [in brackets] to strengthen his findings. This time it’s Eureka, Nunavut, Canada. From “Up Here” magazine:
The first High Arctic Weather Station in history, Eureka was established in April 1947 at 80-degrees north latitude in the vicinity of two rivers, which provided fresh water to the six-man United States Army Air Force team that parachuted in. They erected Jamesway huts to shelter themselves and their equipment until August, when an icebreaker reached Eureka – as it has every year since – and brought permanent buildings and supplies. For decades after that, small, all-male crews would hunker down for entire winters, going a little stir-crazy from the isolation.

As I pointed out last Saturday there’s a common reporting flaw in world meteorological stations that use the METAR weather data format to report their hourly temperatures. Just one bad report in a cold location in the Arctic or Antarctic is enough to throw off the whole month’s worth of data when averaged. And it is monthly data that is used for climate. The all time high temperature error identified below has found it’s way into Wikipedia as “factual” when it is clearly wrong.
Some METAR and other kinds of unidentified errors also seem to be finding their way into official Environment Canada data. I’ve made screencaps. Given the importance of this weather station as the last surviving GHCN station that far north, also used in GISS, you’d think better quality control would be done, particularly when EC has a statement about data quality on each data page. What has been found seems to point to a corrupted dataset there.
– Anthony
=======================================
Eureka by Ecotretas


[Images above from GISS – click to enlarge]
Eureka, in Nunavut Canada, is a very special meteorological station. As can be seen in the first image above, it is responsible for the very big stripe on the very top of Canada. As can be seen on the second image, the data from only one station is responsible for a very big percentage of global temperatures… Both graphs can be obtained here.
So, one would imagine that data for this station is quality proof. We found two sources for temperature data: at Weather Underground and at the National Climate Data and Information Archive.
The first interesting data about this station is its record high temperature, which according to Wikipedia was reached on July 14, 2009, with 20ºC. [image below added by Anthony]

[UPDATE: Wikipedia editor removed the sentence above within 8 hours of this posting. See discussion here]
On Weather Underground, the monthly page for that day does say that 20ºC was the maximum temperature. But when you check the METAR data, the maximum temperature was 14ºC.
[Here is where it really gets strange, I’ve added two screencaps from Environment Canada, on for the monthly data, another for the daily data from July 14th, 2009. They don’t match! The 20.9C value never appears in the July 14th hourly data. Click images below to enlarge, EC’s July 2009 Monthly report on the left, July 14th, 2009 daily/hourly data on the right. Perhaps EC corrected the error in the daily/hourly data, but missed the monthly? – Anthony]


[click images above to enlarge]
[It also shows up as 20.9C on the EC yearly report for 2009, shown below]

Checking the Environment Canada page, the maximum for the date was 14.4ºC.
Things were different on the day before, July 13th. Maximum temperature for Weather Underground was also 20ºC, while at Environment Canada was 19.6ºC. But if you check the graphs below, some special heat occurred at 10PM, when temperatures soared some 15ºC!
(click images to enlarge)


[Image below added by Anthony. Here is the METAR report for Eureka, via Weather Underground, the error is highlighted in yellow, note the jump in temperature followed by a fall the next hour]

[In the image below added by Anthony, note the implausible temperature jump in the Environment Canada data for July 13th, 2009 at 22:00 where it was 5.9C at 21:00, jumping to 19.6C at 22:00, then back down to 4.1C at 23:00. Looking at the weather conditions of clear sky and moderate sustained winds from the North ~ 24 km/hr, there does not appear to be a meteorological explanation. Looking at the METAR data above, it appears the temperature was rounded up by the observer to 20C from 19.6. This makes me wonder if the event could be caused by something like a plane, truck, or snow-cat parked briefly near the sensor. In the Arctic, vehicles are left to idle, as turning them off allows them to freeze up, sometimes never to be restarted. ]

As Anthony Watts pointed out at Watts Up With That, the Eureka station registered the biggest rise in temperature probably seen on the Earth’s surface: 86ºC in one hour, on March 3, 2007! Now this data is available on Weather Underground, but seems not to exist in Environment Canada. The graph differences are clear below:


But that seems not to be the case in other examples. Take January 1st, 2007, for instance. Both Weather Underground and Environment Canada agree: there was a mighty spike at noon. Seems like the “M” problem affects both:


[Here’s the METAR data with the missing “M”, note at 11AM the M reappears]

There are times where differences are not so big, but the “M” problem is still there. Check the images from Weather Underground and Environment Canada for September 26, 2006:


Other times, changes are so significant, that something must be wrong. Check out the temperature rise on June 20, 2005. On the left, the weekly graph from Weather Underground shows a great surge in temperatures, confirmed by the Environment Canada graph for the day.


=====================================
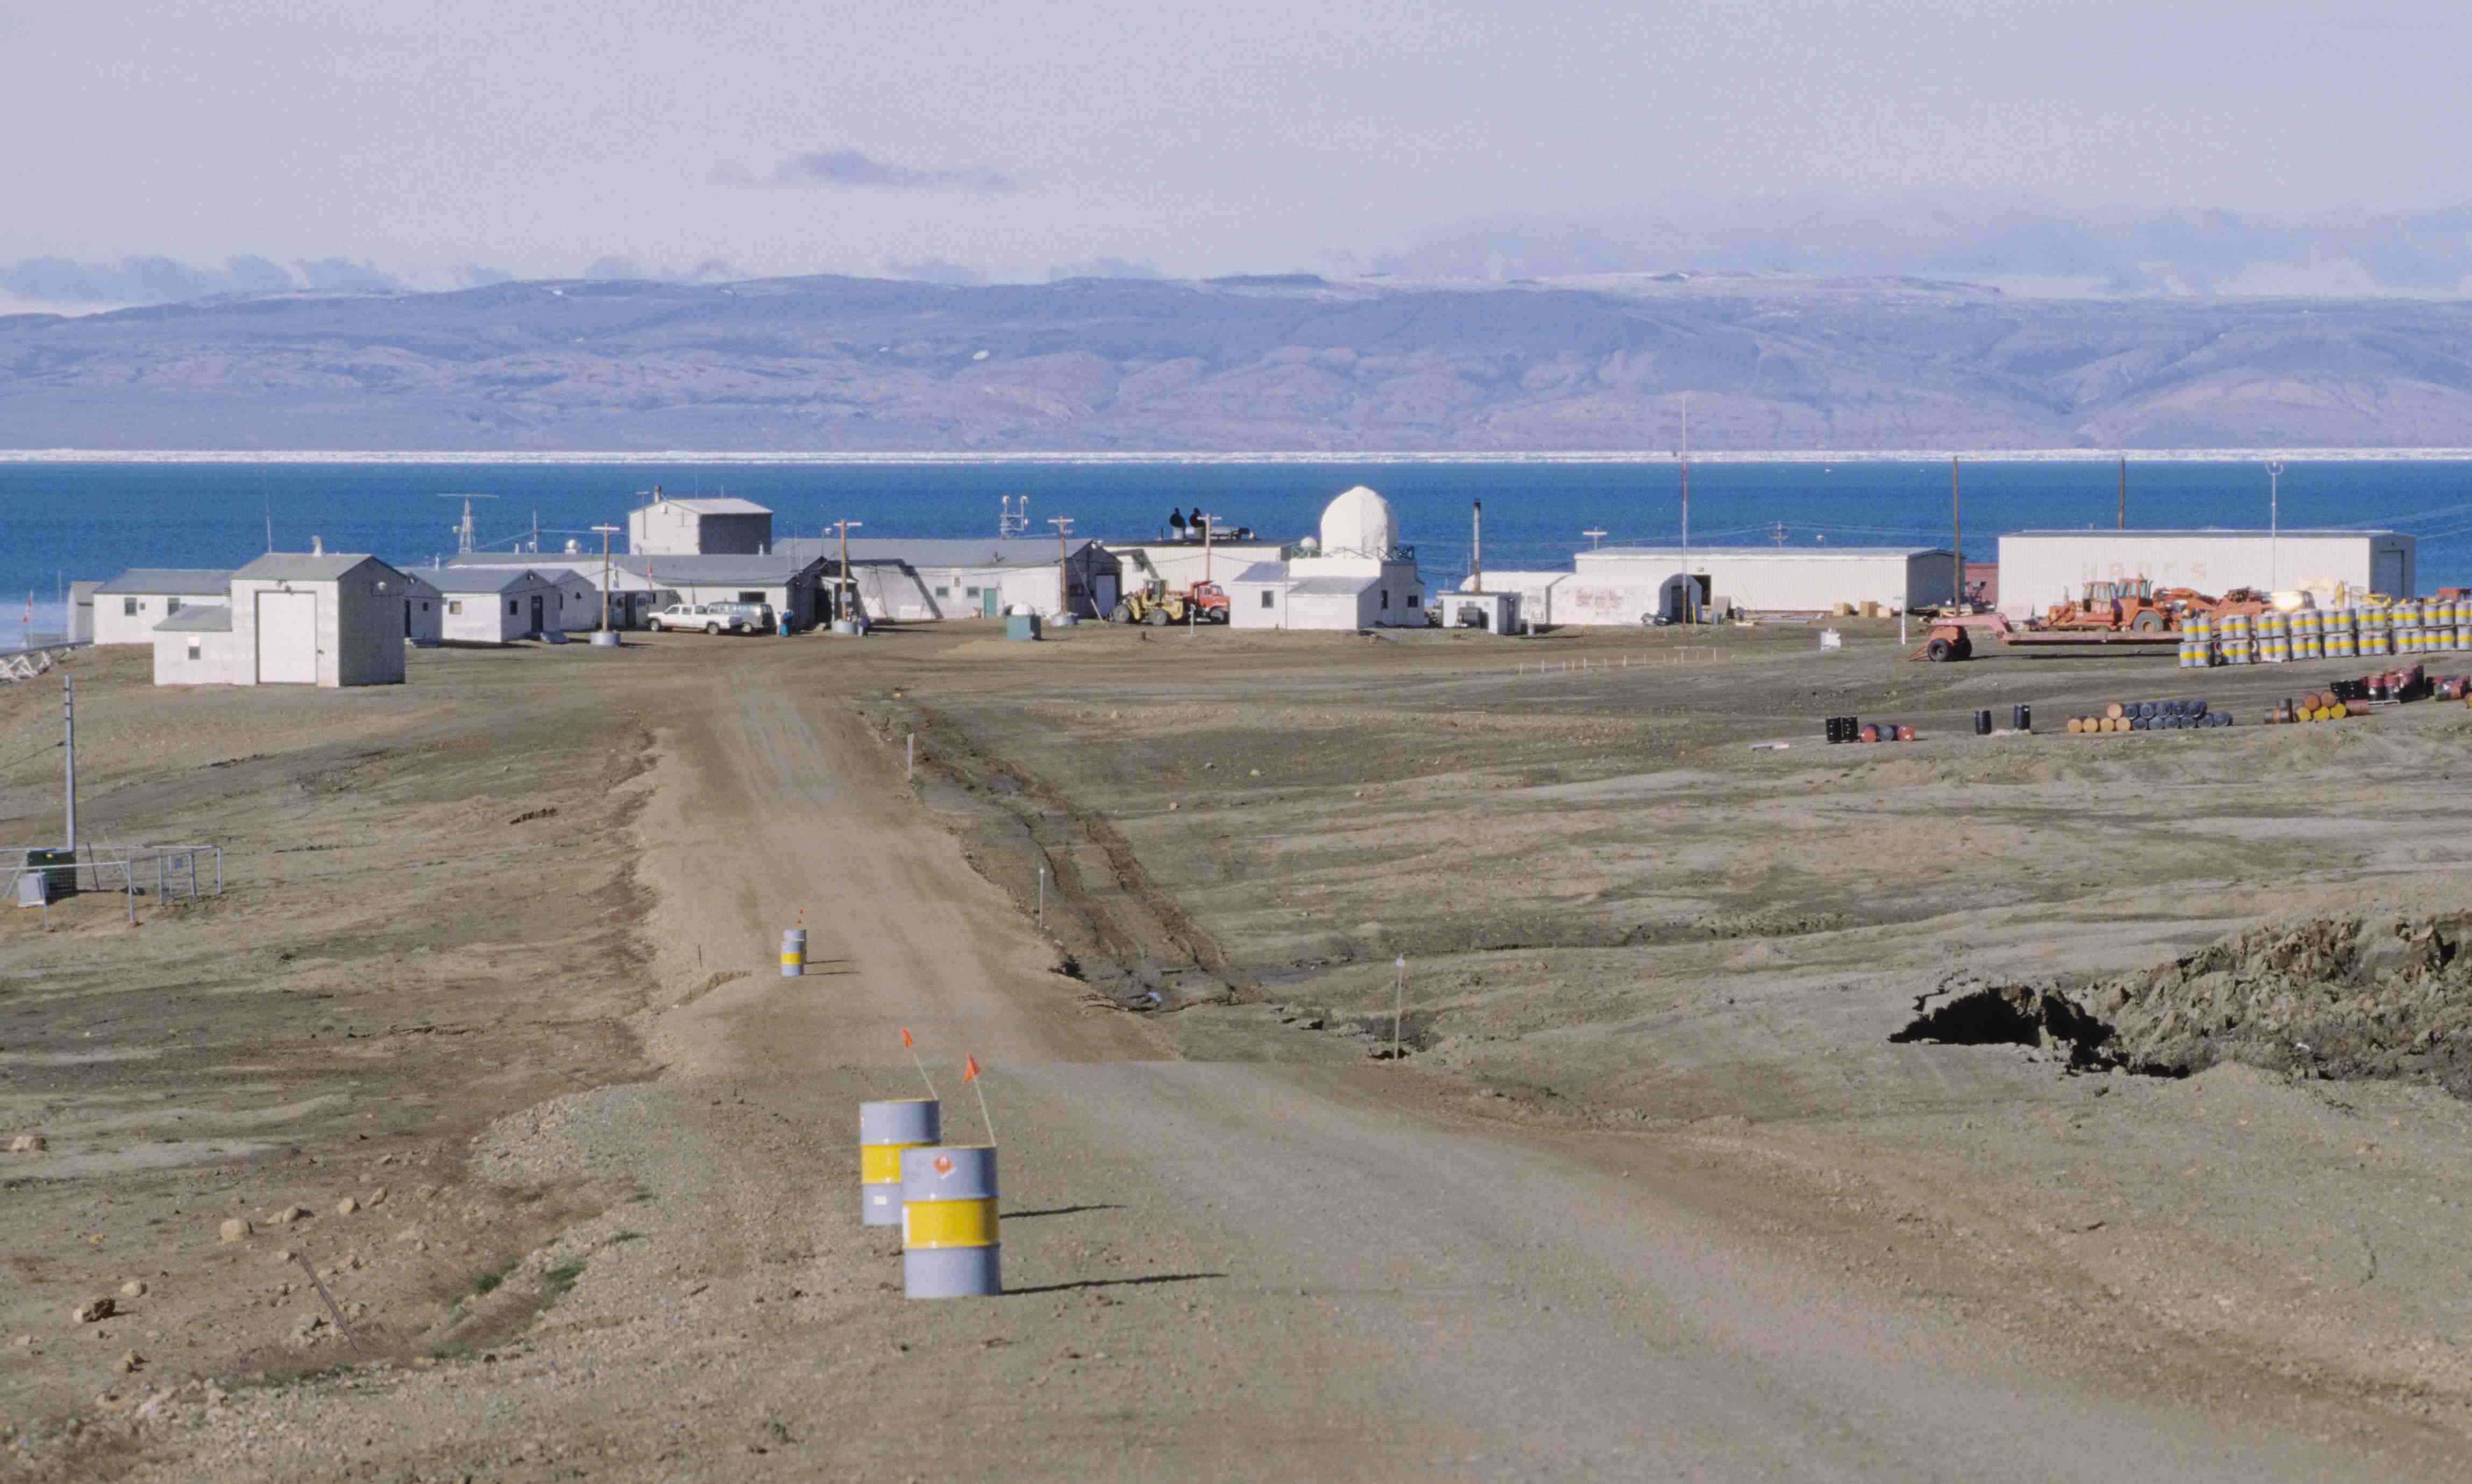
Thanks to Ecotretas for his sleuthing, I’m sure there are many more like this yet to be discovered. It seems with Eureka, more is going on than METAR errors. The temperature rises reported seem impossible given the meteorological conditions, and because they seem to be automated, suggest sensor error or perhaps sensor environment contamination (like a vehicle or other heat source). If you look at this 1997 image from Wikipedia (and click it to get the super hi-res version and pan around) you’ll see a number of vehicles near buildings. Where is the temperature sensor? – I don’t know, but if someone can find out it might shed some light on this mystery.
The fact that the obvious error on July 14th is now cited in Wikipedia as an “all time record high”, when it doesn’t appear in the EC hourly data, is troubling. – Anthony
Its a shame that there is no built in way for Wikipedia errors to be corrected.
🙁
It’s really quite depressing. These records provide the basis for the unprecedented warming and it’s obvious they are not accurate. This is what we are asked to sacrifice billions for? Surely someone is responsible for the errors and surely someone must be held to account. Is there a complaint mechanism that would alert authorities to these gross errors?
E.M. Smith: It is a standard practice in very cold climates to not let your Diesel get cold via not turning it off.
Well, I drive a diesel minivan in cold climate, and I do turn it off. But it’s got a small heater that I can program to start at a given time. It’s basically a small stove, similar to a kerosene stove used when hiking, that pre-heats the engine before you start it. On very cold days (I’ve tried it at at least -30 C) it may need up to 45 minutes before the engine starts without complaining.
(Of course the small “stove”, while using miniscule amounts of diesel compared to a running engine, still heats its environment, it will typically melt a small patch of snow below the car)
Zeke Hausfather (21:44:01) : To me at least the results appear indistinguishable:
That’s because you didn’t do the “homogenize” and “Grid / Box” steps as GIStemp does. So first take your Eureka temps and spread them 1000 km in all directions as ‘fill in’ and “homogenizing” to any stations missing data or that were discontinued after the baseline. THEN take those and spread them another 1200 km into “empty” grid boxes. I make that about 2200 km RADIUS of influence. That’s how GISS does it. And that’s why the GISS graph has a small box for Eureka (the first image up top with a mostly grey arctic Canada) but then the whole thing turns blood red when you smear the data around ala GIStemp.
Look, if you’re going to play ‘climate scientist’ you really must learn all the tricks of the trade. Try reading Hansen’s papers for starters. “The Reference Station Method” and “Optimal Interpolation” would be good search terms to start with. For advanced study, read the GIStemp source code. I know where you can read it on line…
So, go back to your map, and draw a 1200 km radius circle around Eureka. That is the MINIUM area it will directly be used to fabricate the Grid Box anomaly. Now draw a 1000 km radius circle. Any OLD stations in that radius will be homogenized with Eureka (now, we don’t know how many or how much). Then put a 1200 km radius around each of THEM. That’s the ultimate “reach” of the data. Well, maybe not the ultimate ultimate… I did leave out one additional ‘reach’ step… After the 1000 km ‘homogenize’ there is an added 1000 km ‘UHI’ adjust. To the extent it’s ‘backwards’ you could get bogus warming from it. Not that that ever happens. Well, not more than 1/2 the time…. then after the UHI ‘correction’ it goes to the Grid/ Box step. So in theory you could chain this out to 3600 km radius. But I’m sure that rarely happens. After all, you would need to have nearly no other stations nearby, since the code uses the closest stations first. And I’m sure there must be dozens of stations ‘up there’… What, only one you say? Who knew?…
So just remember, this is ‘climate science’. You can’t expect to apply simple mathematics to it and find the warming influence. So your ‘toy world’ experiment was doomed from the beginning.
Anthony
Does CLIMAT reports are made from SYNOP reports or doesn’t?
James Sexton (21:58:31) : someone give me a yes or no!!!! IS that the one that is making the arctic so hot??
Yes.
sky (16:29:46) :
The temperature spikes at Eureka are obviously exhaust from UFOs that visit the station! 🙂
Don’t be silly, everyone knows UFOs use “cold” fusion.
With respect to this:
http://wattsupwiththat.files.wordpress.com/2010/04/ec_eureka_daily_071309.png
There are anomalies not spoken of as well.
Do take note that at the following times there are thermal deviations which ~seem~ outside the norm of what is happening otherwise:
[1] 1000 hrs = 13.0º
[2] 1400 hrs = 11.3º
[3] 1700 hrs = 13.7º
[4] 1900 hrs = 11.2º
[5] 2200 hrs = 19.6º
In the cases mentioned above:
[1] is bracketed by 6.9º and 7.4º = .5º
[2] is bracketed by 8.8º and 9.4º = .6º
[3] is bracketed by 9.5º and 7.2º = 2.3º
[4] is bracketed by 7.2º and 9.5º = 2.3º
[5] is bracketed by 5.9º and 4.1º = 1.8º
I call those into question because it seems rather odd to have such wide deviations in the former (above) when the latter seem to be following a norm trend.
Where I live here in Washington, those differences don’t exist on even the ‘weirdest’ days.
The bracketing temperatures seem more ‘normal’ in the sense that they are closer together, as opposed to the ‘peaky’ temps they bracket.
Before making too many assumptions did you read this: http://www.climate.weatheroffice.gc.ca/climateData/dataQuality_e.html
Isn’t this where someone is supposed to say ‘EUREKA!’?
http://www.sailwx.info/shiptrack/shipposition.phtml?call=25593
Average -30,7438
Total corrected -40,7688
Min -41.1
Max 41.1
Zeke Hausfather (21:44:01) :
Trend 1960-2009 (Degrees C per decade)
GHCN land: 0.20243
GHCN land sans Eureka: 0.20235
REPLY: Actually I did not mention that, Ecotretas did, but let’s not make a too much out of your mistakes. The issue of most interest is not GHCN as a whole, bit the fact the Eureka data gets interpolated into nearby grid boxes. Nice try at diluting the issue though. – A
I don’t think it is to stress too much either. Yet, a few errors in a single station reflects into calculations, “heating” the result at the tens of thousandth in the trend. Now, we know the M error occurs in many stations. We also know that thousands of stations were removed.
But assessing this hypothesis is an entire workload.
My ‘other half’ does a lot of data entry. When she saw the following graph she stated that this is quite obviously a data entry error. That is, someone typed it in wrong.
http://2.bp.blogspot.com/_iCyUsWAeuro/S89rXYT3NoI/AAAAAAAABLs/mx9X6cNFK4E/s1600/env20070101.png
‘jaymam (18:57:27) :
Why aren’t there two or more thermometers at every weather station, separated by say 100 metres? ….’
A man with with one watch knows the time. A man with two watches is never sure.
cheers David
http://www.tutiempo.net/en/Climate/Eureka/07-2009/719170.htm
Working with a lot of data sets produced by a controlled system, containing thousands or tens of thousands of data points around a setpoint, There will always be the chance of another maximum or minimum generated on the next data point measured.
Maxima and minima, in isolation, tell us very little about the system being measured.
Why is station data quality getting seemingly WORSE? This is 2010 for crying out loud…
And speaking of Canada…
It seems journalists and researchers just can’t resist the urge to tag “…and is likely made worse by global warming” onto everything they investigate/publish. Nothing whatsoever to back it up, as we’re all too well aware.
Killer fungus:
http://www.alertnet.org/thenews/newsdesk/N22129903.htm
JimB
…and now researchers, continuing The Narrative – facts notwithstanding, have determined that the deadly fungus originating from Vancouver Island may be helped to spread by global warming:
http://www.alertnet.org/thenews/newsdesk/N22129903.htm
Apparently, this is not a fungi to hang out with.
Hi friends
If I may indulge in an OT.
I need some help. Sometime ago I seem to remember reading something about Nature mag not wanting to publish sceptical papers because the science was settled?
Anyone remember? If so, please point me in the right direction.
thankyou in advance
I haven’t read the above comments, so excuse me if this is a repeat.
Looking at the table Anthony prefaces with this;
[In the image below added by Anthony, note the implausible temperature jump in the Environment Canada data for July 13th, 2009 at 22:00 where it was 5.9C at 21:00, jumping to 19.6C at 22:00, then back down to 4.1C at 23:00.
you will notice the are also smaller but probably significant spikes at 10, 14, 17, and 19 hundred hours. All of these spikes and including Anthonys, are highly associated with a corresponding decline in humidity. I understand the relationship between humidity, temperature, and thermal energy, just an observation I thought was interesting.
maggieblanco (19:32:23) :
Lance . . . did you ever work the DEW Line ?
No, but one of the guys up there with us had done a stint on the DEW. Can’t recall his name though. We were both on courses at the training centers for Environment Canada in Ottawa and Scarbourgh (the last ones before they moved it all to Cornwall Ont.)
looked at some photos and some new buildings there now, but lots of the old stuff, the Upper Air Building and H2 building haven’t moved as with the quaters for sleeping etc., but I would image quite a bit else has changed. The Metar didn’t exist when i was up there, and appears to be away from the main station further down Slider Fjiord(west). It had a better Satillite link from that direction (all experimental back then, but i image its much better now).
The relative humidity is a derived number
If on 13 july the temperature is set to 9.6 insted of 19.6 then the RH is 76 which is more inline. RH of 40 is bone dry.
Check this handy calculator (make sure to select Celsius!!):
http://einstein.atmos.colostate.edu/~mcnoldy/Humidity.html
Has anyone done a 2 axis drive through of Eureka to get a UHI correction yet? Based on what I can see in the last picture, the place seems to have significantly changed since it was originally established by a few guys with pup tents and rifles and an M1A1 Met Kit. Why I’ll bet that by now they even have a water heater set up for their Saturday night showers. And if they have helicopter or Cub Piper delivery of 16mm movies once a week, that would screw the readings too.
What troubles me the most is peoples’ tendency to trust all things in technology, without the consideration that human error frequently renders the data erroneous.
This can so very easily be minimized by the encoding of ‘parameters’ which can produce error messages or ‘flags’ for follow up!
As a person who was fortunate enough to have participated in and supervised the conversion of thousands of spreadsheet financial applications over to computer assisted recording (in the early 80’s)-it became immediately obvious that these parameters needed to be established. Further, I assure you that my team of programmers had no trouble adding the coding necessary to accomplish the task. This is not brain surgery and even if it were-brain surgery is almost routine these days…
Parameters people, paramaters.