UPDATE 4/23 4PM: I’ve been in contact with the Eureka Weather Station manager, and despite the incredible nature of the temperature jumps that are outside of normal experiences, such as July 14 2009, they do appear to be real. The METAR coding errors are another issue. I have many pictures now, plus a plan map, and a better meteorological insight than what can be gained from the meager online metadata. I’ll have an updated post later tonight or tomorrow – Anthony
Ecotretas find more cases of missing “M”s and mangled data in METAR reports making it into climatic temperature data. I’ve reposted his findings below and added some of my own notes [in brackets] to strengthen his findings. This time it’s Eureka, Nunavut, Canada. From “Up Here” magazine:
The first High Arctic Weather Station in history, Eureka was established in April 1947 at 80-degrees north latitude in the vicinity of two rivers, which provided fresh water to the six-man United States Army Air Force team that parachuted in. They erected Jamesway huts to shelter themselves and their equipment until August, when an icebreaker reached Eureka – as it has every year since – and brought permanent buildings and supplies. For decades after that, small, all-male crews would hunker down for entire winters, going a little stir-crazy from the isolation.

As I pointed out last Saturday there’s a common reporting flaw in world meteorological stations that use the METAR weather data format to report their hourly temperatures. Just one bad report in a cold location in the Arctic or Antarctic is enough to throw off the whole month’s worth of data when averaged. And it is monthly data that is used for climate. The all time high temperature error identified below has found it’s way into Wikipedia as “factual” when it is clearly wrong.
Some METAR and other kinds of unidentified errors also seem to be finding their way into official Environment Canada data. I’ve made screencaps. Given the importance of this weather station as the last surviving GHCN station that far north, also used in GISS, you’d think better quality control would be done, particularly when EC has a statement about data quality on each data page. What has been found seems to point to a corrupted dataset there.
– Anthony
=======================================
Eureka by Ecotretas


[Images above from GISS – click to enlarge]
Eureka, in Nunavut Canada, is a very special meteorological station. As can be seen in the first image above, it is responsible for the very big stripe on the very top of Canada. As can be seen on the second image, the data from only one station is responsible for a very big percentage of global temperatures… Both graphs can be obtained here.
So, one would imagine that data for this station is quality proof. We found two sources for temperature data: at Weather Underground and at the National Climate Data and Information Archive.
The first interesting data about this station is its record high temperature, which according to Wikipedia was reached on July 14, 2009, with 20ºC. [image below added by Anthony]

[UPDATE: Wikipedia editor removed the sentence above within 8 hours of this posting. See discussion here]
On Weather Underground, the monthly page for that day does say that 20ºC was the maximum temperature. But when you check the METAR data, the maximum temperature was 14ºC.
[Here is where it really gets strange, I’ve added two screencaps from Environment Canada, on for the monthly data, another for the daily data from July 14th, 2009. They don’t match! The 20.9C value never appears in the July 14th hourly data. Click images below to enlarge, EC’s July 2009 Monthly report on the left, July 14th, 2009 daily/hourly data on the right. Perhaps EC corrected the error in the daily/hourly data, but missed the monthly? – Anthony]


[click images above to enlarge]
[It also shows up as 20.9C on the EC yearly report for 2009, shown below]

Checking the Environment Canada page, the maximum for the date was 14.4ºC.
Things were different on the day before, July 13th. Maximum temperature for Weather Underground was also 20ºC, while at Environment Canada was 19.6ºC. But if you check the graphs below, some special heat occurred at 10PM, when temperatures soared some 15ºC!
(click images to enlarge)


[Image below added by Anthony. Here is the METAR report for Eureka, via Weather Underground, the error is highlighted in yellow, note the jump in temperature followed by a fall the next hour]

[In the image below added by Anthony, note the implausible temperature jump in the Environment Canada data for July 13th, 2009 at 22:00 where it was 5.9C at 21:00, jumping to 19.6C at 22:00, then back down to 4.1C at 23:00. Looking at the weather conditions of clear sky and moderate sustained winds from the North ~ 24 km/hr, there does not appear to be a meteorological explanation. Looking at the METAR data above, it appears the temperature was rounded up by the observer to 20C from 19.6. This makes me wonder if the event could be caused by something like a plane, truck, or snow-cat parked briefly near the sensor. In the Arctic, vehicles are left to idle, as turning them off allows them to freeze up, sometimes never to be restarted. ]

As Anthony Watts pointed out at Watts Up With That, the Eureka station registered the biggest rise in temperature probably seen on the Earth’s surface: 86ºC in one hour, on March 3, 2007! Now this data is available on Weather Underground, but seems not to exist in Environment Canada. The graph differences are clear below:


But that seems not to be the case in other examples. Take January 1st, 2007, for instance. Both Weather Underground and Environment Canada agree: there was a mighty spike at noon. Seems like the “M” problem affects both:


[Here’s the METAR data with the missing “M”, note at 11AM the M reappears]

There are times where differences are not so big, but the “M” problem is still there. Check the images from Weather Underground and Environment Canada for September 26, 2006:


Other times, changes are so significant, that something must be wrong. Check out the temperature rise on June 20, 2005. On the left, the weekly graph from Weather Underground shows a great surge in temperatures, confirmed by the Environment Canada graph for the day.


=====================================
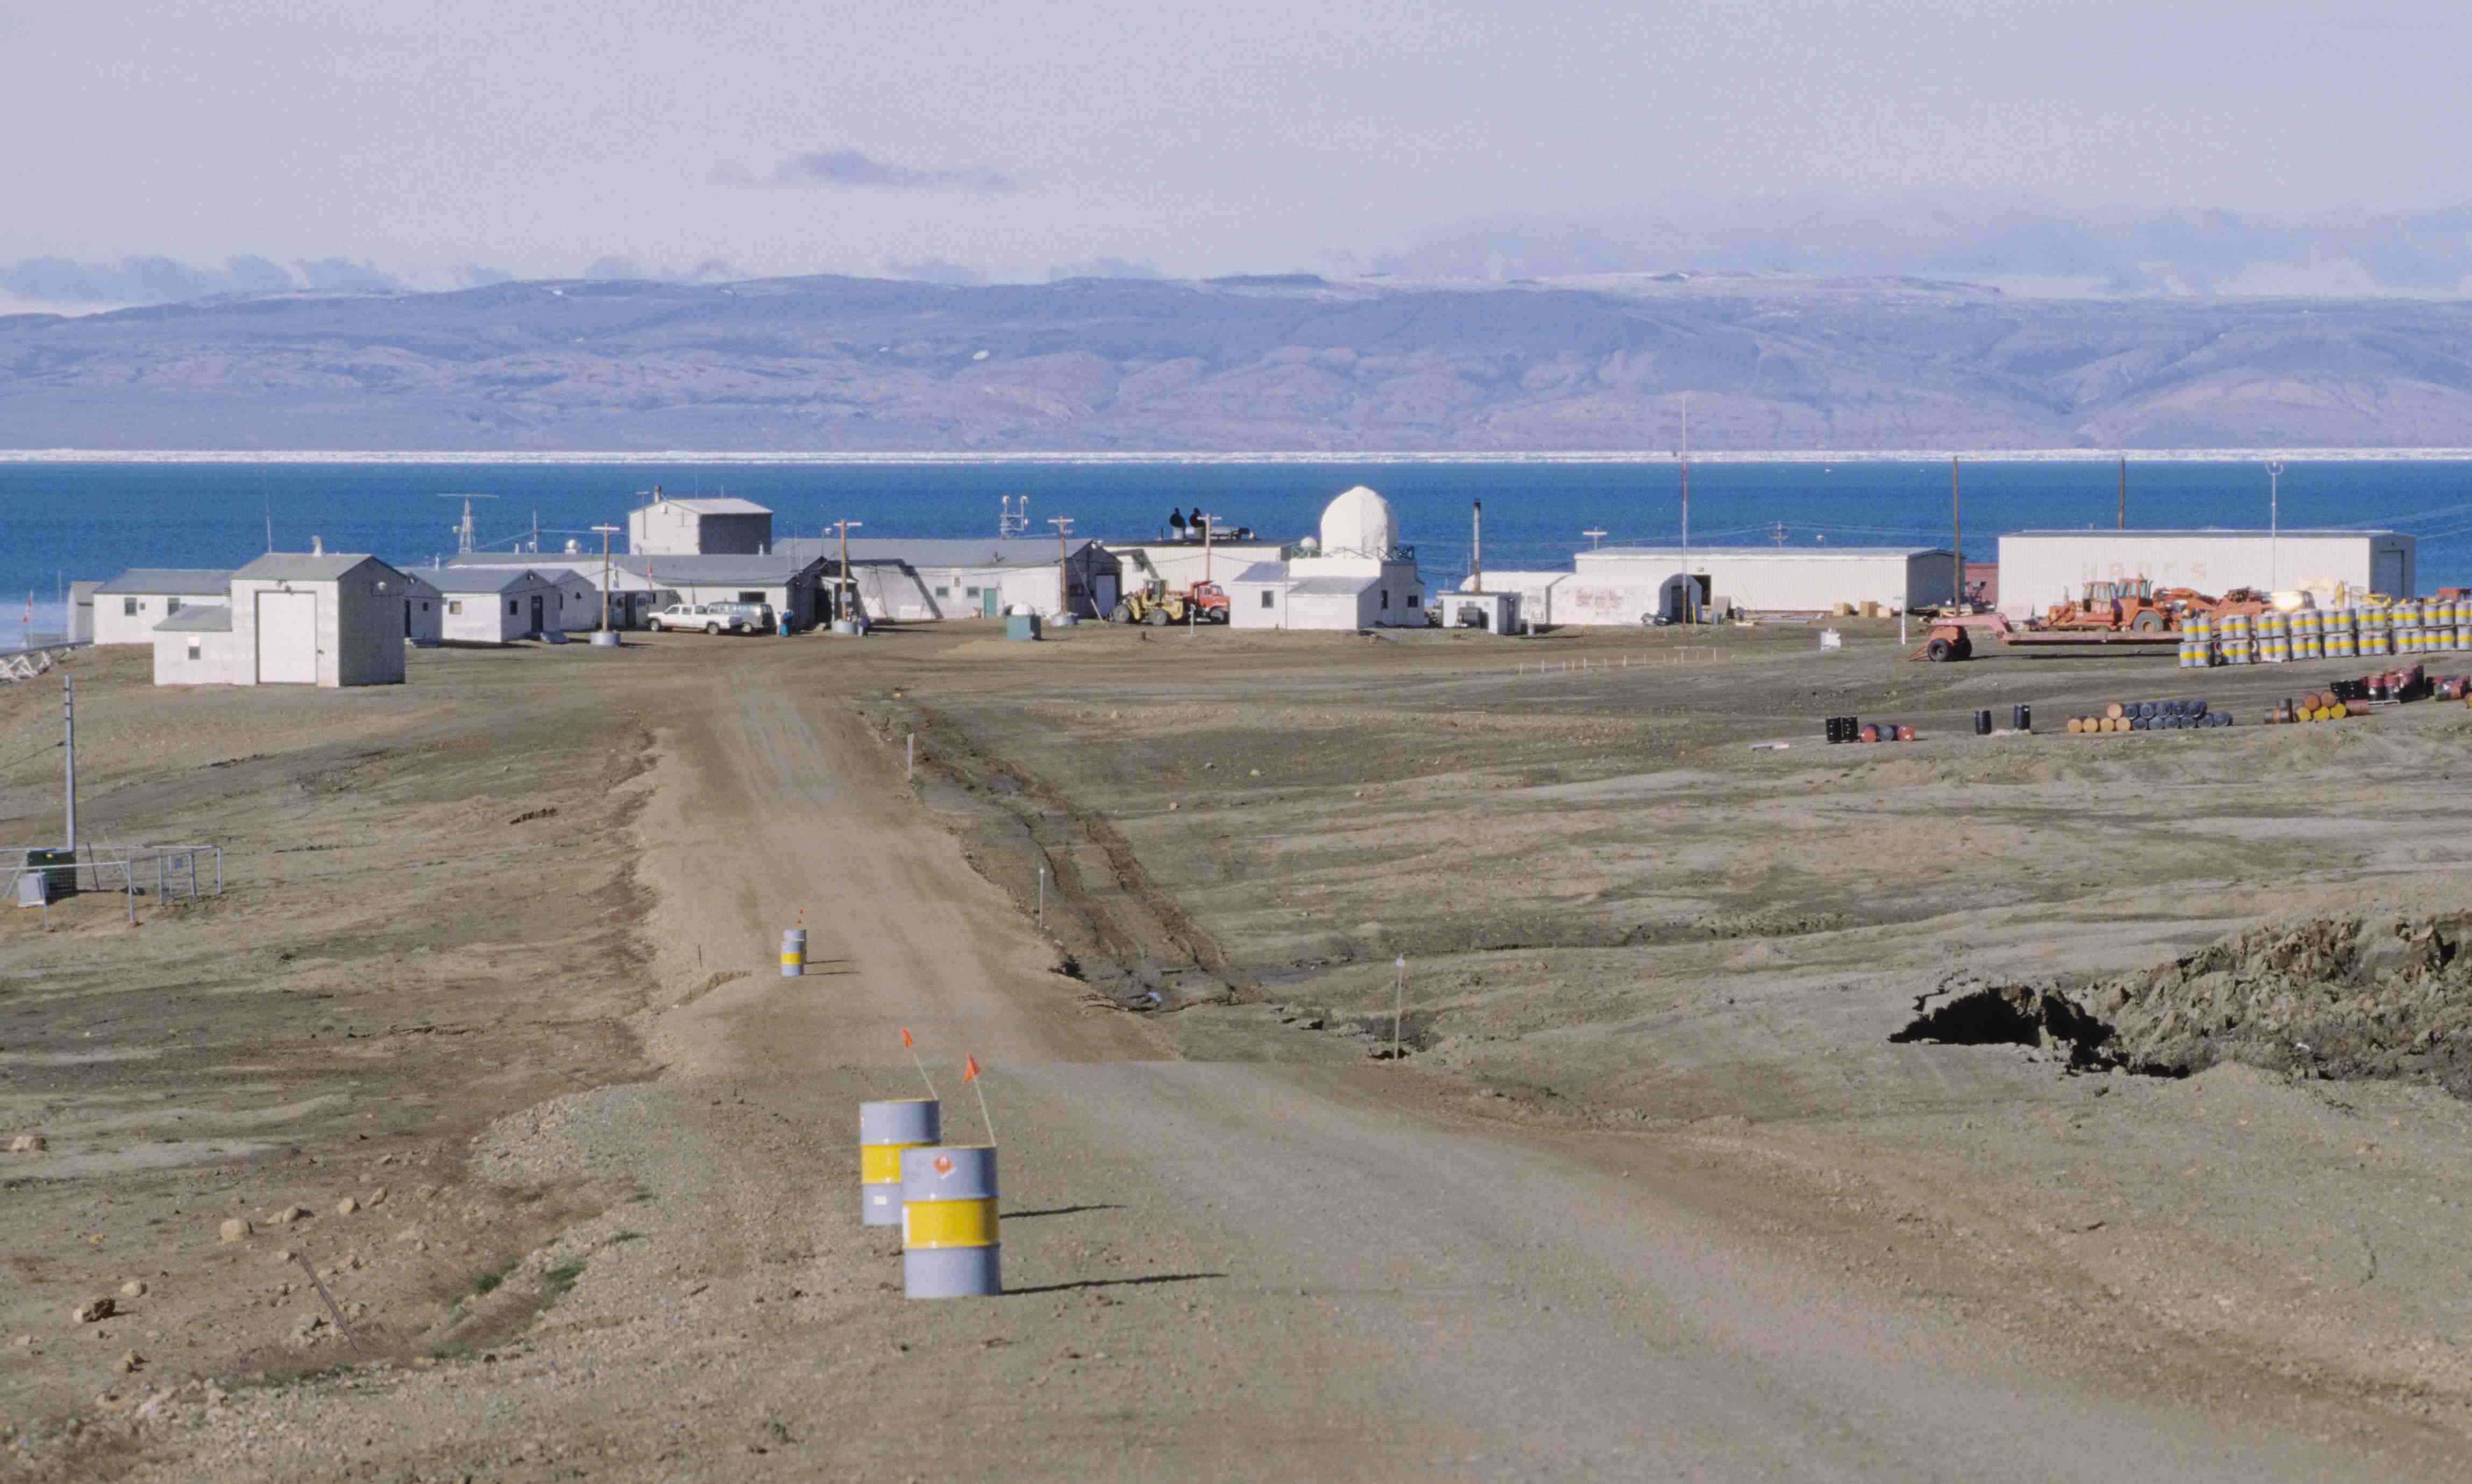
Thanks to Ecotretas for his sleuthing, I’m sure there are many more like this yet to be discovered. It seems with Eureka, more is going on than METAR errors. The temperature rises reported seem impossible given the meteorological conditions, and because they seem to be automated, suggest sensor error or perhaps sensor environment contamination (like a vehicle or other heat source). If you look at this 1997 image from Wikipedia (and click it to get the super hi-res version and pan around) you’ll see a number of vehicles near buildings. Where is the temperature sensor? – I don’t know, but if someone can find out it might shed some light on this mystery.
The fact that the obvious error on July 14th is now cited in Wikipedia as an “all time record high”, when it doesn’t appear in the EC hourly data, is troubling. – Anthony
davidmhoffer, To my knowledge it is all Canadians there, until the spring summer season, NASA people were there but were very secret about what they were doing, other than testing a rover prototype is all I know. But they have all kinds of instruments there other than thermometers as you say. they do ice cores, weather balloons they send up with different instruments twice a day, A station specifically setup for the Ozone layer to measure the upper atmosphere, other stations we weren’t in the need to know about????? They have internet, satellite TV, radio and Telephone there too, although the Satellite link for TV is on the very edge of the horizon and is choppy at times, but they have it, so stop talking like they are from the dark ages, you are assuming things and making an ass of your self.
This is so very typical of USA science now.
freespeech;
we need to be aware that if a document appears to be written by an Appalachian banjo player it may affect its impact>>
The opposite in fact. You have neatly summed up one of the biggest issues of the climate debate. Reams of data, documented, cross referenced, and presented in mind numbing detail, accompanied by sparkling graphs, are turning out to be fabricated or fraudulent or deliberately misrepresented. Their credibility lies not in their content, facts, or logic, but is in fact reliant upon the assumption that the professional presentation confers on it an aura of quality, that graphs produced by the most complex of computer programs must be taken at face value. As a grad student once told me, when you don’t know what you are doing, do it very neatly and in great detail, chances are no one will notice.
The its versus it’s thing is really getting old. If it was important enough we would have a vote on it and spelling them both as “its” would win by a landslide. Language changes with time as conventions that don’t substantively change the intepretation of the words get dropped in favour of the simplist solution.
Read some Chaucer some time and be thankful that the pronunciation of the words evolved to something easier. As it happens, I know an Appalachian banjo maker which is different from a player, but he is quite skilled. I;m not certain which version he uses, when I ask he just says “izza banjo, you buy or not.”
Maybe Ecotreas has found the famous tipping point, which the warmers are so afraid of? Yes we can!
Someone who has been there;
That rant had SO much good material in it crying out for a clever response. I sense however that you are genuine in having taken umbrage with my representsation of the conditions, and see this as a direct insult to the integrity, capabilities, and ethics of the people who work there. I measnt no harm, I was just illustrating in a a humerous way some of the many factors that could have lead to wrong readings. I am sending a care package with three cokes. One for you, one for your budy and one for the polar bear.
And I will have you know that I have NOT made an ass of myself. I was born this way. The proper term is disability. although I do take considerable time to amplify it when possible.
davidmhoffer .. VERY funny. Thanks.
Anthony. WOW! Outstanding digging. Thank you.
I’ll ask the EC minister to tell me what the temps REALLY were. He will respond. He plays the political AGW game, but knows the truth and is playing the cards reasonably well up here.
Clive
How about a farting polar bear ?
Apparently, they have removed the ‘high temp’ description from WIKI. That sentence has been dissappeared.
So the data clearly have problems.
What is less discussed I think is how flawed the method seems to be. As I understand it, the algorithm takes the max/min temperature and averages it for a given day. Anyone spending some time at data analysis realizes that any method that relies heavily on extremes almost always becomes a error finding method. Don’t you think a data error is more likely than not to be either a max or a min?
The M issue is very interesting because it is a data error that is both likely to affect the min/max calculation (as are most errors), but also has a strong warming bias. Having said that, I think the headline should be dial M for Mangled Method.
James
davidmhoffer, you are sending a care package with three cokes. One for you, one for your budy and one for the polar bear? I hope there is rum with that? HAHAHA. And besides I knew the people there for about 3 months a few years back, it’s not like they are my best friends or something., let me get that straight. But I have been there and from what I saw was plausible to what is reported here. In face the place is probably an environmental nightmare from what I’ve seen, and personnel there were over tasked with jobs they are not qualified for when I was there. And why was there no mention of the Alert weather station, the most northerly weather station, and well that is a military station to begin with anyway but Environment Canada has a weather station there too. I know I’ve been there as well????????
hourly data for july 13 on wunderground
http://www.wunderground.com/history/station/71917/2009/7/13/DailyHistory.html?theprefset=SHOWMETAR&theprefvalue=1
see peak at 9 pm:
METAR CWEU 140100Z 01014KT 40SM FEW070 FEW110 FEW240 06/01 A3019 RMK ACC1AC1CI0 CAMP WND 290/08 KTS SLP223
METAR CWEU 140200Z 02013KT 40SM FEW070 FEW240 20/06 A3019 RMK AC1CI0 SLP223
METAR CWEU 140300Z 01013KT 40SM FEW080 FEW240 04/00 A3019 RMK AC1CI0 CAMP WND 290/13 KTS LAST OBS/NEXT AT 140600Z SLP226
Error is not visible in the corrected weekly plot (july 13 is monday)
http://www.wunderground.com/history/station/71917/2009/7/13/WeeklyHistory.html
REPLY: See the January 1st, 2007 example with a missing M. Yes not all cases have missing M’s but we also have what appears to be meteorologically impossible values in the METAR reports. I can’t tell you if this is a manual coding error, an instrument error, or a local heat bias. More investigation is needed. Clearly there are data problems of all kinds here -A
Anthony, this is where your experience with real measurement wins completely over theoretical academics with very little practical experience. You have a sense for how “trustworthy” the data can be. How easily figures can be mis-recorded and like me that gives you a rule of thumb for how small a variation is meaningful and how much a whole range of measurements can be biased.
So, it is only a matter of time before the academics in their ivory tower will finally have to admit that the basic they relied on wasn’t up to scratch. And then guess who they’ll blame? Yes! The people like you and me who were all along telling them the data wasn’t fit for the purpose they were using it for!
The quality of the posts here are truly excellent. I enjoyed the well written ad- hominen discussion by IAMDIGITAP, an excellent history of the human bias factors very intelligently presented.
If I may be so bold to add:
Let’s face it, the major cause of this entire AGW hoax was such a behavioral issue in the first place. We should expect matter of factly, without being judgmental about it, that research grants, like laboratory food pellets will change people’s behavior in undesirable ways. We all like to think that we ourselves would never be scientifically dishonest. George C Scott said, as he portrayed the conniving swindler, the”Flim Flam Man”, in the movie of the same name, when asked if everyone had avarice in them, – “Every thermometer’s gotta register something”. How coincidentally apropos to this discussion don’t you think?
And in this particular instance, let’s face it, another warming report coincidently in favour of AGW. At the very least we have the writer getting his little food pellet for the article he wrote, probably from his editor, publisher and incoming emails. “We broke the news and you heard it first here – blah blah, good work son” and all that. Long live B F Skinner and his lab rats. So competent researchers should expect these errors as normal and work to eliminate them.
The best plan in overcoming this that I can see is right here with websites such as this combined with freedom of information. It’s the naked raw numbers which contain the truth. I would object to computer algorithms doing anything more than to searching for and identifying suspicious data. I would rather have someone pointing them out, as is done here so we all can see. We’ve all had enough of secret data bases from Phil Jones and the tree ring boys.
PS: If I recall correctly, the Flim Flam man had a very exalted degree, an “MBS CS DD”, ie, Master of Back Stabbing, Cork Screwing and Dirty Dealing. Sort of rolls of the tongue doesn’t it. And if I just happen to park my snowmobile a little too close to that sensor, well, whose going to know anyway. And the funding committee – “wow, record high temperatures eh, it’s a good thing we’re funding these people”. Send them more money!
Pamela Gray (19:26:34)
“I can’t think of a [ ]-gate term that is clever. We seem to be out of clever [ ]-gate terminology. And that speaks volumes.”
Easy – Eurekagate. The day the World realised that temperature data quality is not fit for purpose, as anomalies are within the error-bars of normal (whatever that may mean)!
Looking at this data today makes it imperative that all the weather data be scrutinized carefully to look for errors. The simplest way to do this would be for people to audit the data in their local area and, of course, such important stations like Eureka. When I started looking at my local area, (there are 18 weather stations in and around Kamloops), I ran into a very frustrating problem when trying to download data from the http://www.climate.weatheroffice.ec.gc.ca/climateData/ site. I could download a few csv files and then my web browser would appear to hang. I suspect this is deliberate to prevent people from downloading too much data as it occurred in multiple web browsers run from different IP addresses.
To get around this problem I wrote a quick and dirty (very dirty) program to generate the query strings for any Canadian station and date range and found I could quickly download large amounts of data. The initial version of the program just downloaded daily readings. After Anthony pointed out the major error in the Eureka station today the importance of looking at hourly readings became apparent. I added the ability to download hourly temperature readings tonight and will make it available for download on my webserver if there is sufficient interest.
The only thing I ask is that no-one comments about the quality of the code as it was thrown together in a few hours of programming and it works. It’s written in VB6 and is relatively slow as it does byte by byte transfers because I had some test code for the internet transfer control which worked and I wanted the temperature data, not an elegant program. I have it running right now and it’s taken about 20 minutes to download 400 months of hourly temperature data from station 1750 (Eureka).
One of the reasons I haven’t posted the code right now is because I don’t want to lose the ability to grab large amounts of temperature data which might happen if everybody starts downloading every Canadian weather station. Maybe someone with enough bandwidth could host this data in a less irritating form?
The quality of the posts here are truly excellent. I enjoyed the well written ad- hominen discussion by IAMDIGITAP, an excellent history of the human bias factors very intelligently presented.
If I may be so bold to add:
Let’s face it, the major cause of this entire AGW hoax was such a behavioral issue in the first place. We should expect matter of factly, without being judgmental about it, that research grants, like laboratory food pellets will change people’s behavior in undesirable ways. We all like to think that we ourselves would never be scientifically dishonest. George C Scott said, as he portrayed the conniving swindler, the”Flim Flam Man”, in the movie of the same name, when asked if everyone had avarice in them, – “Every thermometer’s gotta register something”. How coincidentally apropos to this discussion don’t you think?
And in this particular instance, let’s face it, another warming report coincidentally in favor of AGW. At the very least we have the writer getting his little food pellet for the article he wrote, probably from his editor, publisher and incoming emails. “We broke the news and you heard it first here – blah blah, good work son” and all that. Long live B F Skinner and his lab rats.
The best plan in overcoming this that I can see is right here with websites such as this combined with freedom of information. It’s the naked raw numbers which contain the truth. I’m a little suspicious of unpublished computer programs altering data. We’ve all had enough of obscure or secret data bases from Phil Jones and the tree ring boys who are apparently forced to walk on foot carrying chainsaws and aren’t even paid for their work.
PS: If I recall correctly, the Flim Flam man had a very exalted degree, an “MBS CS DD – Master of Back Stabbing, Cork Screwing and Dirty Dealing”. Sort of rolls off the tongue doesn’t it? And if I just happen to park my snowmobile a little too close to that sensor, well, who’s going to know anyway. And the funding committee – “wow, record high temperatures eh, it’s a good thing we’re funding these people”. And buy those poor tree ring people carrying those chainsaws a vehicle. Send everybody more money!
Sorry for the first posting. I think I posted by mistake while editing. Remove and or ignore the first if you wish.
roy
I’m usually tolerant of those who make mistakes; both in the use of language and use of data, unless they start to call others idiots. Mistakes happen. When people call into question the intelligence of those who disagree with them, they,themselves, damn well better be perfect.
AlGore, Mann, and the rest of the Mutual Admiration Society obviously are not.
JT (16:08:30) : I believe there are statistical methods which could be used on the entire temperature record from eureka which would identify outliers like the readings in question on this post. I don’t have the skills myself but I wonder whether the various algorithms used by the likes of GISS identify and discard such anomalies?
GISS in GIStemp doesn’t really do any “QA”. It does drop any record shorter than 20 years. It does “homogenize” things so data gets smeared around. But it generally presumes the data as received from NOAA / NCDC is “pristine”.
NOAA / NCDC do have QA processes, but a different set is applied to the USHCN than is applied to the GHCN. (And COOP stations get a different variation from what I’ve seen so far…). Exactly what “QA” has been applied to any given bit of data is, er, “uncertain”… The various national Meteorological Services get first crack at it (and in some cases, the only shot at the daily data as they create a monthly that is reported via CLIMAT report, so unless you pay up for the daily data, you have nothing to QA…) then their ‘work product’ gets circulated as a CLIMAT to NCDC who put it into the GHCN (except they sometimes don’t…. Bolivia has several years of CLIMATS on Ogimet as does Papua New Guinea and others; but don’t rate a spot in GHCN)
But that’s OK. PNG is only the second largest island in the world… (per Wiki, so apply salt…)
And the QA that is applied has some “Issues” IMHO.
Folks wanting a peek at the QA process can see here:
http://chiefio.wordpress.com/2010/04/11/qa-or-tossing-data-you-decide/
Alvin (19:32:18) :
@Graeme From Melbourne (19:09:44)
Please remind me of the heat coefficient of CO2?
Joking…
Damn, that nice big volcanic red area up there looked so warm and inviting. Does that mean I should advise my tour group to unpack the beach towels, sunblock and scuba gear?
davidmhoffer (17:12:07) : Well… since the advent of fuel injection and electronic timing, not so much. I think more importantly though… not at +19 degrees C!
Clearly not a Diesel guy, I see…
And you can see that much of the equipment there is Diesel.
FWIW: Diesel is much thicker than gasoline. About like warm cooking oil (if you warm cooking oil, it’s about the same viscosity as room temperature Diesel) If cold enough it will ‘gel’ and turn to something like honey or even crisco. Then you don’t go anywhere.
It is a standard practice in very cold climates to not let your Diesel get cold via not turning it off. It’s also common to have a batch of electric heating elements added so you can get it re-started if you do shut it down. The typical “arctic kit” includes heated fuel lines, fuel tanks, and special heated fuel filters. Oh, and a block heater too. You will find an electric cord near the door of many places to “plug in”. Interesting to note that a cord of some sort is visible in the top picture near the door…
“Back in the old days” folks would use propane torches or build fires under the fuel lines / tanks to thaw out the Diesel if they got desperate enough. Haven’t seen that in a while, though.
On a regular Diesel, some fuel is bypassed at the hot injectors (they have always been injected…) and routed back to the fuel tank to help warm the fuel. At about 10 F it took me around 20 minutes to get my Diesel started on one ski trip. I’d arrived at Tahoe with a tank of #2 Diesel that night and forgot to fill ‘er up with #1 (winterized Diesel) upon arrival. Just parked at the Hotel and hit the hot tub. Then 6 AM came. No joy. A load of ‘Diesel Starter’ in the throat and loads of cranking and repeated cycling of the glow plugs got it warm enough to start after about 20 minutes (why I packed the long extension cord and battery charger). Then I left it idling for about an hour to get the fuel in the tank warmed. Didn’t shut it down until I’d filled up with #1 later in the day. ( I did add a couple of gallons of “lamp oil” from the nearest grocery store while looking for a Diesel stop with #1 for sale. That eased my worries a bit.)
Now if that’s what happens at 10 F, just imagine at the Arctic Circle.
Adding a few gallons of “lamp oil” or “kerosene” is a decent field expedient measure. My 240D says it can take up to 25% Regular Unleaded gasoline as winterizing, but my 300D says 50% Kerosene – one could substitute Jet-A if desired; just to give an idea what ‘winter Diesel’ is like. For severe arctic conditions their is an even thinner spec. that’s about like straight Jet-A.
Oh, and “BioDiesel” has the added problem that it can throw crystals of solidified fat at even higher temperatures. Like 50 F. While in common blends it’s usually good down to 0 C or 32 F that is NOT a given. It depends entirely on the particular fats and percentages used to make that batch of fuel. If you are in Very Cold Country then BioDiesel is NOT your friend. I’m an advocate of BioDiesel and run it often, but you have to know its limitations if you are not going to be stuck in the barn… Nothing like having a filter plugged with fat crystals to stop you in your tracks. This is why many bioDiesel conversion or Straight Veg Oil conversions put an arctic heater on the fuel filter. And why some guy in California knows about arctic Diesel kit… If I’d been running BioDiesel on that Tahoe trip I’d have never gotten it started. At 10 F it’s fudge.
So, as a Diesel driver, I can tell you for certain that on cold days I would get my truck started at Eureka and never shut it down until I was near an electrical outlet or heated barn. You can turn it off for a few minutes (fuel lines take time to cool) but not for long if it’s very cold and not worth the risk in the Arctic. I can also tell you that if it was my job to check the climate gear shed at 10 pm on a very cold night I’d be snuggling that truck up as close to my destination as possible and there is no way I’d turn it off. And I’d not be at all surprised to find a vehicle heater electrical outlet located near the front door of every building there. So if I did shut it down, it would be because I was plugged into a kilowatt or 2 of electrical heater to keep the rig toasty.
And those 10, 14, 17, 19, 22:00 temperature blips sure look like some kind of ‘appointed rounds’ to me. A “10 to 10” cycle of some thing. It would be very interesting to see if the pattern holds on other days.
HR (18:01:08) : The question I’ve got is how do you get a trend out of all this?
If a technical change introduced more errors then you may see a spike at the time of introduction. After that the rate of errors should remain the same and appear randomly. It could change the absolute values but not introduce a trend.
Simple. They use a “baseline”, so all that’s needed is that whatever the bogus heating is, not be present during 1951-1980. Since the site has grown a great deal, that’s pretty easy to accept.
So you can “lock in” a hot arctic via a cold baseline interval and then any ‘added heat’ will always show up as a rosy red Canada. Easy really.
Yeah, if you looked at, say, 1998 to now you would not see a warming trend. But who would ever do that?…
ZT (16:03:30) :
Mysteries of modern climatological ‘science’.
1. Mistakes are always found by non-climatologists.
2. Mistakes are found to have been erroneously increasing the temperature.
3. People who find the mistakes are reviled by climatologists.
But don’t forget – the ‘science’ is settled.
ZT, I think you have the basis of The Ten Golden Rules of Climatology. Perhaps others can expand on them.
jorgekafkazar (18:21:13) : Wait a bit. Look at the low-boy, then to the right. Count six drums. What is that above the 6th drum??? Looks like a honkin’ big burner to me. Do my eyes deceive me?
If you look around the picture, there are LOTS of smokestacks. Take that little building just in front of the ‘radar dome’ like structure. That grey thing on this side is a Fuel Tank. Don’t know why a tiny little building like that has a big fuel tank and a tall smoke stack but it does. Then the big shed / garage behind the red dump truck has odd structures on the top. Vents? One looks like a giant version of an outdoor kerosene heater. Maybe it’s the equipment repair shop? Then further on other buildings have smokestacks too. So there are loads of places that could be venting heat.