UPDATE 4/23 4PM: I’ve been in contact with the Eureka Weather Station manager, and despite the incredible nature of the temperature jumps that are outside of normal experiences, such as July 14 2009, they do appear to be real. The METAR coding errors are another issue. I have many pictures now, plus a plan map, and a better meteorological insight than what can be gained from the meager online metadata. I’ll have an updated post later tonight or tomorrow – Anthony
Ecotretas find more cases of missing “M”s and mangled data in METAR reports making it into climatic temperature data. I’ve reposted his findings below and added some of my own notes [in brackets] to strengthen his findings. This time it’s Eureka, Nunavut, Canada. From “Up Here” magazine:
The first High Arctic Weather Station in history, Eureka was established in April 1947 at 80-degrees north latitude in the vicinity of two rivers, which provided fresh water to the six-man United States Army Air Force team that parachuted in. They erected Jamesway huts to shelter themselves and their equipment until August, when an icebreaker reached Eureka – as it has every year since – and brought permanent buildings and supplies. For decades after that, small, all-male crews would hunker down for entire winters, going a little stir-crazy from the isolation.

As I pointed out last Saturday there’s a common reporting flaw in world meteorological stations that use the METAR weather data format to report their hourly temperatures. Just one bad report in a cold location in the Arctic or Antarctic is enough to throw off the whole month’s worth of data when averaged. And it is monthly data that is used for climate. The all time high temperature error identified below has found it’s way into Wikipedia as “factual” when it is clearly wrong.
Some METAR and other kinds of unidentified errors also seem to be finding their way into official Environment Canada data. I’ve made screencaps. Given the importance of this weather station as the last surviving GHCN station that far north, also used in GISS, you’d think better quality control would be done, particularly when EC has a statement about data quality on each data page. What has been found seems to point to a corrupted dataset there.
– Anthony
=======================================
Eureka by Ecotretas


[Images above from GISS – click to enlarge]
Eureka, in Nunavut Canada, is a very special meteorological station. As can be seen in the first image above, it is responsible for the very big stripe on the very top of Canada. As can be seen on the second image, the data from only one station is responsible for a very big percentage of global temperatures… Both graphs can be obtained here.
So, one would imagine that data for this station is quality proof. We found two sources for temperature data: at Weather Underground and at the National Climate Data and Information Archive.
The first interesting data about this station is its record high temperature, which according to Wikipedia was reached on July 14, 2009, with 20ºC. [image below added by Anthony]

[UPDATE: Wikipedia editor removed the sentence above within 8 hours of this posting. See discussion here]
On Weather Underground, the monthly page for that day does say that 20ºC was the maximum temperature. But when you check the METAR data, the maximum temperature was 14ºC.
[Here is where it really gets strange, I’ve added two screencaps from Environment Canada, on for the monthly data, another for the daily data from July 14th, 2009. They don’t match! The 20.9C value never appears in the July 14th hourly data. Click images below to enlarge, EC’s July 2009 Monthly report on the left, July 14th, 2009 daily/hourly data on the right. Perhaps EC corrected the error in the daily/hourly data, but missed the monthly? – Anthony]


[click images above to enlarge]
[It also shows up as 20.9C on the EC yearly report for 2009, shown below]

Checking the Environment Canada page, the maximum for the date was 14.4ºC.
Things were different on the day before, July 13th. Maximum temperature for Weather Underground was also 20ºC, while at Environment Canada was 19.6ºC. But if you check the graphs below, some special heat occurred at 10PM, when temperatures soared some 15ºC!
(click images to enlarge)


[Image below added by Anthony. Here is the METAR report for Eureka, via Weather Underground, the error is highlighted in yellow, note the jump in temperature followed by a fall the next hour]

[In the image below added by Anthony, note the implausible temperature jump in the Environment Canada data for July 13th, 2009 at 22:00 where it was 5.9C at 21:00, jumping to 19.6C at 22:00, then back down to 4.1C at 23:00. Looking at the weather conditions of clear sky and moderate sustained winds from the North ~ 24 km/hr, there does not appear to be a meteorological explanation. Looking at the METAR data above, it appears the temperature was rounded up by the observer to 20C from 19.6. This makes me wonder if the event could be caused by something like a plane, truck, or snow-cat parked briefly near the sensor. In the Arctic, vehicles are left to idle, as turning them off allows them to freeze up, sometimes never to be restarted. ]

As Anthony Watts pointed out at Watts Up With That, the Eureka station registered the biggest rise in temperature probably seen on the Earth’s surface: 86ºC in one hour, on March 3, 2007! Now this data is available on Weather Underground, but seems not to exist in Environment Canada. The graph differences are clear below:


But that seems not to be the case in other examples. Take January 1st, 2007, for instance. Both Weather Underground and Environment Canada agree: there was a mighty spike at noon. Seems like the “M” problem affects both:


[Here’s the METAR data with the missing “M”, note at 11AM the M reappears]

There are times where differences are not so big, but the “M” problem is still there. Check the images from Weather Underground and Environment Canada for September 26, 2006:


Other times, changes are so significant, that something must be wrong. Check out the temperature rise on June 20, 2005. On the left, the weekly graph from Weather Underground shows a great surge in temperatures, confirmed by the Environment Canada graph for the day.


=====================================
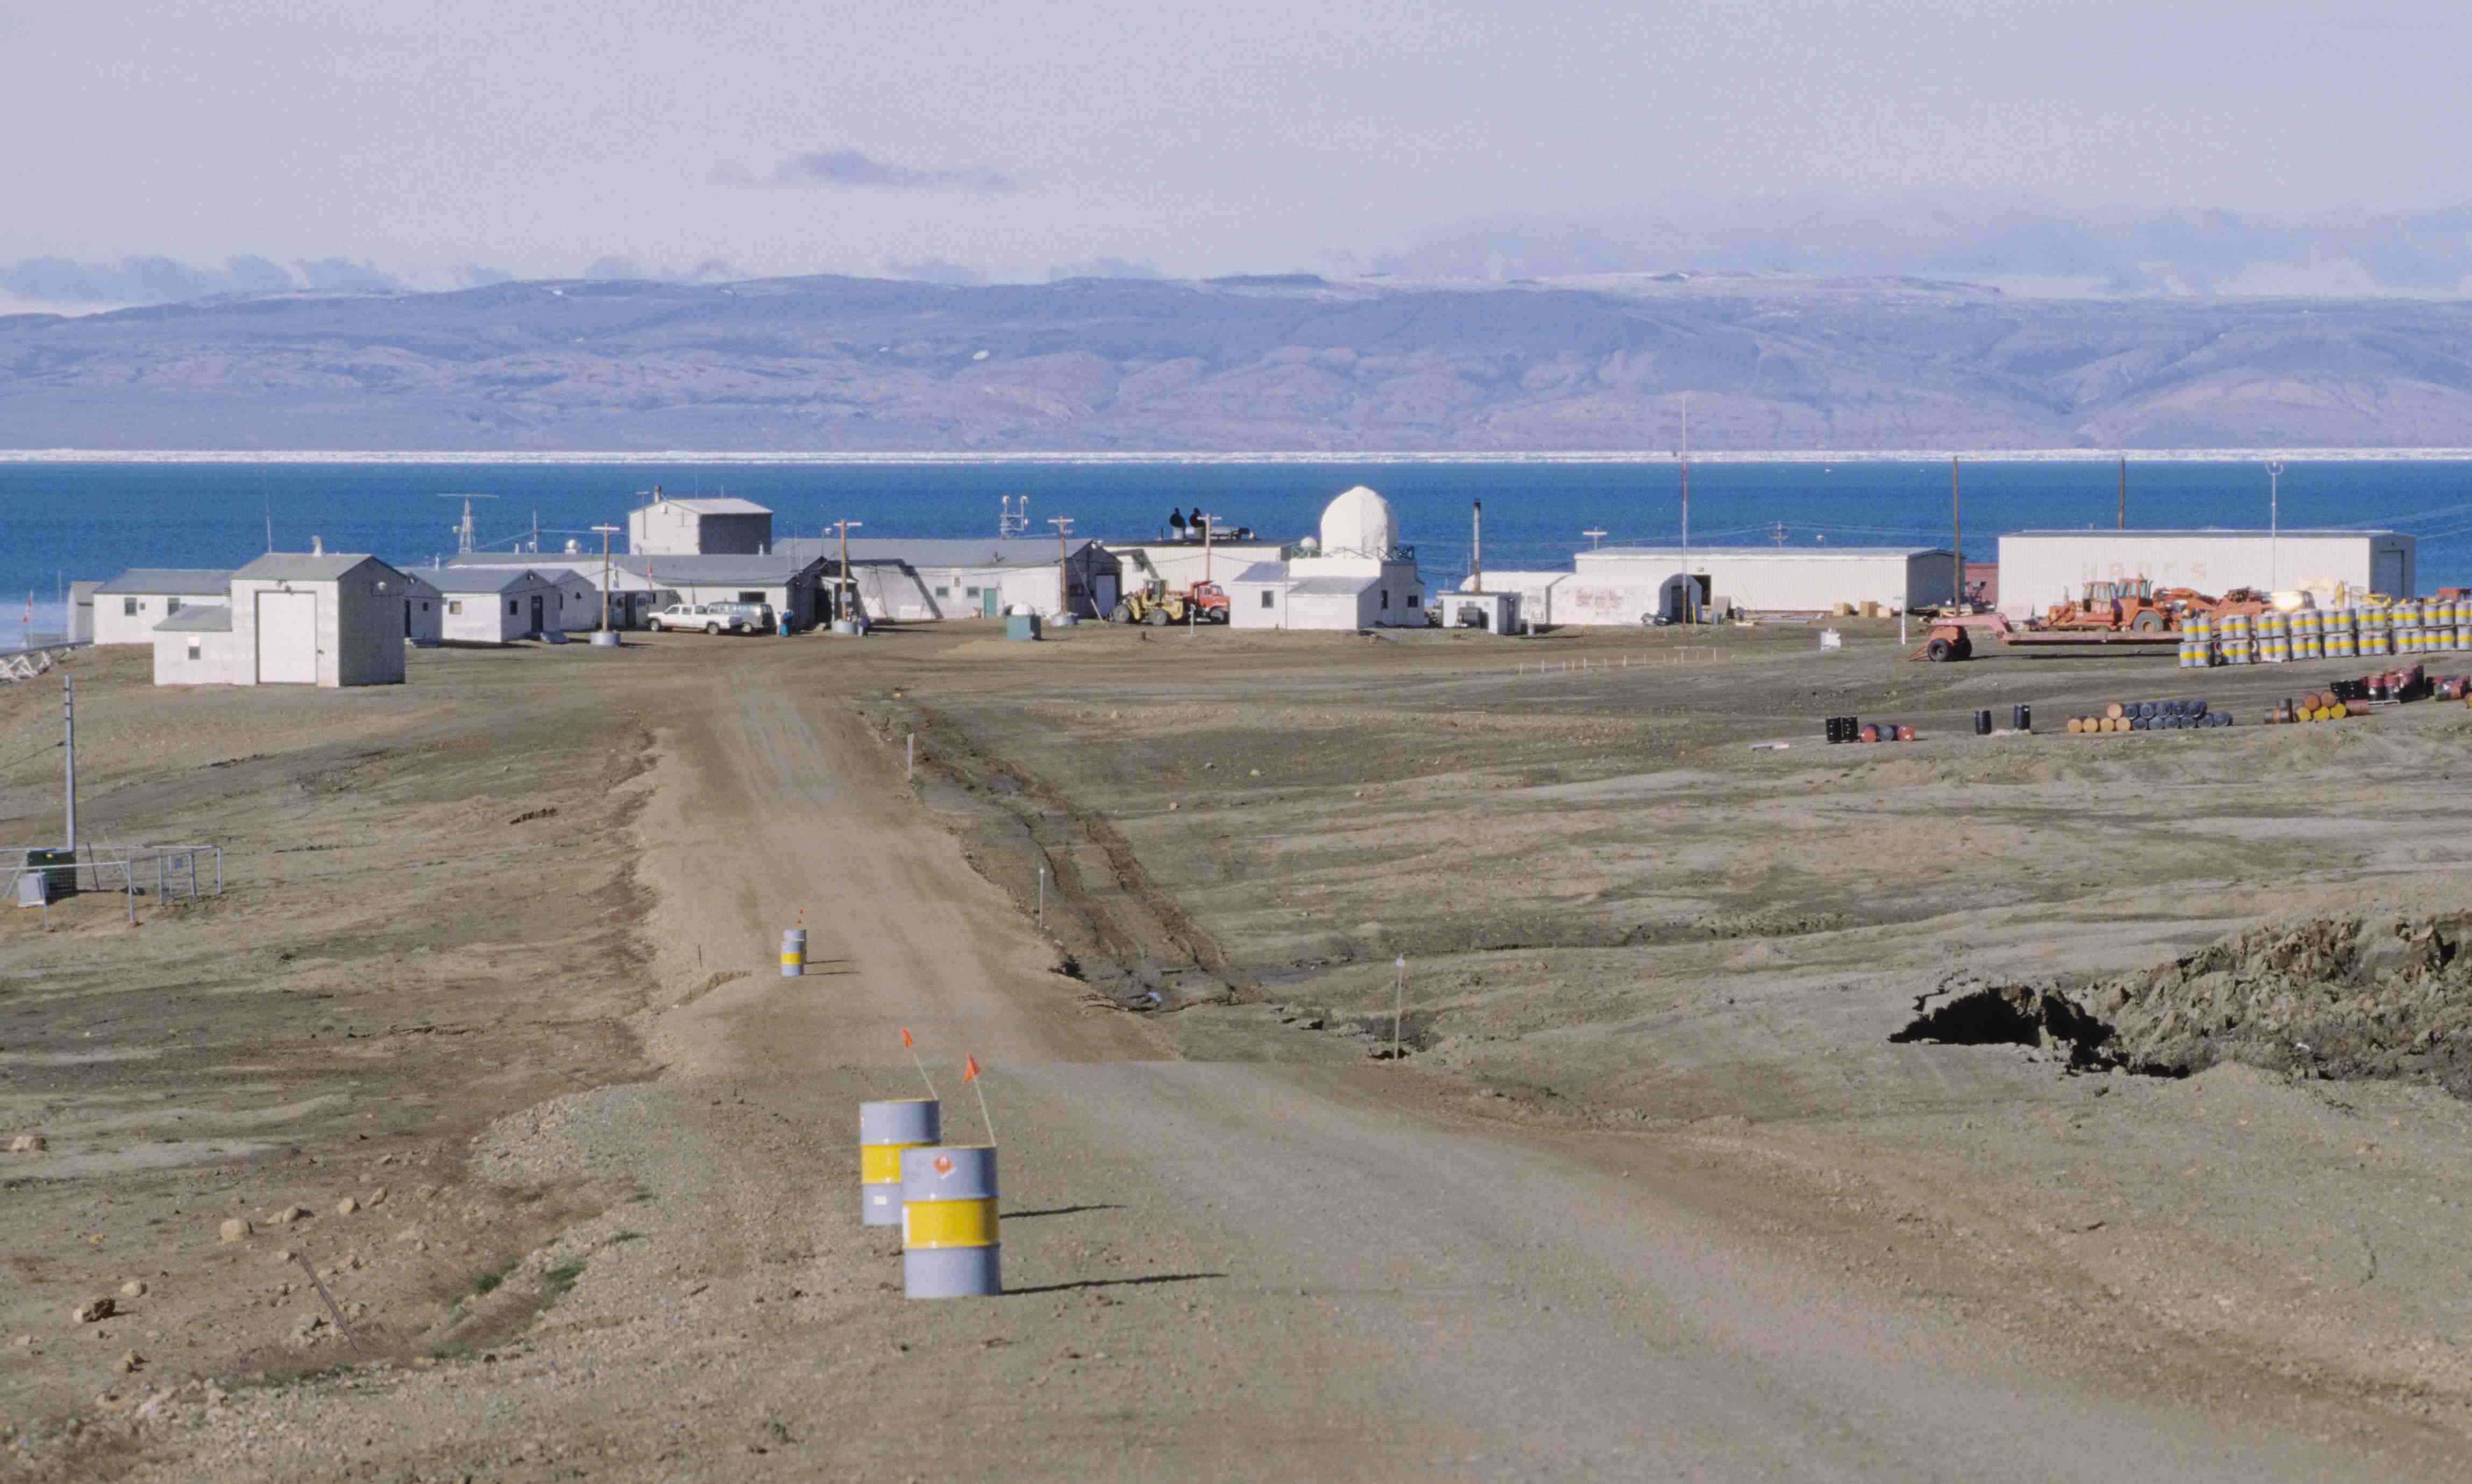
Thanks to Ecotretas for his sleuthing, I’m sure there are many more like this yet to be discovered. It seems with Eureka, more is going on than METAR errors. The temperature rises reported seem impossible given the meteorological conditions, and because they seem to be automated, suggest sensor error or perhaps sensor environment contamination (like a vehicle or other heat source). If you look at this 1997 image from Wikipedia (and click it to get the super hi-res version and pan around) you’ll see a number of vehicles near buildings. Where is the temperature sensor? – I don’t know, but if someone can find out it might shed some light on this mystery.
The fact that the obvious error on July 14th is now cited in Wikipedia as an “all time record high”, when it doesn’t appear in the EC hourly data, is troubling. – Anthony
too crazy to excerpt –
‘Avatar’ Director James Cameron: Climate Change as Great as Any Threat Since World War II
http://www.cnsnews.com/news/article/64516
@Pamela Gray (19:26:34) :
It is obvious, 1968-1996 (METAR transition) seem to be the weirdest in temperature measurements, METAR-GATE is appropriate (M-Gate for short). Transitions from and to all new metrology equipment should always be done under close supervision and statistical analysis (a gauge R&R is helpful, but, I dare say, the ubiquitous ‘they’ did not do that. ‘They’ did not fix this obvious ‘sign flipping’ issue and this amounts to the same neglect that the CRU and Mann are accused of.
M-gate works for me.
The Antarctica AWS stations are not good. Stay with this a twist is coming.
The Harry data led me to start looking and what turned up was not good.
Turns out the AWS hardware is problematic.
Then I found what I am quite sure is a bus error and then lots of instances of hardware malfunctions. To make it worse, the radio links are awful, inadequate error detection. Try a 20C jump in a matter of minutes and then back.
Cutting that part of the story short, I had the high resolution data when BAS were fiddling around with their web published public version so I could back calculate, all highly amusing. Antarctica Treaty and BAS omitted to say they have to give the data to others and they make it available to the public.
Hence I discovered the hardware errors in the real data.
What’s this to do with the Arctic, surely they are poles apart?
Seeing that ancient mil spec A/D are likely or similar and being a former equipment designer I took a guess, grab calculator.
” The temperature jumps from 6.9 to 13.0 and back to 7.4 at 10:00 hrs and again 9.5 to 13.7 and back to 7.2 at 17:00 hrs. ”
Only takes condensation to do this, given it happens at room temperature.
13 – 6.9=6.1C not interesting. But this is american equipment.
6.1*9/5 = 10.98 and that looks likely, is basically internally F, the higher numeric resolution. Kind of things folks do.
13-7.4*9/5=1008
13.7-9.5*9/5=756
13.7-7.2*9/5=1170
Bet that unlike the BAS stuff which appears to use an old BCD interface this is binary and a duff bit, 1024, bit 9, 2^10
Is about right on resolution. Wouldn’t be surprised if 1.024 or 10.24 is the internal reference
Look for jumps around 5.7C
If a higher bit is dodgy, might get 22.8C jump.
However on looking at some of the examples, could be at least 3 bits playing games
11.4
11.4+5.7=17.1
One of the plots shown might have several instances where actually the temperature variation was rather boring.
It gets worse, the reading are probably averaged and faults are noisy so anything is possible.
Might not be the only pattern and so the entire record is suspect, other malfunctions are possible. The equipment housing probably has an air leak.
The above is guesswork so I might be very wrong.
Fun puzzle as usual – this site is very addictive.
Consider being up there and the winter/night logic.
One would likely enjoy the beautiful July days but night would likely bring on a warmed up truck cab before venturing out. If the sensor was under a maintenance routine after all the rain a couple of days before, wouldn’t you work on it on the slightly warmed up hood of the truck in the morning and late afternoon and inside the cab at night?
There must be a lot of tundra “furies” out at night up there and it would be warmer in the cab.
Thus the modest spikes at 9am and 4pm and the big one at 9pm?
Here’s why
http://1.bp.blogspot.com/_blnN-QHR9C4/SyCdnL6-DwI/AAAAAAAAAOU/AWNYOYsPw4I/s1600-h/091125boklores1.jpg
I think we should destroy the economy just in case those heat spikes are real.
Is it safe to come out now?
Has all the ash fallen?
Is Earth Day done.
Are we done.
So done.
We.
This has less to do with METAR and more to do with the observers input and the lack of error checking by the software. When I type in the hourly weather, not in the METAR format, there is only a limited amount of error checking done.
Pressure is the only time the software looks back at the previous hour to check. So if at 1300Z I type -20.5 for the temperature and then at 1400Z I forget the – sign and type 20.6 the software won’t notice it.
While I can’t say for sure but I think the Stevenson Screen is visible in the image above. In the centre right there are some black and red drums. Directly above the 2 upright black drums and to the left of the flatbed is a white object that is the correct shape for the screen.
I searched through the temp records of every day in July and the 19.6 degrees C on July 13th was the warmest logged hourly temp that I found.
However, when you look at the hourly log for the 13th, it is obvious 19.6 was an error. There is no possible way the temperature would have soared to 19.6 at 10:00 pm, up from 5.9 deg at 9:00 pm. Then at 11:00 pm it drops back down to 4.1 degrees. Does this make logical sense?
Well from the Pics I saw here the New weather building is not there,you can’t miss it it is a very large blue building with everything in it. the pic is an old one. As for the truck, or snow-cat parked briefly near the sensor is possible, as I spent 3 months there for OP Hurricane and this kind of thing happens all the time of leaving vehicles running while conducting your business. At that time I wouldn’t even notice where the weather sensors were to my location, as I wouldn’t be paying any attention to it. But I can say there were no barriers or signs even put arround a weather station/sensor to avoid this kind of contaminatiion or I would have seen it and been told about parking too close to one. The weather station manager there is very controlling of the area and doesn’t want anyone stepping on or interferring in his business there. He calls the shots and doesn’t want anyone to tell him what to do. So I was always courtious with him and was able to conduct my business with the weather station personnel with minimal obstruction.
This might have been mentioned earlier (I only read WUWT in the evenings) but Ed Morrissey taped a very good interview with Dr Roy Spencer here:
http://tinyurl.com/36pe4ft
Dr. Spencer is the second of three guests.
Joanie
6.19 versus 19.6? Big difference. Reminds me of a little ‘ol mistake in the IPCC report.
Might it have been the case of read it and get back in where it’s warm? Now what was that number again? Oh hell. Can’t remember and I am freezing my numbnuts off. Ain’t goin back out there. I know it had a 1, a 9, and a 6 init. Close nuf for guvmnt work.
“Clearly there are data problems of all kinds here -A”
Just a bit of an understatement, eh Anthony…
If these ‘ERRORS’ were random, we should find some adding to the temps and others reducing temps…
Since the ‘ERRORS” all seem to be adding to the temperature… there has to be a concerted effort to achieve the temp increases.
Since, Mr. Smith, Mr. McIntyre and Mr.Watts have repeatedly shown the infinite layers of errors and manipulations have falsely shown miniscule warming.
This is an extremely shaky foundation for ‘science’.
When are we to say enough already!
Juts wondered if there are any known cases of sudden and drastic falls in temperature? Like if the researcher spills his G&T over the temperature sensor at 7pm each evening?
Because if not, then, together with the M problem described earlier, the collection and reporting mechanisms themselves are already biased to show artificially high temperatures.
maybe some global warmist just put their hand on the sensor to skew the data upwards but could not keep it there for a whole day, obviously!
Either you fudge the data, the statistical method, or the sensors… by the way, how often do these sensors get calibrated?
I’m flabbergasted that temperature data collection can be prone to so many errors in so many dimensions from siting issues to human errors of data entry and misunderstanding the limits of statistics, though on to human analysis fabrications (intentional or otherwise). How can any of it be taken seriously?
Has anyone made a list or flow diagram showing all the steps and all the places that errors have been found to creep in?
I found a similar error in a Resolute maximum in the last few years. I do not remember the year and month but I think it was about 15 degrees too high. I may have noted it here or in Climateaudit.
I’d like to say hi to Joby the maintenance man/ jack of all tradesman there if anyone from there is reading this. A well likeable fellow and a Newfoundlander too.
Anthony,
You mention that “the data from only one station is responsible for a very big percentage of global temperatures”. We can test this fairly easily by calculating global land temps (using raw GHCN v2.mean data) with and without Eureka (wmo_id 71917).
To me at least the results appear indistinguishable:
The trends bear this out: http://i81.photobucket.com/albums/j237/hausfath/Picture119.png
Trend 1900-2009 (Degrees C per decade)
GHCN land: 0.07456
GHCN land sans Eureka: 0.07453
Trend 1960-2009 (Degrees C per decade)
GHCN land: 0.20243
GHCN land sans Eureka: 0.20235
So while data quality from this station is certainly important, lets not make too much of its special status.
REPLY: Actually I did not mention that, Ecotretas did, but let’s not make a too much out of your mistakes. The issue of most interest is not GHCN as a whole, bit the fact the Eureka data gets interpolated into nearby grid boxes. Nice try at diluting the issue though. – A
It should not be hard to automate the discovery of the most blatant errors. A computer is pretty good at making comparisons in data. If a temperature rises some extreme amount from the previous and subsequent readings, particularly at a time of day when temperature should not be rising, it should be flagged for scrutiny.
I believe this shows the complete lack of scrutiny this data gets. We are asked to allow lifestyle modifying changes to be made in our laws (income modifying, too, I might add) based on these readings yet they take no serious responsibility for making sure those data are correct. It is yet again another indication of the lack of respect for and apparent contempt in which the tax paying citizen is held by those in these various government agencies and research organization.
How can they expect us to believe a word they say when such obvious errors slip through, possibly on a daily basis?
Just got back from a horrible match of pool. I’m…….this is ……well, to quote my vice president……this is a big f…n deal!!!!!! Were they really that stupid??? I haven’t read the discussion because….well, I’m back from the bar, but wtf? Is that really the station that is causing all the warming????? I’ve got a good 1/2 hr left in me tonight……….. someone give me a yes or no!!!! IS that the one that is making the arctic so hot??
Anthony wrote:
“Freespeech: We all make mistakes, even simple ones like leaving the “e” off “th_”
I agree, and just like the dropped ‘M’ I hope we can all tell the difference between a systematic error and a typo. I am not trying to be a smart arse here. This mistake appears systematically in your documents, it is difficult for a pure spell-checker to correct since both are correct words. Your documents are being seen (hopefully) by more influential audiences and hence it is important that they appear to be of high quality and well thought out. While I understand that content should be more important than form, we need to be aware that if a document appears to be written by an Appalachian banjo player it may affect its impact.
Now I’m not saying your documents appear that way, just trying to help.
I should have prefixed the original post with:
“Helpful comment only–do not publish”
Apologies.
.
.
Please look up “The Cremation of Sam McGee”.
Therein lies the answer to sudden rises of temperature in Canada’s North.
.
.
Let me get this straight. It started out being manned by American soldiers, but its a Canadian base, so over time it has had a mix of both, all men, no radio, TV, newspapers, nothing to do but drink, and nothing to read but a thermometer. Can you imagine some of the conversations?
Cdn; Did you read the thermometer?
Amcn; Yup. marked it down.
Cdn; Did you put an M for minus?
Amcn; Nope. It was positive.
Cdn; Eh?
Amcn; Plus. It was like plus 20.
Cdn; Can’t be. Its like snowing out, eh.
Amcn; Well dummy, 20 is 12 degrees below freezing.
Cdn; Moron, we use Celsius now. You read the wrong side of the thermometer.
Amcn; So I gotta read it again?
Cdn; Yeah.
Amcn; Can’t. There’s a polar bear out there now. Can’t we just convert?
Cdn; Yeah, you gotta divide by nine and multiply by five…
Amcn; …no, I think you got it backwards…
Cdn; …and add 32.
Amcn; and put an M in front of it cuz itz below freezing?
Cdn; no because its below zero
Amcn; but its plus 20…
Cdn; so don’t.
Amcn; Fine.
Cdn; Fine.
Amcn; You gotta read the next time.
Cdn; Polar bear still out there. Not risking my life to read a thermometer.
Amcn; …and we’re outa booze, I forgot the rest in my truck.
Cdn; that’s different. gimme my jacket, eh?
One would expect basic data entry errors to have a neutral bias, one would expect them to happen in both directions at about equal frequency. The METAR M problem is one which always biases warm or will bias warm at much greater frequency. It requires someone to insert an incorrect M in order to bias a reading cold while it takes a simple mistake of “-” or omission to bias warm. In other words, warm is the bias of omission which is an easier mistake to make.
There are two things that should be done to eliminate the error:
1. Require a P for + in addition to the M required for -. Do not assume an unsigned reading is positive.
2. Develop input software that will substitute P for a + and M for a – in the input data.
3. Flag unsigned input data with an E flag. 13.2 would be reported as E13.2 in order to flag that the sign needs to be corrected.
In this way the bias of omission is to flag error (neutral consequence) and to bias a legitimate reading warm or cold would require an active mistake on the part of the person entering the reading. Such errors would be expected to happen in both directions over time.