UPDATE 4/23 4PM: I’ve been in contact with the Eureka Weather Station manager, and despite the incredible nature of the temperature jumps that are outside of normal experiences, such as July 14 2009, they do appear to be real. The METAR coding errors are another issue. I have many pictures now, plus a plan map, and a better meteorological insight than what can be gained from the meager online metadata. I’ll have an updated post later tonight or tomorrow – Anthony
Ecotretas find more cases of missing “M”s and mangled data in METAR reports making it into climatic temperature data. I’ve reposted his findings below and added some of my own notes [in brackets] to strengthen his findings. This time it’s Eureka, Nunavut, Canada. From “Up Here” magazine:
The first High Arctic Weather Station in history, Eureka was established in April 1947 at 80-degrees north latitude in the vicinity of two rivers, which provided fresh water to the six-man United States Army Air Force team that parachuted in. They erected Jamesway huts to shelter themselves and their equipment until August, when an icebreaker reached Eureka – as it has every year since – and brought permanent buildings and supplies. For decades after that, small, all-male crews would hunker down for entire winters, going a little stir-crazy from the isolation.

As I pointed out last Saturday there’s a common reporting flaw in world meteorological stations that use the METAR weather data format to report their hourly temperatures. Just one bad report in a cold location in the Arctic or Antarctic is enough to throw off the whole month’s worth of data when averaged. And it is monthly data that is used for climate. The all time high temperature error identified below has found it’s way into Wikipedia as “factual” when it is clearly wrong.
Some METAR and other kinds of unidentified errors also seem to be finding their way into official Environment Canada data. I’ve made screencaps. Given the importance of this weather station as the last surviving GHCN station that far north, also used in GISS, you’d think better quality control would be done, particularly when EC has a statement about data quality on each data page. What has been found seems to point to a corrupted dataset there.
– Anthony
=======================================
Eureka by Ecotretas


[Images above from GISS – click to enlarge]
Eureka, in Nunavut Canada, is a very special meteorological station. As can be seen in the first image above, it is responsible for the very big stripe on the very top of Canada. As can be seen on the second image, the data from only one station is responsible for a very big percentage of global temperatures… Both graphs can be obtained here.
So, one would imagine that data for this station is quality proof. We found two sources for temperature data: at Weather Underground and at the National Climate Data and Information Archive.
The first interesting data about this station is its record high temperature, which according to Wikipedia was reached on July 14, 2009, with 20ºC. [image below added by Anthony]

[UPDATE: Wikipedia editor removed the sentence above within 8 hours of this posting. See discussion here]
On Weather Underground, the monthly page for that day does say that 20ºC was the maximum temperature. But when you check the METAR data, the maximum temperature was 14ºC.
[Here is where it really gets strange, I’ve added two screencaps from Environment Canada, on for the monthly data, another for the daily data from July 14th, 2009. They don’t match! The 20.9C value never appears in the July 14th hourly data. Click images below to enlarge, EC’s July 2009 Monthly report on the left, July 14th, 2009 daily/hourly data on the right. Perhaps EC corrected the error in the daily/hourly data, but missed the monthly? – Anthony]


[click images above to enlarge]
[It also shows up as 20.9C on the EC yearly report for 2009, shown below]

Checking the Environment Canada page, the maximum for the date was 14.4ºC.
Things were different on the day before, July 13th. Maximum temperature for Weather Underground was also 20ºC, while at Environment Canada was 19.6ºC. But if you check the graphs below, some special heat occurred at 10PM, when temperatures soared some 15ºC!
(click images to enlarge)


[Image below added by Anthony. Here is the METAR report for Eureka, via Weather Underground, the error is highlighted in yellow, note the jump in temperature followed by a fall the next hour]

[In the image below added by Anthony, note the implausible temperature jump in the Environment Canada data for July 13th, 2009 at 22:00 where it was 5.9C at 21:00, jumping to 19.6C at 22:00, then back down to 4.1C at 23:00. Looking at the weather conditions of clear sky and moderate sustained winds from the North ~ 24 km/hr, there does not appear to be a meteorological explanation. Looking at the METAR data above, it appears the temperature was rounded up by the observer to 20C from 19.6. This makes me wonder if the event could be caused by something like a plane, truck, or snow-cat parked briefly near the sensor. In the Arctic, vehicles are left to idle, as turning them off allows them to freeze up, sometimes never to be restarted. ]

As Anthony Watts pointed out at Watts Up With That, the Eureka station registered the biggest rise in temperature probably seen on the Earth’s surface: 86ºC in one hour, on March 3, 2007! Now this data is available on Weather Underground, but seems not to exist in Environment Canada. The graph differences are clear below:


But that seems not to be the case in other examples. Take January 1st, 2007, for instance. Both Weather Underground and Environment Canada agree: there was a mighty spike at noon. Seems like the “M” problem affects both:


[Here’s the METAR data with the missing “M”, note at 11AM the M reappears]

There are times where differences are not so big, but the “M” problem is still there. Check the images from Weather Underground and Environment Canada for September 26, 2006:


Other times, changes are so significant, that something must be wrong. Check out the temperature rise on June 20, 2005. On the left, the weekly graph from Weather Underground shows a great surge in temperatures, confirmed by the Environment Canada graph for the day.


=====================================
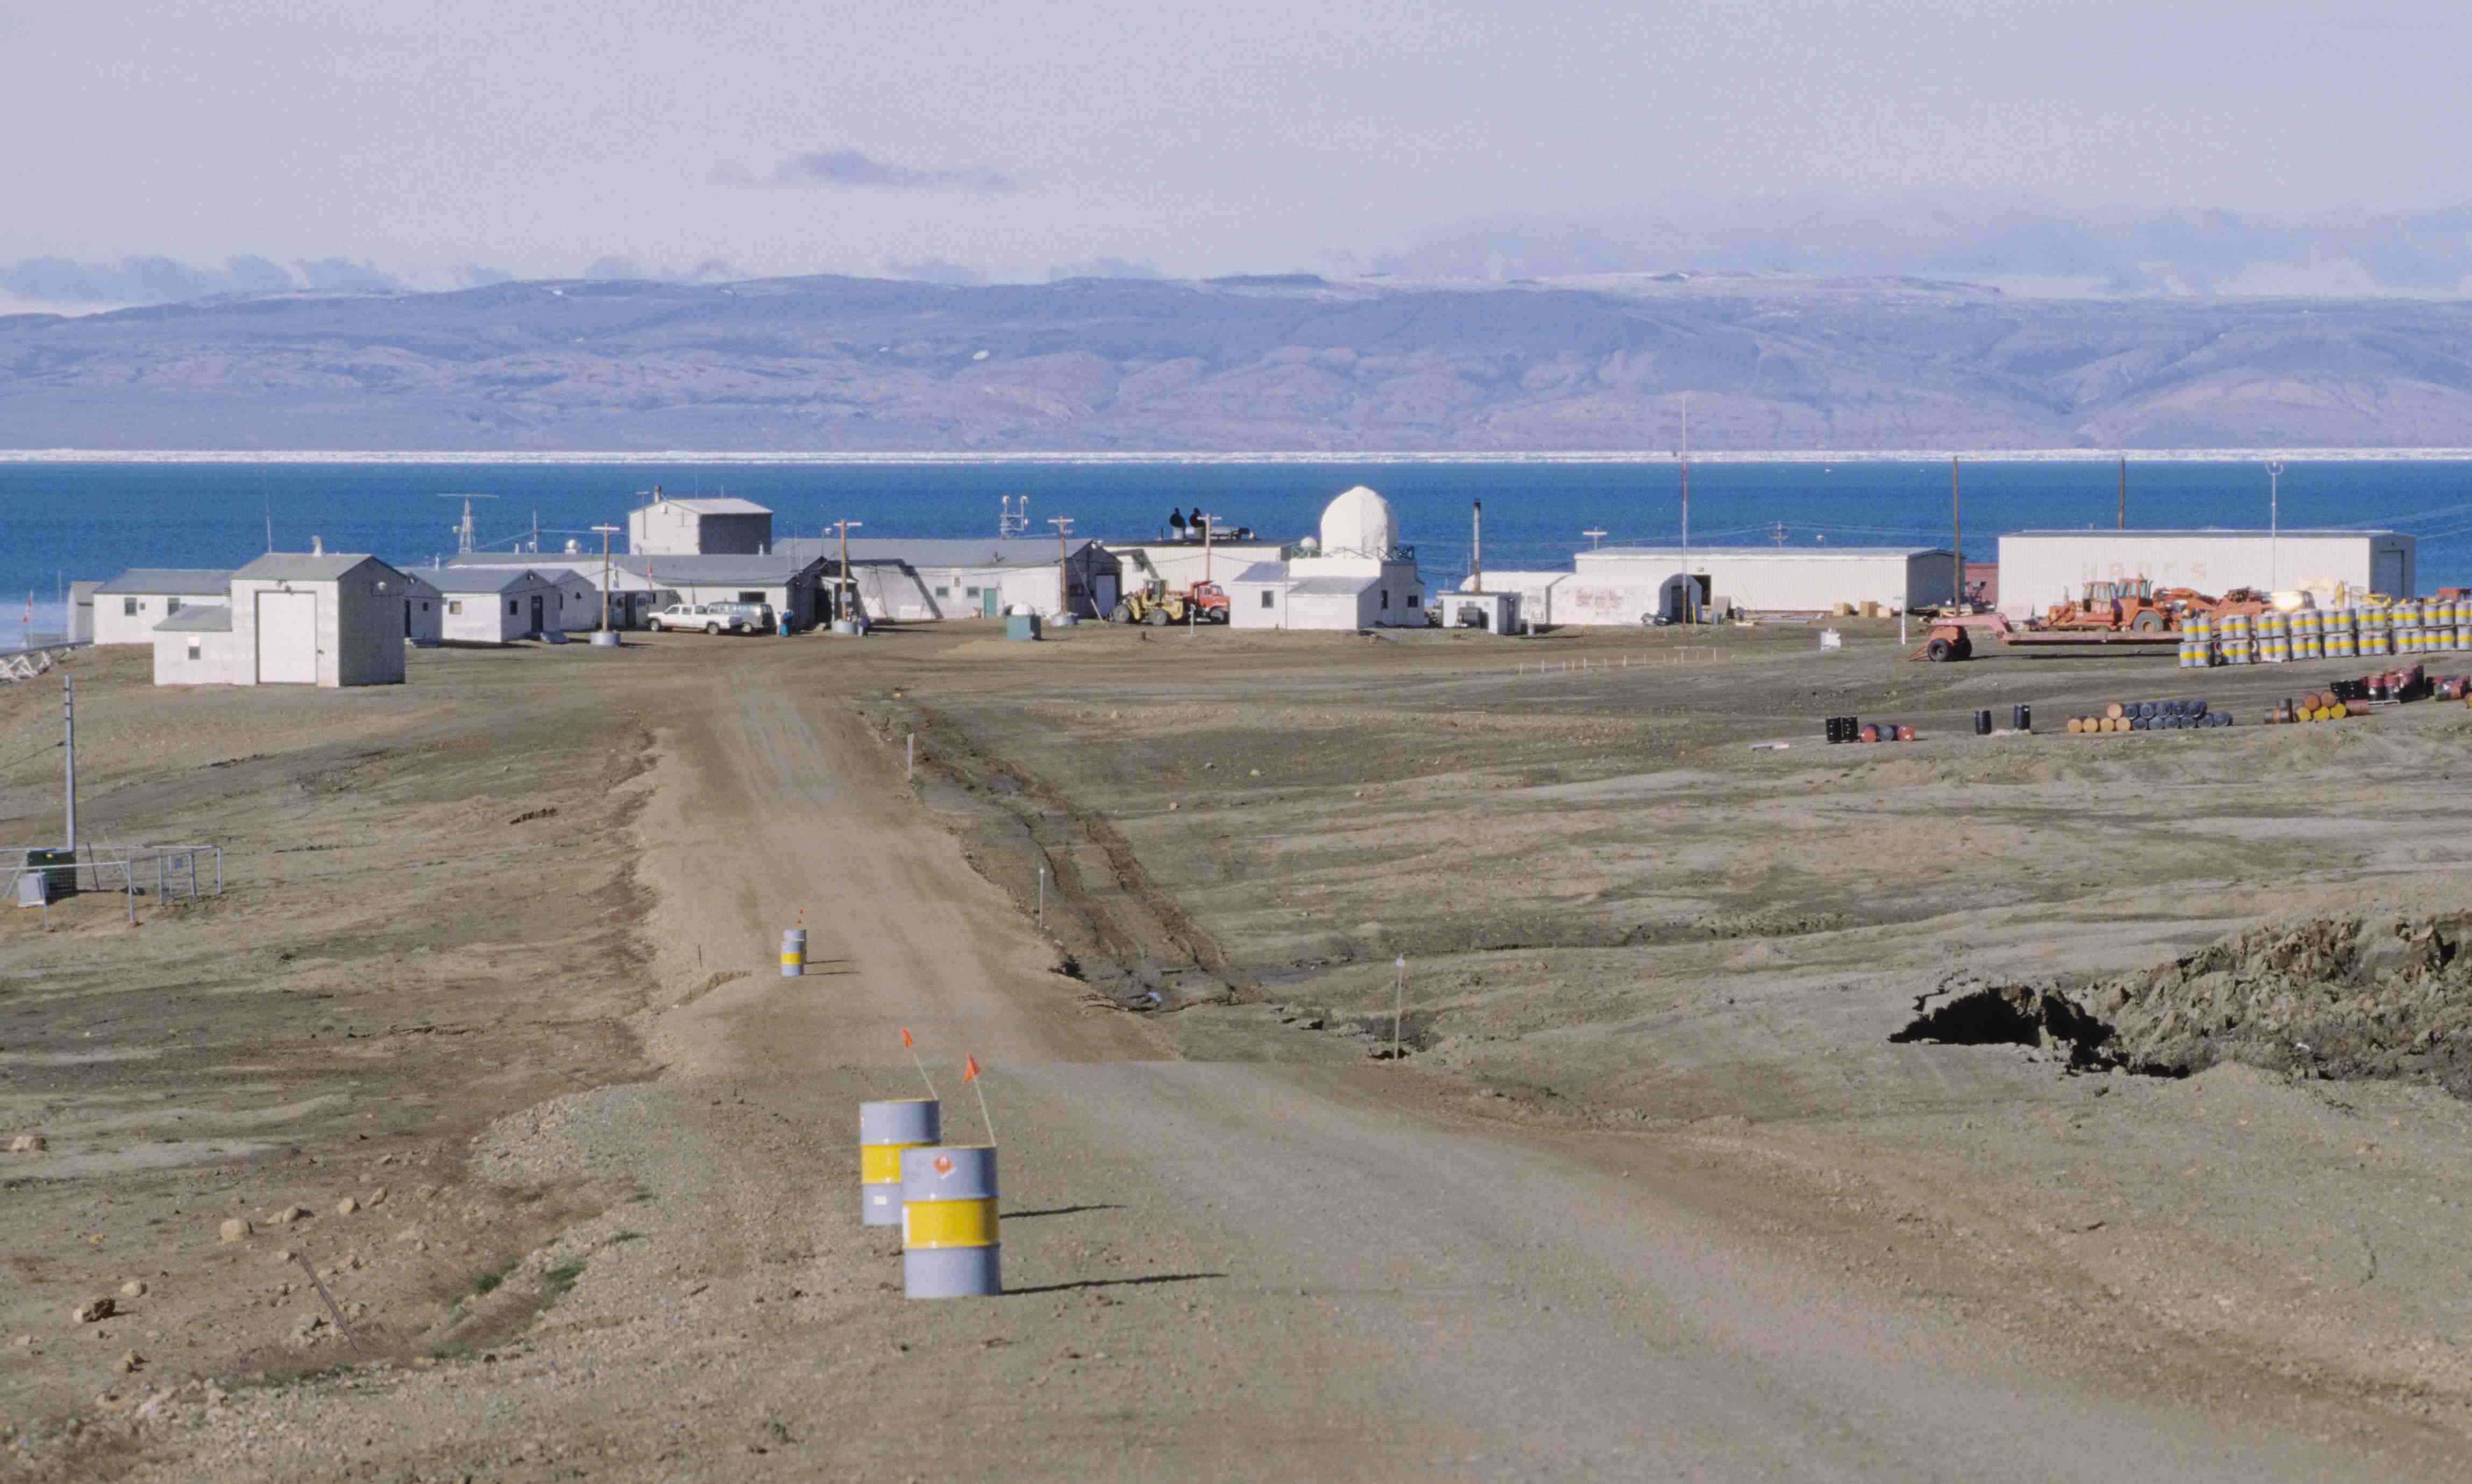
Thanks to Ecotretas for his sleuthing, I’m sure there are many more like this yet to be discovered. It seems with Eureka, more is going on than METAR errors. The temperature rises reported seem impossible given the meteorological conditions, and because they seem to be automated, suggest sensor error or perhaps sensor environment contamination (like a vehicle or other heat source). If you look at this 1997 image from Wikipedia (and click it to get the super hi-res version and pan around) you’ll see a number of vehicles near buildings. Where is the temperature sensor? – I don’t know, but if someone can find out it might shed some light on this mystery.
The fact that the obvious error on July 14th is now cited in Wikipedia as an “all time record high”, when it doesn’t appear in the EC hourly data, is troubling. – Anthony
freespeech (16:55:57) :
While I enjoy reading your posts I dearly look forward to the day that you learn that it’s is not th possessive of “it”, but rather the contraction of “it is”.
The possessive of it is merely “its”.
Anthony Watts (17:01:20) :
We all make mistakes, even simple ones like leaving the “e”. off “th_”
I’m whit Aohnnty on tihs. Sure, trehe aer tinghs taht bug me too, lkie wehn plopee use teh wrod “then” wehn tehy maen “than”, but get oevr it, i’ts teh mnieiang of waht smoebdoy syas taht cnuots, nto teh spelinlig.
This reminds me of the time it got down to -11F and snowed in Key West Florida on July 11, 2009.
http://wattsupwiththat.com/2009/07/11/key-west-fl-sets-new-subzero-record-low-temperature/
…I don’t think they let that record stand though.
That drop in humidity is relative. If the dewpoint is up, the absolute humidity may be high, which would correspond, I suspect, to a high temperature–not an instrument error per se, unless they determine the relative humidity from the same temperature sensor.
Wait a bit. Look at the low-boy, then to the right. Count six drums. What is that above the 6th drum??? Looks like a honkin’ big burner to me. Do my eyes deceive me?
freespeech (16:55:57) :
“[While I enjoy reading your posts I dearly look forward to the day that you learn that it’s is not th possessive of “it”, but rather the contraction of “it is”.
The possessive of it is merely “its”.]”
And THE is spelled THE; not TH
Surely these unexpected sharp spikes of temperature rise lend credence to the idea that “tipping points” via positive feedbacks are real, robust and “worse than we thought”
As Anthony, himself, has admitted, no known metereological process exists to explain such dramatic changes.
Climate “Science” already has the answer. When the metrics are subjected to rigorous and unquestioning analysis AND are going in the direction you first thought of, first move dissenting data to the censored folder.
Once this step has been achieved, present the pros and cons together in a balanced, neutral and peer-reviewed publication. “Nature”, springs to mind!
Remember, if you can’t find a physical mechanism to explain your findings, it must be Anthropogenic in origin.
Nothing to do with an ignorance on your part of the Science, ‘cos that is settled, it doesn’t need to invoke witchcraft- not so saleable,nowadays, as it used to be-but it does evoke a favourable response from the funding-throwers! Ching, Ching…
That’s good, isn’t it?
Anthony Watts!
The world’s temperatures own Mr Sherlock Holmes. Fantastic work again Anthony! GISS NHCD are completely incompetent.
Anthony Watts (17:01:20)
I don’t know about you, Anthony, but I use a wireless keyboard because I absolutely loathe being “tethered”. The drag of a physical connection just distracts me beyond endurance at this point of technology history. I am also prepared to swear under oath that wireless keyboards miss a character here and there that my finger quite firmly pushed.
I’m not entirely intolerant of the spelling/grammar police. But have a little sympathy for technolgy, eh?
These types of errors are common in EC data for some stations (and we are not talking about just a few – my experience has been that messy stations are far more common than good ones). This is admitted openly by EC administrators (one of whom wrote to me indicating his position was being phased out or eliminated or something to that effect shortly after we had correspondence about admitted data quality issues).
Anthony & others looking into this:
Note on the EC data pages links to “CSV” Excel files. In SOME cases they reveal more detailed info about which “data” have been estimated (some might say “cooked”).
I could show you MUCH more humorous examples that what you have shown here.
One has to wonder what data quality standards are like in “less” developed countries around the world…
Regards,
Paul.
@DaveK (16:15:42) :
As Lord Nelson famously said, ” I see no ships” followed by “only hardships” for some
Sorry to be pedantic, but that’s a common misquote. According to the legend, what Nelson said was,
“I really do not see the signal!” http://militaryhistory.about.com/b/2007/04/05/admiral-nelson-turns-a-blind-eye.htm.
– And “signal” is more relevant to the blind eye in the present case, but the motives behind this one are far less heroic.
jorgekafkazar (18:10:51) – As I mentioned recently, I think there was an increase in humidity because the dew point increased. Temp and humidity both increased.
Anthony – I think this is the first post for which the picture appears in the RSS feed. You often choose interesting pictures, so that’s a good change.
Why aren’t there two or more thermometers at every weather station, separated by say 100 metres? With automatic recording it would be easy to check whether the readings agree (as they should). Then parking a helicopter next to one of them may be noticed.
Or a lawn sprinkler: http://i41.tinypic.com/20ti0yu.jpg
(Google Streetview of Winton Post Office, Australia with Stevenson screen on left, sprinkler on right)
Dugg on http://digg.com/environment/Dial_M_for_mangled_Wikipedia_and_Env_Canada_data_errors
I’m looking into the min/max daily mean over a month and the difference with the precise hourly mean over a month – basically noise events like this get exaggerated by the first method..
See http://www.ecowho.com/blogs/30/What_exactly_is_a_monthly_mean%3F/-08b8b
Familiar stomping grounds for me. Worked there March 1979 to July 1980. Summers were wonderful, the winters sucked! i have similiar photos of that place.
An alternative interpretation of this data leads to the following conclusion.
Man Made Emissions of CO2 are not well mixed in the atmosphere but are capable of clumping together to form super hot spots, probably not much more than 1 meter wide, but kilometers high.
I would contend that just such a hot spot has occurred several times in the direct vicinity of the referenced thermometer. Due to the narrow width of the hot spots they rapidly come and go.
I would also contend that this is very similar to those rare situations where a super high wave is created when other waves happen to align with each other.
It also strikes me that this concept could also be used to explain spontaneous human combustion… and probably many other rare phenomena based around sudden heating.
Of course with many such ideas as the above, it is wise to apply Occams razor and compare the above contention with the other possible explanations ranging from human error, to fraud, to mechanical disruption of the thermometers environment…
Given the extremely high ethical standards and competancy of climate scientists I leave it to the reader to draw their own conclusions.
I was just about to make the point that davidmhoffer (17:12:07) did:
This makes me wonder if the event could be caused by something like a plane, truck, or snow-cat parked briefly near the sensor. In the Arctic, vehicles are left to idle, as turning them off allows them to freeze up, sometimes never to be restarted.>>
Well… since the advent of fuel injection and electronic timing, not so much. I think more importantly though… not at +19 degrees C!
Although some people leave their trucks idling so the air conditioning keeps running…
—- Except that it doesn’t seem warm enough to need air conditioning, and at these temperatures – even the real ones – a vehicle shouldn’t make that much of a difference.
Something stranger here. Could be a polar bear sitting on it, or something more obvious…
Why are all these errors on the convenient side?
I can’t think of a [ ]-gate term that is clever. We seem to be out of clever [ ]-gate terminology. And that speaks volumes.
@Graeme From Melbourne (19:09:44)
Please remind me of the heat coefficient of CO2?
Lance . . . did you ever work the DEW Line ?
Something similar seems to have happened last month when, according to NASA, it turned toasty (relatively speaking) all around the north pole:
http://data.giss.nasa.gov/cgi-bin/gistemp/do_nmap.py?year_last=2010&month_last=3&sat=4&sst=0&type=anoms&mean_gen=03&year1=2010&year2=2010&base1=1951&base2=1980&radius=1200&pol=pol
Could the huge anomaly of ~ 4 degrees Celsius be connected with readings from the Eureka weather station? I don’t think you can blame this one on a nearby vehicle with its engine running. Take a look at March 29, 2010:
http://www.wunderground.com/history/airport/CWEU/2010/3/29/DailyHistory.html?req_city=NA&req_state=NA&req_statename=NA
Automated surface measurements are subject to innumerable vicissitudes, manual data-entry is always prone to error. But surely, even rudimentary checks would flag major discrepancies for adjustment, editing, deletion. The fact that no-one on any level seems ever to run basic quality-control routines suggests that data gathering is marginal to climate studies’ “real work”– not an objective, rational scientific enterprise at all, but rather an agenda-driven exercise in buttressing preconceived conclusions regardless of circumstances pertaining to the real-world.
On this basis, a return to disinterested first principles is decades overdue. But having forfeited public trust to this extent, it’s hard to see how anything but a radical change in personnel over at least a generation could reinstate anything concerning Climate Cultists’ Green Gang of Briffa, Hansen, Jones, Mann, Trenberth et al. Meantime, nothing Pachauri and his ill-gotten crew pronounce has any credibility whatever.
Pamela Gray (19:26:34) “I can’t think of a [ ]-gate term that is clever. We seem to be out of clever [ ]-gate terminology. And that speaks volumes.”
Good point. How about Your-EC-agate?
DirkH’s comment about cooking eggs reminds me of a story:
In the early 60’s a quarterly supply flight delivered to the boys at Eureka their rations for the next few months whch included a couple of cases of eggs and a couple of jugs of rum. The next morning the station chief woke to find that the cook had discovered the rum and had fried all the eggs; then nailed them to the cookhouse wall. I have no idea what that day’s temperature record looked like.
Yeah well in wikipedia the truth doesn’t matter too much. It is filled with obstructionist pseudo-intellectual morons and enabled by admins who are in on the carbon credit scheme.
Yeah – I’m serious – check this out:
http://pediawatch.wordpress.com/2010/04/21/administrative-conflict-of-interest/
20.9C reads like an indoor temperature.
Wonder if someone brought the sensor array indoors for a brief period to replace or service a part not realizing it would have such a dramatic effect on the temperature history of the region. This happened recently enough that Environment Canada might have records or be able to query the staff about what happened.
Might be worth an email. They probably don’t even know they reported record temperatures.
One hesitates to cry “fraud”, but was no one at Env. Canada interested enough in a temperature of over 20C at Eureka to bother to question it; to look at the thermometer data?. This was not some one or two degree variance, this was huge. Alarm bells should have rung somewhere. They didn’t. Why?