UPDATE 4/23 4PM: I’ve been in contact with the Eureka Weather Station manager, and despite the incredible nature of the temperature jumps that are outside of normal experiences, such as July 14 2009, they do appear to be real. The METAR coding errors are another issue. I have many pictures now, plus a plan map, and a better meteorological insight than what can be gained from the meager online metadata. I’ll have an updated post later tonight or tomorrow – Anthony
Ecotretas find more cases of missing “M”s and mangled data in METAR reports making it into climatic temperature data. I’ve reposted his findings below and added some of my own notes [in brackets] to strengthen his findings. This time it’s Eureka, Nunavut, Canada. From “Up Here” magazine:
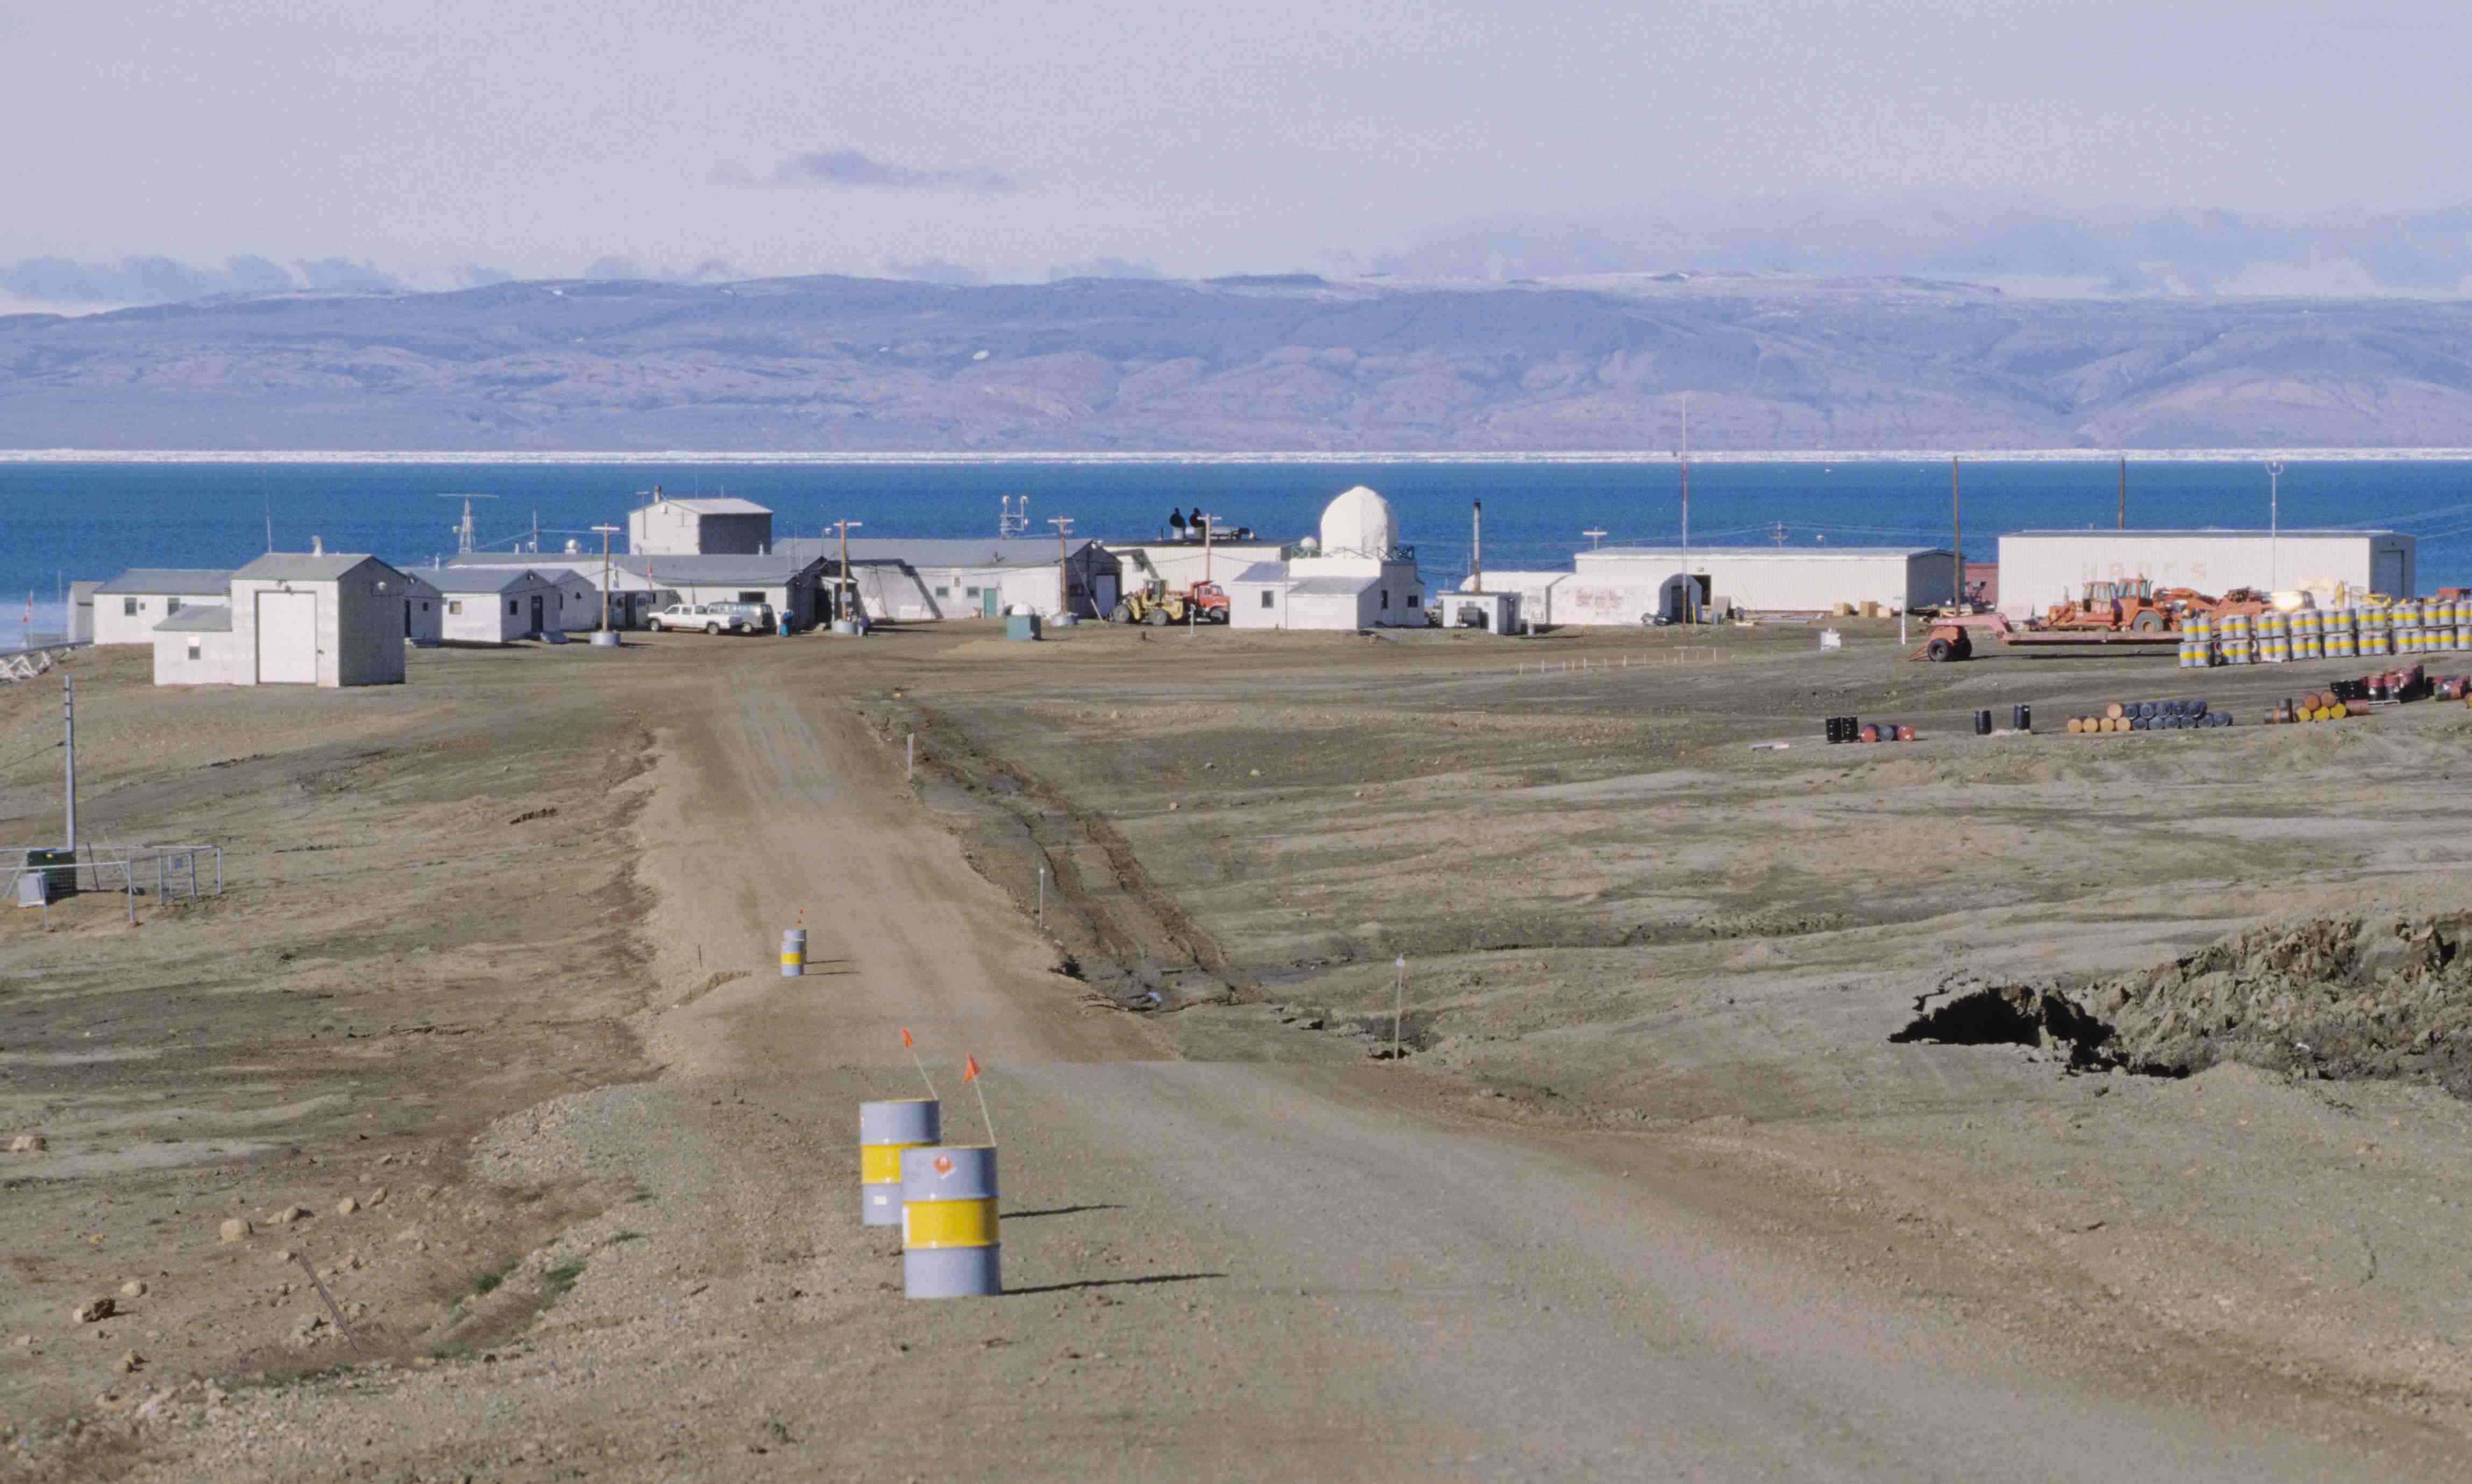
The first High Arctic Weather Station in history, Eureka was established in April 1947 at 80-degrees north latitude in the vicinity of two rivers, which provided fresh water to the six-man United States Army Air Force team that parachuted in. They erected Jamesway huts to shelter themselves and their equipment until August, when an icebreaker reached Eureka – as it has every year since – and brought permanent buildings and supplies. For decades after that, small, all-male crews would hunker down for entire winters, going a little stir-crazy from the isolation.

As I pointed out last Saturday there’s a common reporting flaw in world meteorological stations that use the METAR weather data format to report their hourly temperatures. Just one bad report in a cold location in the Arctic or Antarctic is enough to throw off the whole month’s worth of data when averaged. And it is monthly data that is used for climate. The all time high temperature error identified below has found it’s way into Wikipedia as “factual” when it is clearly wrong.
Some METAR and other kinds of unidentified errors also seem to be finding their way into official Environment Canada data. I’ve made screencaps. Given the importance of this weather station as the last surviving GHCN station that far north, also used in GISS, you’d think better quality control would be done, particularly when EC has a statement about data quality on each data page. What has been found seems to point to a corrupted dataset there.
– Anthony
=======================================
Eureka by Ecotretas


[Images above from GISS – click to enlarge]
Eureka, in Nunavut Canada, is a very special meteorological station. As can be seen in the first image above, it is responsible for the very big stripe on the very top of Canada. As can be seen on the second image, the data from only one station is responsible for a very big percentage of global temperatures… Both graphs can be obtained here.
So, one would imagine that data for this station is quality proof. We found two sources for temperature data: at Weather Underground and at the National Climate Data and Information Archive.
The first interesting data about this station is its record high temperature, which according to Wikipedia was reached on July 14, 2009, with 20ºC. [image below added by Anthony]

[UPDATE: Wikipedia editor removed the sentence above within 8 hours of this posting. See discussion here]
On Weather Underground, the monthly page for that day does say that 20ºC was the maximum temperature. But when you check the METAR data, the maximum temperature was 14ºC.
[Here is where it really gets strange, I’ve added two screencaps from Environment Canada, on for the monthly data, another for the daily data from July 14th, 2009. They don’t match! The 20.9C value never appears in the July 14th hourly data. Click images below to enlarge, EC’s July 2009 Monthly report on the left, July 14th, 2009 daily/hourly data on the right. Perhaps EC corrected the error in the daily/hourly data, but missed the monthly? – Anthony]


[click images above to enlarge]
[It also shows up as 20.9C on the EC yearly report for 2009, shown below]

Checking the Environment Canada page, the maximum for the date was 14.4ºC.
Things were different on the day before, July 13th. Maximum temperature for Weather Underground was also 20ºC, while at Environment Canada was 19.6ºC. But if you check the graphs below, some special heat occurred at 10PM, when temperatures soared some 15ºC!
(click images to enlarge)


[Image below added by Anthony. Here is the METAR report for Eureka, via Weather Underground, the error is highlighted in yellow, note the jump in temperature followed by a fall the next hour]

[In the image below added by Anthony, note the implausible temperature jump in the Environment Canada data for July 13th, 2009 at 22:00 where it was 5.9C at 21:00, jumping to 19.6C at 22:00, then back down to 4.1C at 23:00. Looking at the weather conditions of clear sky and moderate sustained winds from the North ~ 24 km/hr, there does not appear to be a meteorological explanation. Looking at the METAR data above, it appears the temperature was rounded up by the observer to 20C from 19.6. This makes me wonder if the event could be caused by something like a plane, truck, or snow-cat parked briefly near the sensor. In the Arctic, vehicles are left to idle, as turning them off allows them to freeze up, sometimes never to be restarted. ]

As Anthony Watts pointed out at Watts Up With That, the Eureka station registered the biggest rise in temperature probably seen on the Earth’s surface: 86ºC in one hour, on March 3, 2007! Now this data is available on Weather Underground, but seems not to exist in Environment Canada. The graph differences are clear below:


But that seems not to be the case in other examples. Take January 1st, 2007, for instance. Both Weather Underground and Environment Canada agree: there was a mighty spike at noon. Seems like the “M” problem affects both:


[Here’s the METAR data with the missing “M”, note at 11AM the M reappears]

There are times where differences are not so big, but the “M” problem is still there. Check the images from Weather Underground and Environment Canada for September 26, 2006:


Other times, changes are so significant, that something must be wrong. Check out the temperature rise on June 20, 2005. On the left, the weekly graph from Weather Underground shows a great surge in temperatures, confirmed by the Environment Canada graph for the day.


=====================================
Thanks to Ecotretas for his sleuthing, I’m sure there are many more like this yet to be discovered. It seems with Eureka, more is going on than METAR errors. The temperature rises reported seem impossible given the meteorological conditions, and because they seem to be automated, suggest sensor error or perhaps sensor environment contamination (like a vehicle or other heat source). If you look at this 1997 image from Wikipedia (and click it to get the super hi-res version and pan around) you’ll see a number of vehicles near buildings. Where is the temperature sensor? – I don’t know, but if someone can find out it might shed some light on this mystery.
The fact that the obvious error on July 14th is now cited in Wikipedia as an “all time record high”, when it doesn’t appear in the EC hourly data, is troubling. – Anthony
While I enjoy reading your posts I dearly look forward to the day that you learn that it’s is not th possessive of “it”, but rather the contraction of “it is”.
The possessive of it is merely “its”.
Freespeech: We all make mistakes, even simple ones like leaving the “e” off “th_”
Ed Caryl (16:18:20) :
You know, that DOES look like a stevenson screen, sitting on a slightly lower elevation. If you look closely, the landscape seems to drop lower 5-6 meters behind the low boy.
It’s worth taking a look at http://www.sailwx.info/shiptrack/
This website uses The World Meteorological Organization’s Voluntary Observing Ship (VOS) data.
Click on All ships worldwide and start searching in the cold northen regions. Scroll down for individual ship and bouy data. You’ll soon notice plenty of missing minus signs.
Some examples
This ship
http://www.sailwx.info/shiptrack/shipposition.phtml?call=UFTA
or this bouy
http://www.sailwx.info/shiptrack/shipposition.phtml?call=48548
(these are realtime readings if they stop working then take 5min to find some of your own)
Environment Canada’s hourly readings are not the high for the hour. They are just the reading that was taken on the hour. I have seen the high for the day be off by a degree or two for my area in Ontario, but nothing like this.
John M Reynolds
I’m willing to bet that the office cat curled up for a nap on the temperature sensor.
Kind of funny, Nick CLegg calling people “nutters” when he’s about the most vicious anti-semite British politics has seen in a long, long time. Look up some of his comments on the subject.
This makes me wonder if the event could be caused by something like a plane, truck, or snow-cat parked briefly near the sensor. In the Arctic, vehicles are left to idle, as turning them off allows them to freeze up, sometimes never to be restarted.>>
Well… since the advent of fuel injection and electronic timing, not so much. I think more importantly though… not at +19 degrees C!
Although some people leave their trucks idling so the air conditioning keeps running….
Bunch of guys, isolated and bored.
You are bound to get a blue flame every now and then, and since they show up better in the dark (outside) and they can warm you up a little, there is no need for any further analysis.
Anthony, as I understand it, WMO requires that a METAR report have AUTO included near the start if it was automatically generated. The illustrated reports do not contain this indicator.
Fortunately, all METAR reports from U.S. stations are required to have an additional “T Group” tacked on the end reporting the temperature and dew point in tenths of degrees Celsius, each preceded by a sign indicator, 0 for positive and 1 for negative. This at least provide a crosscheck. But nothing can automatically fix sloppy observations. Take a look a few U.S. METAR reports and be surprised.
I’m with you – I liked AIRWAYS code. I was always intrigued by the way so much info was packed into the term W0X0F, which for you “youngsters” meant “Ceiling Indefinite, Zero, Obscured, and visibility Zero with Fog.” We always pronounced it as if the zeros were alpha “ohs.”
OT
Not that I’m a fan at all of Shawn Hannity of Fox news, but he is doing a show tonight on Climategate at 9PM eastern.
given the time of year and the time of day, I’d guess the sensor was undergoing maintenance and someone brought it in or accessed it from indoors that evening – thus the 68F.
Picture of NDACC station at Eureka
http://www.ndsc.ncep.noaa.gov/sites/stat_reps/eureka/
NOAA article showing arctic observatories
http://www.esrl.noaa.gov/news/2007/psd070419.html
http://www.esrl.noaa.gov/psd/arctic/search/fig.html
http://www.oar.noaa.gov/research/2007/arctic.shtml
Eureka Operations building
http://www.ec.gc.ca/EnviroZine/english/issues/72/feature2_e.cfm
Canadian Station
http://www.canada.com/story_print.html?id=1298434&sponsor=
http://www.vancouversun.com/life/green-living/2465224.bin?size=620×400
http://gaw.empa.ch/gawsis/reports.asp?StationID=295
Eureka airstrip picture
http://static.panoramio.com/photos/original/2448336.jpg
Aerial view of Eureka
http://p6.hostingprod.com/@treks.org/arctic08.jpg
Eureka has eMinent domain over the north!
[:)]
Let me guess, it’s right next to the source of the black smoke in this photo…
http://acebox.uwaterloo.ca/eureka/Eureka2004/EurekaPictures/feb23_weather_station_at_night.jpg
If not here’s lots of other pics to chose from:
http://acebox.uwaterloo.ca/eureka/photos.html
http://acebox.uwaterloo.ca/eureka/Eureka2009/photos.html
http://acebox.uwaterloo.ca/eureka/Eureka2008/photos.html
http://acebox.uwaterloo.ca/eureka/Eureka2007/photos.html
http://acebox.uwaterloo.ca/eureka/Eureka2006/photos.html
http://acebox.uwaterloo.ca/eureka/Eureka2005/photos.html
http://acebox.uwaterloo.ca/eureka/Eureka2004/photos.html
Look at the other readings from July 13th, 2009 in Eureka, they’re consistent with a humid heat source. Dew point is higher, so there is more water in the air. The wind speed and pressure are unchanged, so something moist warmed the thermometer without a pressure change and without reaching the wind sensors.
It’s a non-weather temperature change, and not a misread thermometer.
I do note that the dew point happens to be the same as the previous hour’s temperature. But the temperature should have been dropping, so the actual temp that hour probably was not copied in the wrong place.
There is a possibility that the previous hour’s temp was copied twice, once into the temp and again into the next hour’s dew point. But if the temp was back-calculated from the dew point, the relative humidity should have been lower than it is. Again, this is inconsistent, so a local heat source is most likely.
It renders any conclusions you can draw from the data sets as eMpty of value.
Eureka has eMinent dominion over the north!
[:)]
Their GOES products and lightning detection are good, I have respect for some of their workers and field people but the management and public/media relations depts are just horrendous…
They sure do invest millions and millions of taxpayer dough in “green” initiatives and they’re big Kyoto cheerleaders, tho..
Drifting buoy.
http://www.sailwx.info/shiptrack/shipposition.phtml?call=48534
http://www.sailwx.info/shiptrack/shipposition.phtml?call=48537
Crazy temperature
Perhaps if they didn’t make the sensors look like ashtrays this sort of thing wouldn’t happen
A chinook perhaps ?
http://www.mountainnature.com/climate/Chinook.htm
The question I’ve got is how do you get a trend out of all this?
If a technical change introduced more errors then you may see a spike at the time of introduction. After that the rate of errors should remain the same and appear randomly. It could change the absolute values but not introduce a trend.
Gail Combs (16:36:33) :
The july 13 data with the big jump to 19.6 at 22:00 hrs also has some interest jumps at 10:00 hrs and 17:00 hrs. The temperature jumps from 6.9 to 13.0 and back to 7.4 at 10:00 hrs and again 9.5 to 13.7 and back to 7.2 at 17:00 hrs.
That’s what my data looked like from Anthony’s USB-2 two days ago.
After an evening cruize (sic) in my black 350Z (checking SA UHI), I left it installed in the window, taking readings every 10 seconds. Over night temps were very stable (overcast), but the next day was partly cloudy (with only a mild wind).
Max temp at the airport was 76°F, but a foot above the roof of my car, the temps were all over the map, reaching 98°F during one mid-afternoon sunny period.
The device would be an inexpensive way to measure cloudiness.
http://i41.tinypic.com/scqmn9.jpg
http://tinypic.com/r/scqmn9/5
I hope one or the other address is correct.
I thought this website was interesting.
http://www.sailwx.info/shiptrack/index.html
It shows The the World Meteorological Organization’s Voluntary Observing Ship (VOS) data realtime.
Click all ships worldwide and check some of the cold northerly reports. You can see many missing minus signs in both the ship and bouy data.
Do I notice a simultaneous drop in humidity? It must be the barbecue or a fired heater of some kind. I think vehicle exhaust might have a higher humidity than ambient. Somebody at the site may know exactly what happened. Otherwise, a simoom, maybe?
Every one of them [ the general pool of media the government criminal ring to terrorize people with the end of the world got it’s hands around: wikipedia, government reporting, government (university) review of scientific literature ]
Every one of them is being revealed to be fake , one,
by one.
Al Gore the guy who ”had a great idea of how to transform the economy he wanted to show the people… SMART, SMART MEN, He KNEW, had APPROVED it” –
carbon credits opened at $22 per ton. . . opening at Z.E.R.O. after
dozens of arrests all over Europe where he worked with Germans and others
Hansen with his legendary record of false predictions that , for some years, was literally a CAT CALL to shut a bunch of globel warming HICKS up.
Mann with his “school of statistics for climatography-ism-istic studies in the magic-sphere”
The entire system recently adjudicated as “not mathematics we endorse as being actual statistics” by the Royal Statistical Society…
If their statistics aren’t even endorsed by the people that teach statistical modeling
they aren’t qualified to make climate models and submit them at ALL.
‘WHAT YOU DO IS NOT MATH’ turns that water O.F.F. PERMAnently. PERManently kids.
They dont have MODELS they can get certified any more, NONE of them who used the Mann/Briffa/Jones/etc methods do; not by serious statistical/instrumentation schools or foundations. That’s done because it is a simple matter to simply enter into federal regulations and state, that methods used must have endorsement by statistical/instrumentation professionals and teachers in a variety of fields.
Briffa.. with 12 trees.. HID it for YEARS. Wanted it submitted to sway policy.. but didn’t want to have to let people look under the hood, just like Mann didn’t.
Kevin “I’m the smartest man in the world” Trenberth with his LUDICROUS ‘earth energy budget’ who
when we gave him a satellite
found he couldn’t read the information from it: what he had thought and taught and testified was end-of-the-world runaway warming
was
situation – what? Oh yea situation normal.
Gavin Schmidt who whined about how ”the troposphere really is heating if you look for it”
Steven Schneider who tried to float the “the answer’s floating in the wind” paper which said – he had MODELED TEMPERATURE from WIND SPEED in the troposphere, and SURE ENOUGH
the troposphere is heating and yea.. it’s worse than we thought, and yea … all the radiosonde
satellite
aircraft
thermal sensors on earth
are broken. They don’t work.
And with the NEW MODEL thermal measurement was no longer needed because it was OBSOLETE compared to schneider’s model.
Can you believe those claims were allowed to be floated at large, by him and the people who hire him, trenberth etc
As science that was foretelling the END people, of the WORLD.
Which one of them has NOT had his fundamental methodology and acumen completely revoked in broad daylight….
But they’re a ring of government employees and Al Gore needed them to pulse his “i could have been president” rage tantrum.
Dispicable.
Many years ago, Gore and others would have been out on the front steps of the capital choosing pistols out of a matched set in a box, where someone called him out to see if he really stood by his beliefs, as he and his friends LAID WASTE to PEOPLE’S LIVES and CAREERS in the interest of sheer political will for their word
to be the law of the land.