UPDATE 4/23 4PM: I’ve been in contact with the Eureka Weather Station manager, and despite the incredible nature of the temperature jumps that are outside of normal experiences, such as July 14 2009, they do appear to be real. The METAR coding errors are another issue. I have many pictures now, plus a plan map, and a better meteorological insight than what can be gained from the meager online metadata. I’ll have an updated post later tonight or tomorrow – Anthony
Ecotretas find more cases of missing “M”s and mangled data in METAR reports making it into climatic temperature data. I’ve reposted his findings below and added some of my own notes [in brackets] to strengthen his findings. This time it’s Eureka, Nunavut, Canada. From “Up Here” magazine:
The first High Arctic Weather Station in history, Eureka was established in April 1947 at 80-degrees north latitude in the vicinity of two rivers, which provided fresh water to the six-man United States Army Air Force team that parachuted in. They erected Jamesway huts to shelter themselves and their equipment until August, when an icebreaker reached Eureka – as it has every year since – and brought permanent buildings and supplies. For decades after that, small, all-male crews would hunker down for entire winters, going a little stir-crazy from the isolation.

As I pointed out last Saturday there’s a common reporting flaw in world meteorological stations that use the METAR weather data format to report their hourly temperatures. Just one bad report in a cold location in the Arctic or Antarctic is enough to throw off the whole month’s worth of data when averaged. And it is monthly data that is used for climate. The all time high temperature error identified below has found it’s way into Wikipedia as “factual” when it is clearly wrong.
Some METAR and other kinds of unidentified errors also seem to be finding their way into official Environment Canada data. I’ve made screencaps. Given the importance of this weather station as the last surviving GHCN station that far north, also used in GISS, you’d think better quality control would be done, particularly when EC has a statement about data quality on each data page. What has been found seems to point to a corrupted dataset there.
– Anthony
=======================================
Eureka by Ecotretas


[Images above from GISS – click to enlarge]
Eureka, in Nunavut Canada, is a very special meteorological station. As can be seen in the first image above, it is responsible for the very big stripe on the very top of Canada. As can be seen on the second image, the data from only one station is responsible for a very big percentage of global temperatures… Both graphs can be obtained here.
So, one would imagine that data for this station is quality proof. We found two sources for temperature data: at Weather Underground and at the National Climate Data and Information Archive.
The first interesting data about this station is its record high temperature, which according to Wikipedia was reached on July 14, 2009, with 20ºC. [image below added by Anthony]

[UPDATE: Wikipedia editor removed the sentence above within 8 hours of this posting. See discussion here]
On Weather Underground, the monthly page for that day does say that 20ºC was the maximum temperature. But when you check the METAR data, the maximum temperature was 14ºC.
[Here is where it really gets strange, I’ve added two screencaps from Environment Canada, on for the monthly data, another for the daily data from July 14th, 2009. They don’t match! The 20.9C value never appears in the July 14th hourly data. Click images below to enlarge, EC’s July 2009 Monthly report on the left, July 14th, 2009 daily/hourly data on the right. Perhaps EC corrected the error in the daily/hourly data, but missed the monthly? – Anthony]


[click images above to enlarge]
[It also shows up as 20.9C on the EC yearly report for 2009, shown below]

Checking the Environment Canada page, the maximum for the date was 14.4ºC.
Things were different on the day before, July 13th. Maximum temperature for Weather Underground was also 20ºC, while at Environment Canada was 19.6ºC. But if you check the graphs below, some special heat occurred at 10PM, when temperatures soared some 15ºC!
(click images to enlarge)


[Image below added by Anthony. Here is the METAR report for Eureka, via Weather Underground, the error is highlighted in yellow, note the jump in temperature followed by a fall the next hour]

[In the image below added by Anthony, note the implausible temperature jump in the Environment Canada data for July 13th, 2009 at 22:00 where it was 5.9C at 21:00, jumping to 19.6C at 22:00, then back down to 4.1C at 23:00. Looking at the weather conditions of clear sky and moderate sustained winds from the North ~ 24 km/hr, there does not appear to be a meteorological explanation. Looking at the METAR data above, it appears the temperature was rounded up by the observer to 20C from 19.6. This makes me wonder if the event could be caused by something like a plane, truck, or snow-cat parked briefly near the sensor. In the Arctic, vehicles are left to idle, as turning them off allows them to freeze up, sometimes never to be restarted. ]

As Anthony Watts pointed out at Watts Up With That, the Eureka station registered the biggest rise in temperature probably seen on the Earth’s surface: 86ºC in one hour, on March 3, 2007! Now this data is available on Weather Underground, but seems not to exist in Environment Canada. The graph differences are clear below:


But that seems not to be the case in other examples. Take January 1st, 2007, for instance. Both Weather Underground and Environment Canada agree: there was a mighty spike at noon. Seems like the “M” problem affects both:


[Here’s the METAR data with the missing “M”, note at 11AM the M reappears]

There are times where differences are not so big, but the “M” problem is still there. Check the images from Weather Underground and Environment Canada for September 26, 2006:


Other times, changes are so significant, that something must be wrong. Check out the temperature rise on June 20, 2005. On the left, the weekly graph from Weather Underground shows a great surge in temperatures, confirmed by the Environment Canada graph for the day.


=====================================
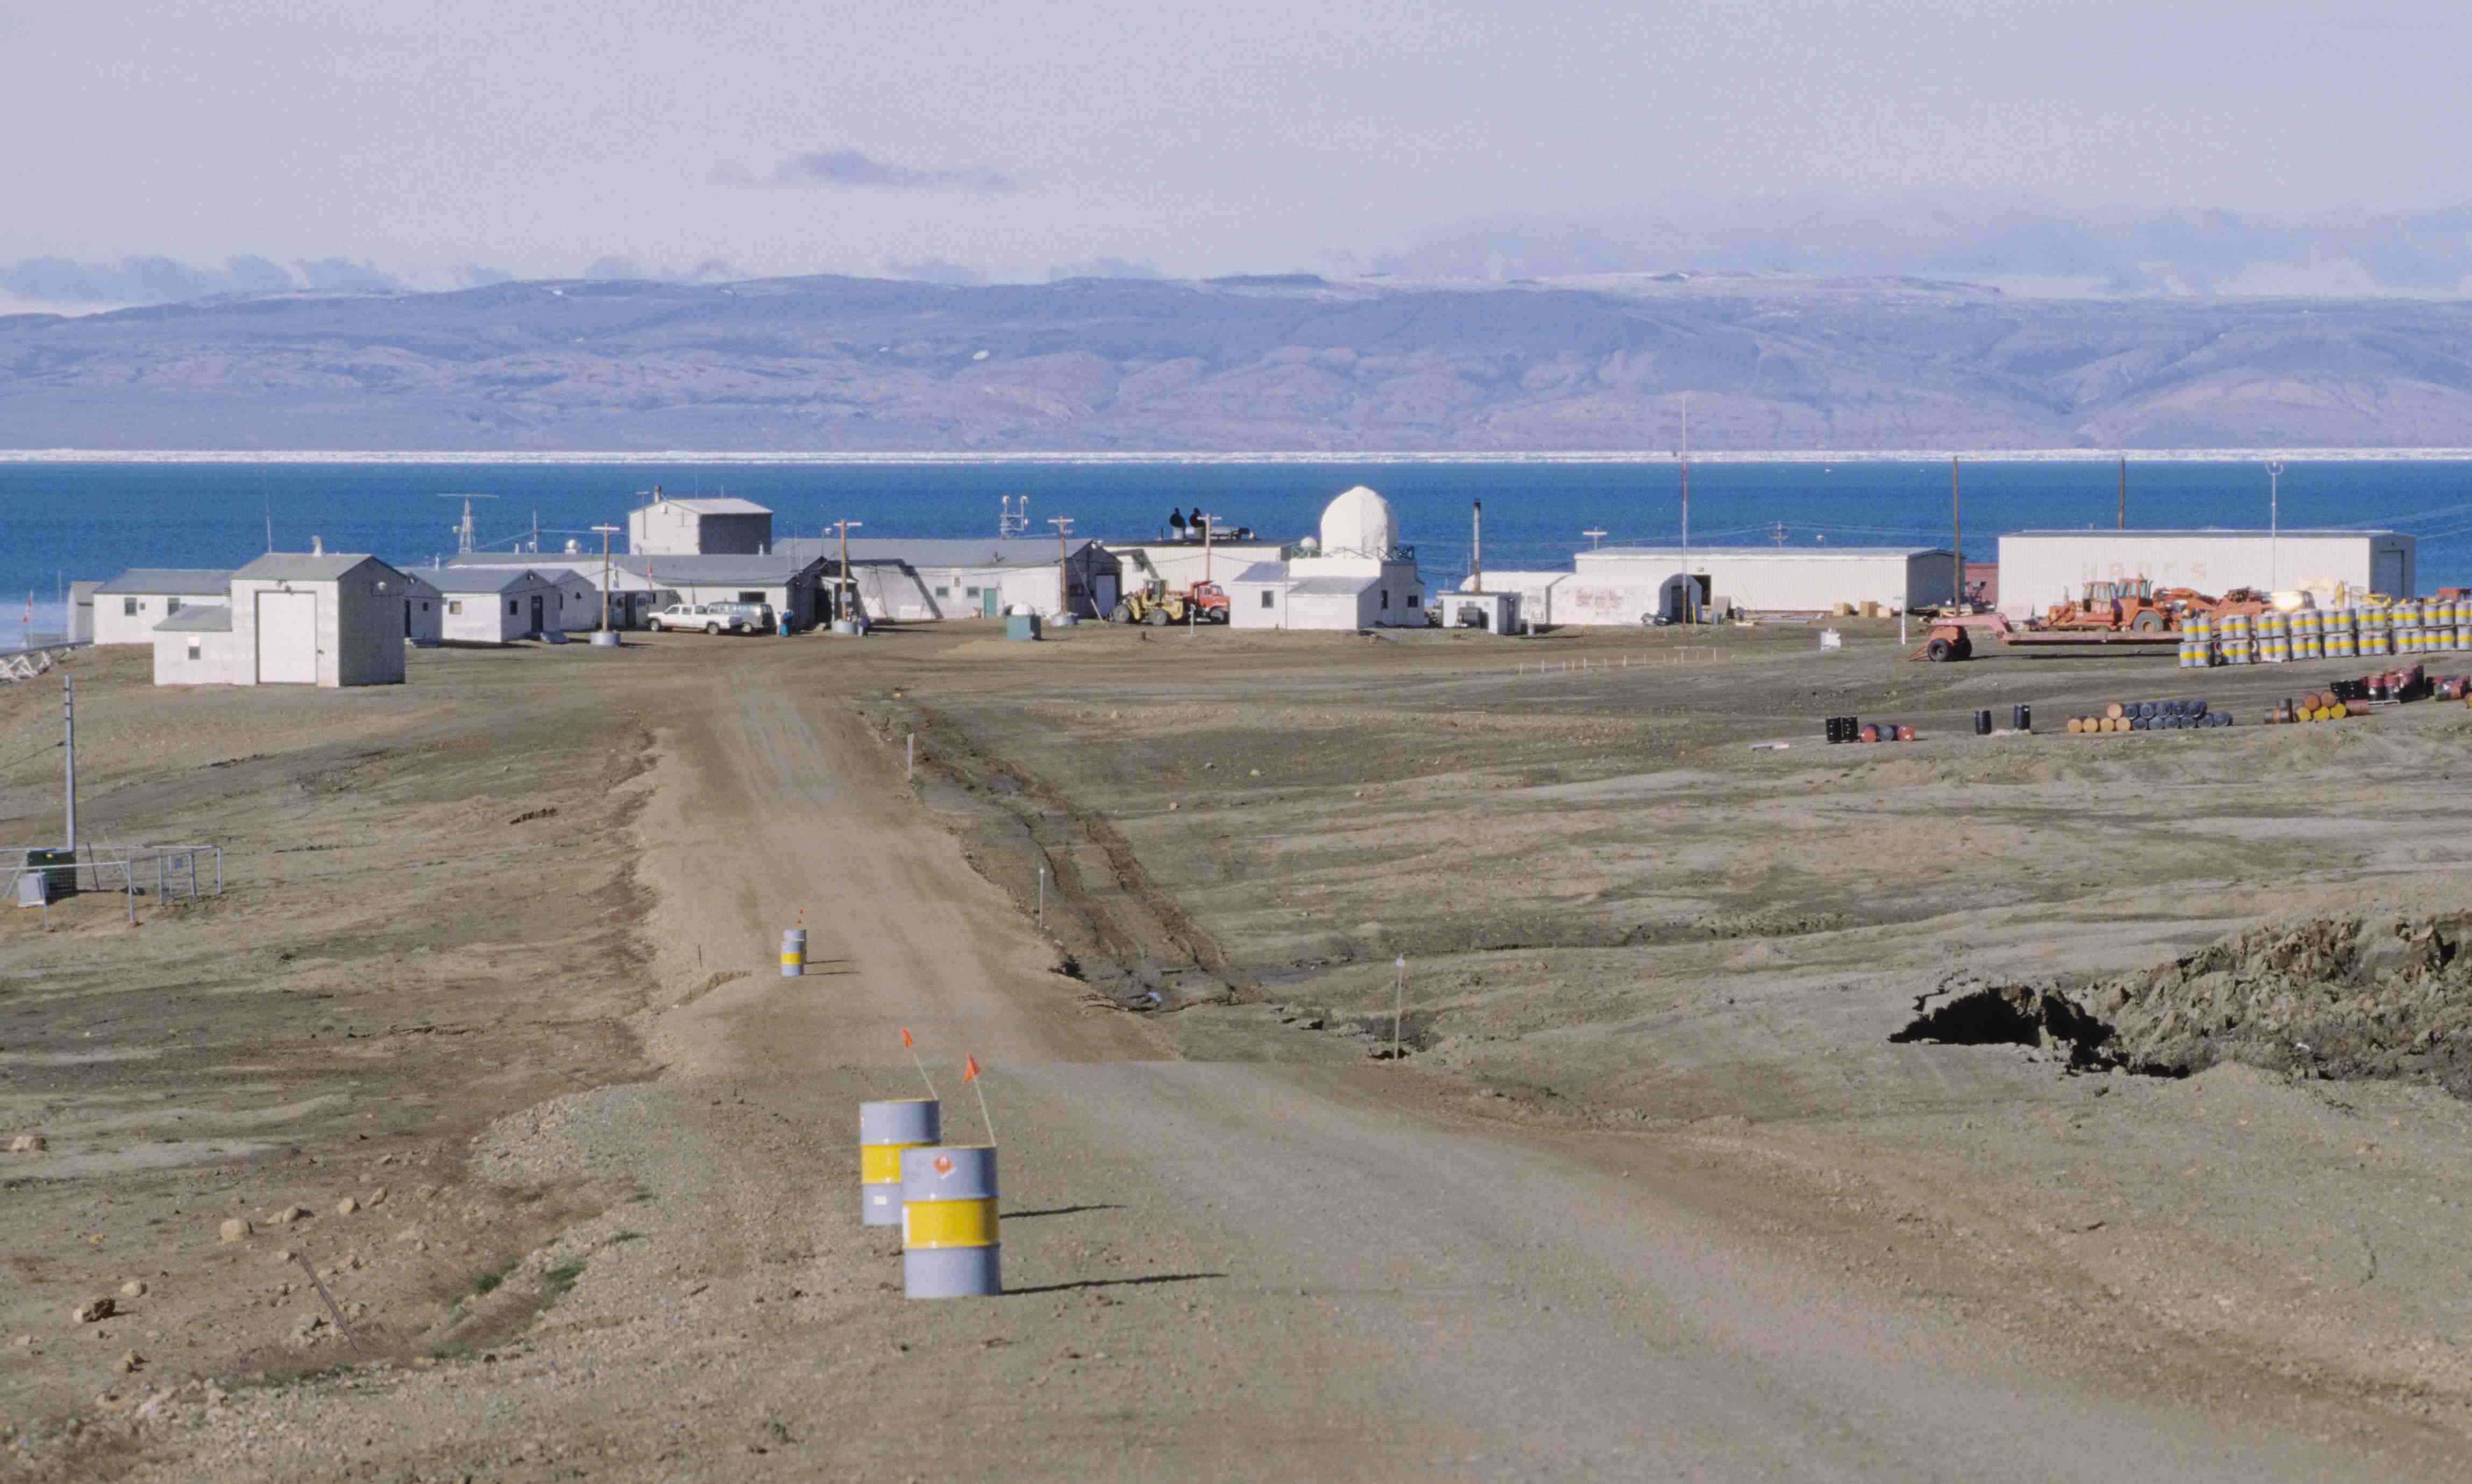
Thanks to Ecotretas for his sleuthing, I’m sure there are many more like this yet to be discovered. It seems with Eureka, more is going on than METAR errors. The temperature rises reported seem impossible given the meteorological conditions, and because they seem to be automated, suggest sensor error or perhaps sensor environment contamination (like a vehicle or other heat source). If you look at this 1997 image from Wikipedia (and click it to get the super hi-res version and pan around) you’ll see a number of vehicles near buildings. Where is the temperature sensor? – I don’t know, but if someone can find out it might shed some light on this mystery.
The fact that the obvious error on July 14th is now cited in Wikipedia as an “all time record high”, when it doesn’t appear in the EC hourly data, is troubling. – Anthony
I would be cautious about conflating the summer month anomalies and temperature excursions with the clearly erroneously entered data during the colder months when temperatures below 0°C are more prevalent and the missing “M” can create a major distortion in the daily mean, and subsequently the monthly mean. And such errors are always in the direction of higher temperatures.
The problem is not with the METARS, it’s the ETARS that really matter.
The calculations don’t lie, but the liars calculate.
Rai LeCotey (Eureka Station Manager) (18:04:04) :
How much more does one need to see before you believe the Arctic is dramatically warming up.
Rai, with all respect, I will be happy enough with a temperature record. I don’t want to believe, I want to know. (And again thanks for being here.)
Some interesting videos around Eureka:
http://www.youtube.com/watch?v=ZDkRT1EjFBo
http://www.youtube.com/watch?v=WFCnGmfe80Y
Ecotretas
Rai LeCotey (Eureka Station Manager)
Thank you, Rai, for your helpful comments. Many (perhaps most) people who follow this site accept that there has been warming in the Arctic and don’t doubt your account whatsoever. I can’t speak for others, but I find your firsthand knowledge invaluable and I hope you’ll continue to help us.
In that spirit, I would be interested in your views on how the Eureka Station records should be used. Should the temperature spikes be smoothed out? Is it appropriate to extrapolate other grid temperatures from your data?
It’s your choice to smooth out the temperature anomilies… however, in my opinion, the temperatures that are being reported from Eureka are not representative of what is aqctually happening especially inland during the summer due to the proximity of our instrument compound to the shoreline of Slidre Fjord. Just 1 km inland, the temperature can be 10-15°C warmer on a warm, sunny, calm day in the summer.
I know from first-hand experience how hot it can get on the tundra, having made a 5-day portage from the Thelon River to the Back in 1985 and 2-day carry from the Hanbury River to the Baillie in 1992. The barrens get quite warm, some days were in the low to mid 30s in July but I attribute that to the sun being up for 20 hours and a lack of wind (which allows the bugs to reach Biblical proportions). Too many times we had to cover our tents with sleeping bags to get out of the heat and wait until 10 or 11 before making dinner because it was too hot.
I imagine that inland from Eureka the terrain radiates heat much faster because there is much more exposed gravels and rock unlike near the Arctic Circle in the Nunavut interior, which has more vegetation and soils to absorb and radiate heat more slowly. I have to wonder if Arctic wind pattern changes over the past few years (a topic of conversation here and likely accounts for the sudden drop in sea ice in 2007) have caused more frequent offshore winds at Eureka and could explain the increasing temperatures that Rai LeCotey (and thank-you for posting here, Sir) has observed of late?
FYI–the wikipedia page reinserted the statement because of the Envirionment Canada data and because a blog is not a reputable source.
Rai LeCotey (Eureka Station Manager) (10:36:00) :
It’s your choice to smooth out the temperature anomilies… however, in my opinion, the temperatures that are being reported from Eureka are not representative of what is aqctually happening especially inland during the summer due to the proximity of our instrument compound to the shoreline of Slidre Fjord. Just 1 km inland, the temperature can be 10-15°C warmer on a warm, sunny, calm day in the summer.
—…—…—…
A more-than-ironic statement, considering that Hansen claims he expands the temperature data from this one station not merely 1 km inland, but apparently more than 1200 km out to sea and well over km 1200 east, west, and south ….
aurbo (21:25:44) :
I would be cautious about conflating the summer month anomalies and temperature excursions with the clearly erroneously entered data during the colder months when temperatures below 0°C are more prevalent and the missing “M” can create a major distortion in the daily mean, and subsequently the monthly mean. And such errors are always in the direction of higher temperatures.
The problem is not with the METARS, it’s the ETARS that really matter.
—…—…—…
We see this explicitly in the 60 years of 80 degree arctic temperatures from the WUWT link on the upper right side of the page.
Symptom: For the entire record, summer temperatures have remained constant at +3 degrees C. NO “M” data expected, none recorded, none required => yields accurate plots with almost NO variation across the entire period when temperatures are entirely “positive.
Spring and fall: As temps go down, the differences from the actual value increase: a +3 deg C averaged into a number of -3 deg records is only 6 degrees wrong. A single +12 deg C averaged into the same number of -12 records is a +24 degree increase. Result? We see a much larger variation in the temperatures daily in both seasons.
Winter: Extreme differences from the actual values (plus 40 in the 1 Jan record shown above!), extreme variation between days and hours, and extreme randomness in the winter temperatures.
Coincidentally, a very “rough” winter temperature means the very, very small change in real Arctic temperatures between 1950 and 2010 is easy to change graphically into a vary large number of GISS red and orange spots spanning tremendous areas of the tundra and Arctic Ocean.
It is heartening to see the numbers who are not fooled by your story. Allthe silly falsehoods I picked up have been commented on by others. It looks like the Climategate hype has resulted in more activity by those still able to think critically. You will have to fact check your stories better or your economic masters will notice a growing triviality .
Nice to see the real weather information from the North: I probably wouldn’t have seen it if you weren’t posting the bushwa.
Someone put the bad info back in to the Wikipedia page (it’s there as of April 26th 2010) ignoring the concerns expressed here. The Wikipedia pages on global warming are dominated by warmists who make sure no skeptical views are included.
Now, if one wants to balance Eureka, try the interior of the Yukon Territories, such as Whitehorse – often the coldest area of Canada in the winter.
One day an airline had to hurry passengers onto a 737, as the way the temperature was dropping they’d soon be below what was allowed for takeoff. But that may have been in the depths of 1970s global cooling. 😉
Well, I haven’t checked summer temps there, I’m on the global cooling wagon. [I joke, perhaps badly.]
What an astonishing tale! I would’ve given odds of 100:1 that the 5.9C, 19.6C, 4.1C hourly data series was corrupt.
But if the Eureka station manager says that there are no gremlins, one is obliged to believe him! (Admittedly, he was writing about the following day’s 20.9C record, but same principle.)
I have been a fierce critic of the AGW theory, and remain highly dubious, but this episode shows that folks like me were maybe too hasty in dismissing the Tales from the Tundra. I will be more reluctant to say, “There’s not the slightest sign of warming where I live: ain’t it funny that it’s only at edge-of-the-world stations, and at beer time, that the thermometer skyrockets.”