First, we pointed this out quite some time ago. See: Winds are Dominant Cause of Greenland and West Antarctic Ice Sheet Losses and also NASA Sees Arctic Ocean Circulation Do an About-Face
Second I’m pleased to see the Guardian finally catching on.You can watch wind patterns in this time lapse animation:

From the Guardian:
Wind contributing to Arctic sea ice loss, study finds
New research does not question climate change is also melting ice in the Arctic, but finds wind patterns explain steep decline.
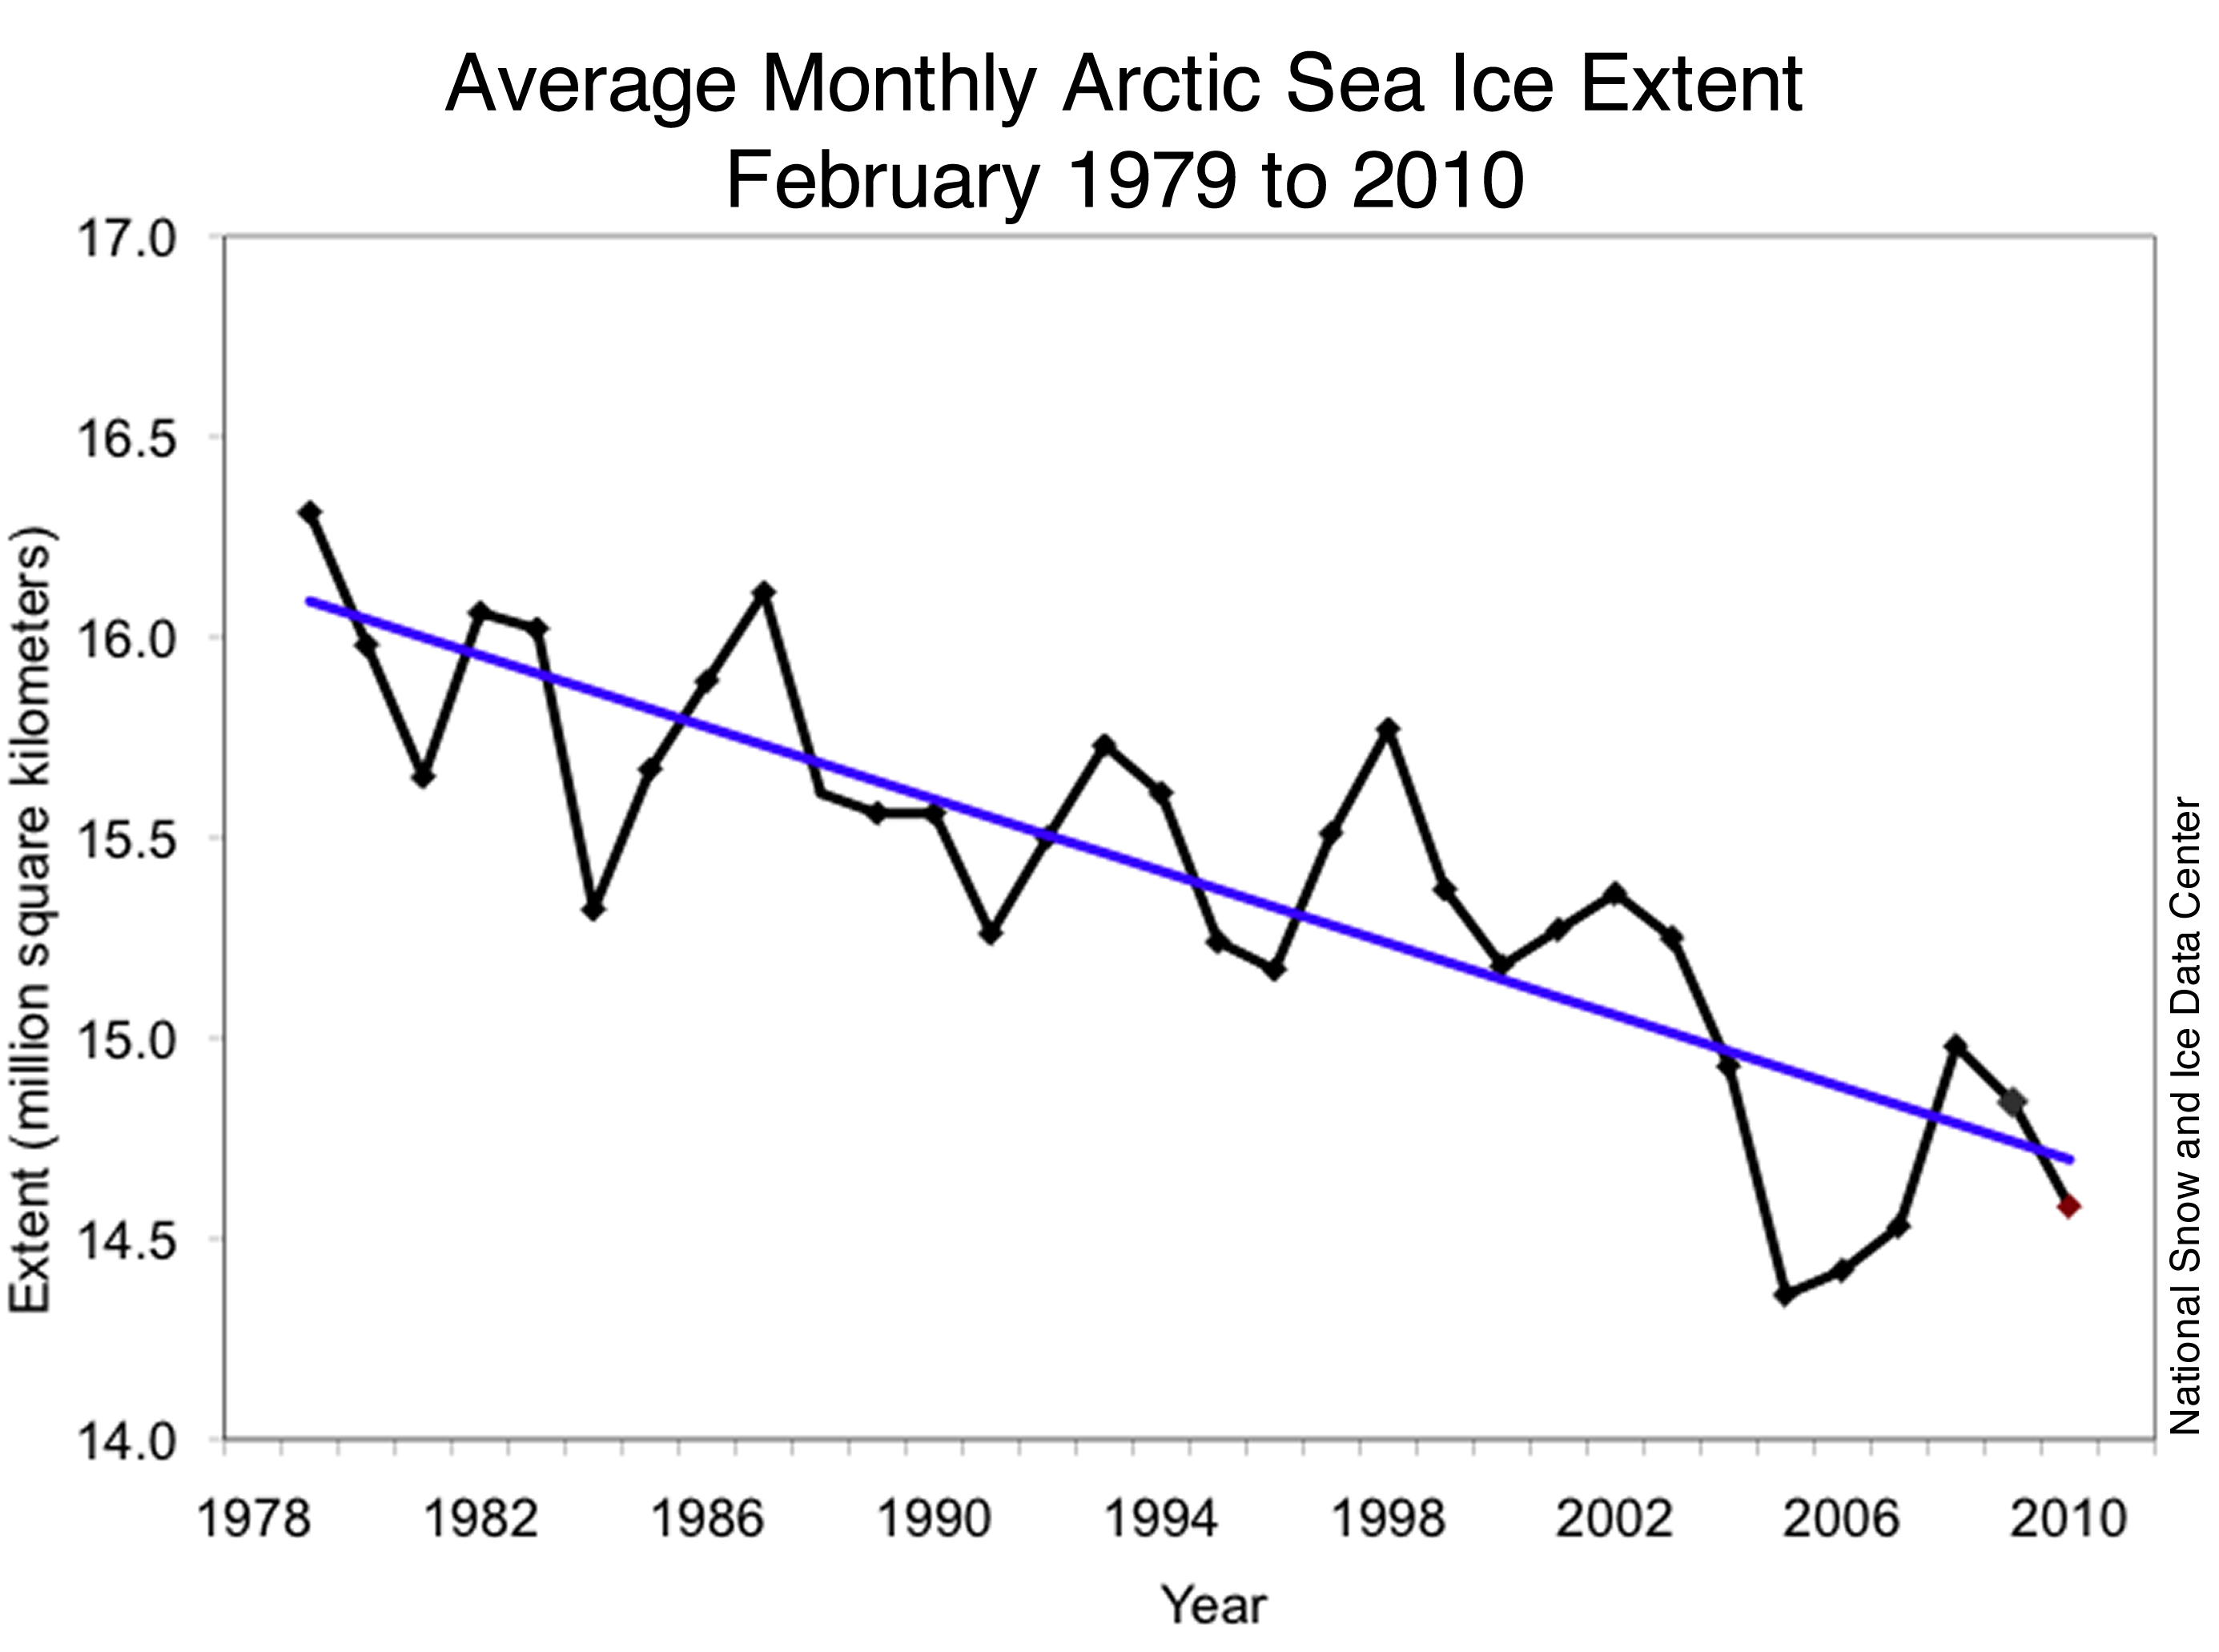
Much of the record breaking loss of ice in the Arctic ocean in recent years is down to the region’s swirling winds and is not a direct result of global warming, a new study reveals.
Ice blown out of the region by Arctic winds can explain around one-third of the steep downward trend in sea ice extent in the region since 1979, the scientists say.
The study does not question that global warming is also melting ice in the Arctic, but it could raise doubts about high-profile claims that the region has passed a climate “tipping point” that could see ice loss sharply accelerate in coming years.
The new findings also help to explain the massive loss of Arctic ice seen in the summers of 2007-08, which prompted suggestions that the summertime Arctic Ocean could be ice-free withing a decade. About half of the variation in maximum ice loss each September is down to changes in wind patterns, the study says.
Masayo Ogi, a scientist with the Japan Agency for Marine-Earth Science and Technology in Yokohama, and her colleagues, looked at records of how winds have behaved across the Arctic since satellite measurements of ice extent there began in 1979.
They found that changes in wind patterns, such as summertime winds that blow clockwise around the Beaufort Sea, seemed to coincide with years where sea ice loss was highest.
Writing in a paper to be published in the journal Geophysical Research Letters, the scientists suggest these winds have blown large amounts of Arctic ice south through the Fram Strait, which passes between Greenland and the Norwegian islands of Svalbard, and leads to the warmer waters of the north Atlantic. These winds have increased recently, which could help explain the apparent acceleration in ice loss.
…
read the complete story at the Guardian
Note the kinks:
http://www.sfu.ca/~plv/CumuSumAO70.png
Related:
http://www.sfu.ca/~plv/zMoonLAC+LNC_CumuIOD.png
Reminds me of the flash game Hell of Sand
http://www.falling-sand-game.com/
From the New York Times, 128 years of looming polar doom:
• 1881: “This past Winter, both inside and outside the Arctic circle, appears to have been unusually mild. The ice is very light and rapidly melting …”
• 1932: “NEXT GREAT DELUGE FORECAST BY SCIENCE; Melting Polar Ice Caps to Raise the Level of Seas and Flood the Continents”
• 1934: “New Evidence Supports Geology’s View That the Arctic Is Growing Warmer”
• 1937: “Continued warm weather at the Pole, melting snow and ice.”
• 1954: “The particular point of inquiry concerns whether the ice is melting at such a rate as to imperil low-lying coastal areas through raising the level of the sea in the near future.”
• 1957: “U.S. Arctic Station Melting”
• 1958: “At present, the Arctic ice pack is melting away fast. Some estimates say that it is 40 per cent thinner and 12 per cent smaller than it was fifteen years [ago].”
• 1959: “Will the Arctic Ocean soon be free of ice?”
• 1971: “STUDY SAYS MAN ALTERS CLIMATE; U.N. Report Links Melting of Polar Ice to His Activities”
• 1979: “A puzzling haze over the Arctic ice packs has been identified as a byproduct of air pollution, a finding that may support predictions of a disastrous melting of the earth’s ice caps.”
• 1982: “Because of global heating attributed to an increase in atmospheric carbon dioxide from fuel burning, about 20,000 cubic miles of polar ice has melted in the past 40 years, apparently contributing to a rise in sea levels …”
• 1999: “Evidence continues to accumulate that the frozen world of the Arctic and sub-Arctic is thawing.”
• 2000: “The North Pole is melting. The thick ice that has for ages covered the Arctic Ocean at the pole has turned to water, recent visitors there reported yesterday.”
• 2002: “The melting of Greenland glaciers and Arctic Ocean sea ice this past summer reached levels not seen in decades, scientists reported today.”
• 2004: “There is an awful lot of Arctic and glacial ice melting.”
• 2005: “Another melancholy gathering of climate scientists presented evidence this month that the Antarctic ice shelf is melting – a prospect difficult to imagine a decade ago.”
@Phil. (16:35:11) :
Philhippos (12:43:37) :
Not directly relevant to this item but I can’t get into Notes & Tips so I ask it here.
My question is: If CO2 had a colour would we be able to see its presence in the air at its present or predicted concentrations? If, as I suspect not, then making this clear would help to convince many more people that it cannot be relevant.
Yes, just like we can see the color of the low concentration impurities in sapphires, emeralds, rubies etc. which would otherwise be colorless.
– – – – – – –
Phil, I’d be hesitant to make that conclusion based on the physical properties of a solid, whereas CO2 is a gas, at least above -57 deg C. I have my doubts that the average person would be able to visually detect a colored gas at 380 ppmv. If you’d like to perform an experiment to get a much better idea about that [SEE CAUTION BELOW], bleed some Ozone from a lecture bottle into an air filled glovebox and adjust the Ozone concentration to 380 ppmv. Ozone is a pale blue gas. If you cannot see the Ozone at 380 ppmv, just keep increasing the concentration until you can. Just be sure to vent the exhaust port into the rear of a fume hood or to the outdoors, since concentrations above 0.1 ppmv can cause adverse reactions in some persons.
Let’s see if we can convince “Mythbusters” to do the experiment for us, since most people don’t have this kind of equipment in the chemistry lab in their basement. 🙂
CAUTION: Kids, don’t do this at home, concentrated ozone is explosive!
I’m totally agog over this. What great news! The wind is blowing out the rotten ice and new clean smelling ice is moving in just in time for the next great Catlin arctic explorers. Oh, I hope the new ice does smell new and has not lost it’s smell like the roses. The explorers need all the help they can get.
George E. Smith (13:25:11) :
“”” Philhippos (12:43:37) :
Not directly relevant to this item but I can’t get into Notes & Tips so I ask it here.
My question is: If CO2 had a colour would we be able to see its presence in the air at its present or predicted concentrations? If, as I suspect not, then making this clear would help to convince many more people that it cannot be relevant. “””
Well in order to have a color it would need to be reflective (or emissive) somewhere in the visible spectrum, since color is a special property of the human eye. We have no idea what “visible radiation” looks like to any other species.
We don’t seem to be able to see any other component of the earth atmosphere either; including water vapor, which is far more prevalent and energy absorptive than CO2, so I would say the answer is no.
Put some iodine crystals in a flask and leave them to equilibrate at room temperature, and you should see a violet vapor (the vapor concentration is about the same as CO2 in the atmosphere).
http://upload.wikimedia.org/wikipedia/commons/8/84/IodoAtomico.JPG
22 March: BusinessWeek: Kim Chipman: Democratic Senators Push for Climate Bill This Year (Update1)
Senators Lindsey Graham, a South Carolina Republican, John Kerry, a Massachusetts Democrat, and Joseph Lieberman, a Connecticut independent, have been working to craft climate- change and energy legislation after attempts by other lawmakers stalled in Congress last year. Graham said March 18 that a measure won’t be introduced until at least next month..
The senators are being very constructive,” Bruce Josten, executive vice president, government affairs for the chamber (of Commerce), said in a statement. “They are trying to figure out how to make this work for the American economy.”
The 22 senators today said that bipartisan legislation has the support of more than 80 of the largest manufacturers, businesses, national security experts, veterans’ groups, labor unions and religious organizations…
http://www.businessweek.com/news/2010-03-22/democratic-senators-urge-considering-climate-bill-this-year.html
Global warming causes Congressional insanity.
It’s hard to claw back credibility, isn’t it?
http://www.telegraph.co.uk/earth/environment/climatechange/7498279/Climategate-inquiry-led-by-oil-boss.html
“His past working in the fossil fuels industry will make environmentalists cautious, but he has also shown an interest in the environment and is currently president of the Carbon Capture and Storage Association and Falck Renewables.”
Mike,
“Spread of ice mass loss into northwest Greenland observed by GRACE and GPS…”
Do you have a point? Anybody can link to any website. Typically for WUWT, it’s customary, or at least courteous, to comment on the link referenced.
pat (17:44:27) said:
Yes, it’s always for the economy or the children or the baby polar bears.
R. de Haan (14:05:11) :
The unbeatable logic of Joe Bastard!
I have my own “channel.” Today’s interesting video shows how the warmth that the GISS data shows doesn’t jive with the global sea ice. If it’s so darn warm, how is it there is so much ice?
The recent minimum in global sea ice according to CT was the 3= lowest since 1979 and the lowest for three years.
In fact, Southern Hemisphere sea ice, in spite of Goddard showing it warm down there, had the least ice melt in their summer than I have seen on the whole graph on the cryosphere today.
I suggest you take a closer look, the ice melt this season was greater than last!
And as warm as the arctic was, how is sea ice so close to normal?
Because the winter temperature mainly controls the ice thickness and the extent is controlled by the landlocked nature of the Arctic.
ScuzzaMan (16:22:47) :
“In the Daily Mean Temperature graphs (posted by IBRAHIM, near the beginning of this thread) the area above the Melt line is very regular, varying only within a small range for a small number of days in each year, at high summer.
During the winter months, the averages vary wildly from year to year, with quite startling departures from the “norm”.
I am wondering what this pattern suggests about the way that temperature “anomalies” are popularly interpreted in the context of GW theorising?”
http://ocean.dmi.dk/arctic/meant80n.uk.php
Indeed. I’ve never understood why this simple fact is overlooked by the forecasters of imminent doom. The plot shows that for only about 70 days each summer the temperature in this region (above 80 degrees north) rises a degree or two above freezing, and this is a relatively stable pattern. Anomolous temperature swings are wilder and more frequent in winter, and these are the numbers that have a disproportionate effect on (what many of us laughingly call) the global average temperature, you know, the thing that others believe means that we’re all gonna fry sometime soon.
For those in whom this elicits panic, I suggest you calm down. Whether ice is at -25C or -35C, it doesn’t care. Nothing changes, except perhaps the crystalline structure to some small extent. Melting is the furthest thing from its agenda.
I think what gets people worked up is that when the temperature rises from “you’ll die unless you find shelter” to merely “freezing your nuts off”, it shows red on anomaly maps and makes simple folk think there’s a “hot spot” up there. To those who choose to believe that, I invite you to take a trip there and stand around for a while in your Speedos (aka budgie smugglers in Australia) and see how long you last.
Given these ranges, it is clear that air temperature can only be a marginal factor in variations in sea-ice melt in high latitudes. The major culprit must be the sea, which is by definition above melting point, and when it is a couple of degrees above its own freezing point potentially contains enough heat to supply the required latent heat of fusion to melt the ice immersed in it. The issue then comes down to the currents and winds extant in the region at any point, and their capacity to move warmer water to where the ice is or shift the ice towards where the sea is slightly warmer. The specific heat of air is such that it doesn’t have the capacity to melt much ice until it has a few degrees of warmth in it.
Wind direction and strength is in my view the most overlooked feature of climate, right up there with cloud cover. In Sydney, at the height of summer we often have 38C/100F + days caused by north westerly winds, gratefully terminated by a southerly change in the evening that drops the temperature by 15C in twenty minutes. The change of seasons too, as everywhere, is marked by shifts in the prevailing wind direction, which has as much effect on temperature as the insolation strength (including any supposed GHG radiative forcings) on any given day.
Now my question is, what have wind conditions gotta do with any trace gas? I eagerly await proof from the warmosphere that there’s a connection.
toyotawhizguy (17:27:09) :
@Phil. (16:35:11) :
Philhippos (12:43:37) :
Not directly relevant to this item but I can’t get into Notes & Tips so I ask it here.
My question is: If CO2 had a colour would we be able to see its presence in the air at its present or predicted concentrations? If, as I suspect not, then making this clear would help to convince many more people that it cannot be relevant.
Yes, just like we can see the color of the low concentration impurities in sapphires, emeralds, rubies etc. which would otherwise be colorless.
– – – – – – –
Phil, I’d be hesitant to make that conclusion based on the physical properties of a solid,
Why, the color is due to the presence of metal ions?
whereas CO2 is a gas, at least above -57 deg C. I have my doubts that the average person would be able to visually detect a colored gas at 380 ppmv.
I’m sure that most people would be able to see the color of iodine vapor at that concentration.
gofer (17:26:18) :
From the New York Times, 128 years of looming polar doom:
• 1937: “Continued warm weather at the Pole, melting snow and ice.”
How did they know?
Bill Marsh (12:54:28) :
VeryTallGuy (12:15:38) :
Hello, anyone read the article ?
“Arctic winds can explain around one-third of the steep downward trend in sea ice extent”
ie the other two thirds is due to warming.
Even at the most simplistic reading this is yet another study backing up the consensus on warming. Why commenters here think it challenges that is genuinely bemusing.
=============
Seems like a ‘jump to conclusion’ on your part. It isn’t necessarily true that because changing wind patterns explain 1/3 of the decline that the remaining 2/3 is due to ‘global warming’ (whatever that may actually mean).
A ‘jump to conclusion’ on your part actually, you were the one who first mentioned ‘global’!
R. Gates (16:52:33)
“This is an unproven assertion, not in line with the known global circulation of ocean currents…both in depth and extent.”
Since as Bob Tisdale asserts, virtually nothing is known about deep ocean circulation, the requirement for a statement to be “in line with the known global circulation of ocean currents” is not a very stringent one.
Smokey @ur momisugly 14:54:45….right on!
On watching this animation, besides being mesmerizing…it vaguely resembles a beating heart.
Chris
Norfolk, VA, USA
worth reading all:
22 March: BusinessWeek: Microdyne, Broker of Used CERs, Isn’t on CO2 Markets (Update1)
by Catherine Airlie, Mathew Carr and Zoltan Simon
Editors: Mike Anderson, John Buckley.
Microdyne, which bought and resold United Nations carbon offsets already used by an emitter in Hungary, said a “typing mistake” misrepresented the company on its Web site as a member of the three emissions exchanges. “It was fixed when we found out about it,” the company said in an e-mail today in response to written questions from Bloomberg…
Anvar Kasimov, listed as Microdyne’s owner on the March 18 letter, couldn’t be reached at the telephone numbers listed on the correspondence and the Web site at http://www.microdyne-uk.com. A person answering the phone today at its office at 55 Bryanston Street in London declined to give his name and said the company would respond to questions by e-mail.
Patrick Birley, chief executive for the London-based European Climate Exchange, said Microdyne isn’t an ECX member…
http://www.businessweek.com/news/2010-03-22/microdyne-broker-of-used-cers-isn-t-on-co2-markets-update1-.html
savethesharks (19:17:43) :
Smokey @ur momisugly 14:54:45….right on!
On watching this animation, besides being mesmerizing…it vaguely resembles a beating heart.
Chris
Norfolk, VA, USA
————————
I had the same thought at about the same time, but I also had the realization that the ice and snow in the arctic is the only source of fresh water, in the entire area for seals, people, and polar bears.
So the ice is the beating heart of fresh water that sustains life in the arctic.
Due to it’s extremely fragmented nature and constant movement, if a polar bear just sits and waits, food presenting conditions will show up soon.
Much like when the huge herds of Bison roamed the mid-western USA, until somebody wanted to make a power grab for the land.
George E. Smith (12:02:59) :
> The Linus Pauling cost me $21; the modern supertext a whopping $157. It’s a bit easier to read; but that’s the most I have ever spent on any Book.
I went to CMU around 1970, I still have a Don Knuth “Art of Computer Programming” volume 3 (“Sorting and Searching”). I moved the price tag inside – $19.50. Assuming the books are equally “supertexts, that’s a 8X increase.
http://www.usinflationcalculator.com/ says $19.50 then is $108.93 now, a 5.6X increase. Somewhere in the ballpark….
Phil. (18:40:32
In fact, Southern Hemisphere sea ice, in spite of Goddard showing it warm down there, had the least ice melt in their summer than I have seen on the whole graph on the cryosphere today.
I suggest you take a closer look, the ice melt this season was greater than last!
Looking at this CT graph it would appear neither of you is entirely correct
http://arctic.atmos.uiuc.edu/cryosphere/IMAGES/seaice.area.antarctic.png
On a related point, I recently had occasion to Google the area of the lower 48 States to double check before posting a comment on another thread. What I found was a rather surprising range of values. I later went back and repeated the process for about a dozen other land masses. The pattern persisted. The question that arises is that if our wonderful technology can’t come up with a consistent number within a couple of hundred thousand km2 for something as relatively invariant as these land masses, why should we have any confidence in their ability to measure something as amorphous as sea ice, which is by definition 85% water at the margins, with much higher accuracy, as indicated by their tendency to report sea ice down to single digit km2?
Here they are new (nominally used) for $20:
http://www.amazon.com/gp/offer-listing/0217867561/ref=sr_1_5_olp?ie=UTF8&s=books&qid=1269316793&sr=1-5&condition=new
Flyover by a scout plane? They had such things in Alaska at the time.