By Steven Goddard
Last month we discussed how NASA continues to spread worries about the Antarctic warming and melting.
A January 12, 2010 Earth Observatory article warns that Antarctica
“has been losing more than a hundred cubic kilometers (24 cubic miles) of ice each year since 2002” and that “if all of this ice melted, it would raise global sea level by about 60 meter (197 feet).“
[Note that is continental ice, not sea ice, – Anthony]

NASA’s 1982-2007 map showing Antarctica warming

But NSIDC seems to be thinking differently in their March 3, 2010 newsletter. They say Antarctica is cooling and sea ice is increasing (makes sense – ice is associated with cold.)
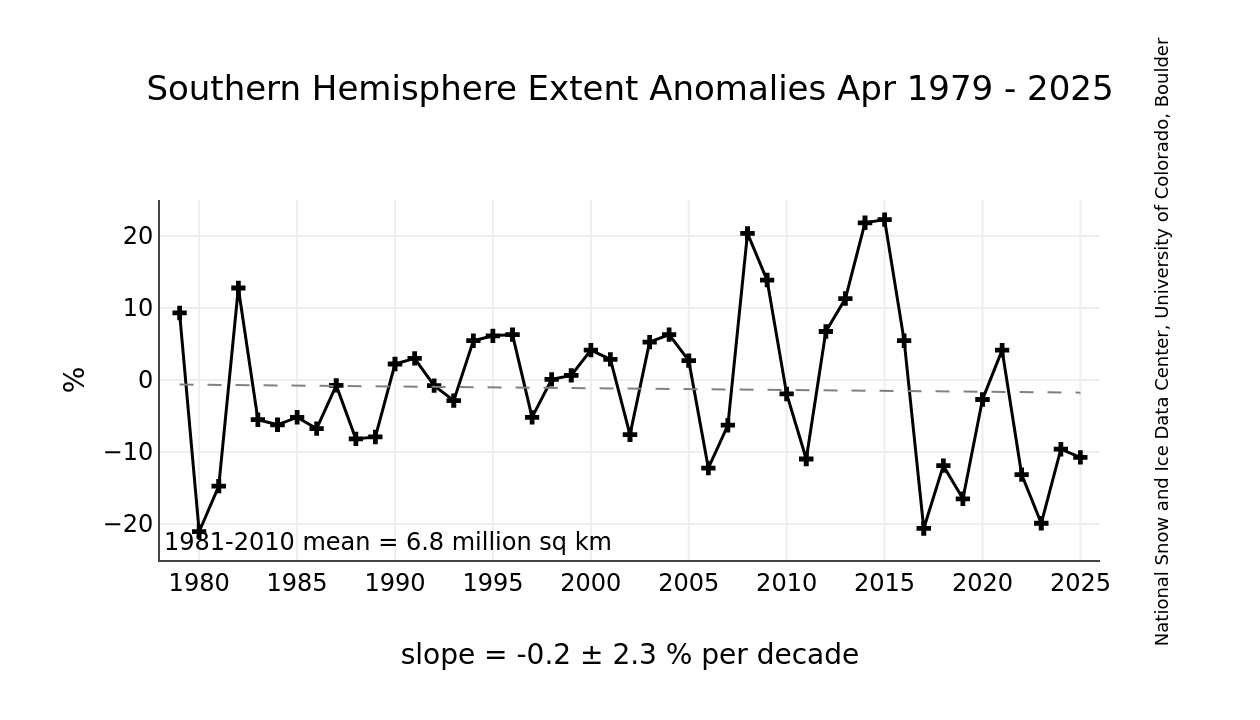
Sea ice extent in the Antarctic has been unusually high in recent years, both in summer and winter. Overall, the Antarctic is showing small positive trends in total extent. For example, the trend in February extent is now +3.1% per decade. However, the Amundsen and Bellingshausen Seas show a strong negative trend in extent. These overall positive trends may seem counterintuitive in light of what is happening in the Arctic. Our Frequently Asked Questions section briefly explains the general differences between the two polar environments. A recent report (Turner, et. al., 2009) suggests that the ozone hole has resulted in changes in atmospheric circulation leading to cooling and increasing sea ice extents over much of the Antarctic region.
The NSIDC graph below shows the upwards trend in Antarctic Sea Ice. Some recent years have shown anomalies as high as +30%.

http://nsidc.org/data/seaice_index/images/s_plot_hires.png
UAH satellite data also shows Antarctica cooling, as seen in their map below. (This map is dated November, 2006 – if anyone knows where to get a more recent version, please let me know.)


UAH 25 Year Temperature Trends
Perhaps NASA should have stuck with their original 2004 map below, showing Antarctica’s interior cooling?

NASA’s 1982-2004 map showing Antarctica cooling

While there’s no dispute that there’s some sea ice loss in the Antarctic peninsula, all signs seem to point in the opposite direction of what some what have you believe about Antarctica as a continent.
Sponsored IT training links:
We offer self paced 312-50 training with up to date 642-611 dumps and 70-450 practice test to provide guaranteed success in first dive.
Note to Earth Observatory: I was raised in Webster Parish Louisiana, Area 595 sq mi. If you could figure out how to contain the water, your 24 cu miles of ice would cover that parish with 191 feet of water. How ever the 41,000 people who live there would not be happy.
Shona (01:05:34) :
And I would like to know how people are already saying that 2010 will be record hot, when it’s only March. Are they astrologers or something?
You don’t think that “or something” has anything to do with the fact that “they” have their fingers controlling the machines measuring what defines what “hot” is? You’ve got a good question, how do they already know ten months in advance?
Regarding Glaciers:
Glaciers: Science and Nonsense
http://www.geolsoc.org.uk/gsl/site/GSL/lang/en/page7209.html
From the current issue of the Geological Society
Worth a read
Sea ice is floating on warm water, the base of the ice being in thermal equilibrium with the sea water. If that water gets just a little bit warmer, you’re going to get a lot more melting, with the floating ice turning into more water. Big deal, the displacement remains the same so sea level doesn’t rise significantly.
Ice on land is not in thermal equilibrium with anything that is above melting point so the same rules don’t apply. During the winter the sun doesn’t reach Antartica at all for 6 months. It is also high up. Consequently winter temperatures are -60Celsius. But the Summer only gets as warm as -30Celsius. SO HOW CAN THE LAND ICE MELT!!!!
It can’t. The earth would have to warm enormously for ANY of the land ice at Antartica to melt at all. But notice how the doom-merchant scientists are all so happy to conflate melting sea ice with the concept of rising sea levels due to melting land ice. It’s nonsense, and this hokum is just designed to pull the wool over the eyes of those that are suggestible and easily hoodwinked by the snake-oil salesmen. Why they are doing it I can only guess, but these “scientists” are not to be trusted.
I’d love to see the data that they are using to claim that the globe warmed again in 2009-2010 winter.
The CBC was making the claim that Canada had a very warm winter this year. I’d love to see their data.
Anyone where the data sets for these groups are kept?
What I find really annoying is that people go on the airwaves or the media and make all these wild claims, many of which are counter intuitive, without any supporting data or links to web pages that show their work IN FULL DETAIL! It’s at the point where I now always want to see their work in full detail just to understand what they are saying and to have a chance at seeing what games they are playing fast and loose with the data or statistics or interpretations.
Obviously North America has had a strange winter with the south being really cold and Canada allegedly having a bit warmer of a time although I don’t recall the news about that as the cold was happening up here in the great white north (in Vancouver we call it the Great Green North… puff).
Strangely the forecast for Tuesday March 9th (10 days after the Olympics ended) is a 40% chance of snow flurries for Greater Vancouver Area including the local mountains which were devoid of natural local snow during the games! Also the cherry trees were blossoming over the weekend a wee bit early… last week it was 12c this week it’s -4c! Yikes spring interrupted as usual in Vancouver.
R. Gates wrote: “Meanwhile, at 14,000 ft. in the troposphere, global temps have set new 20 year record highs every day in March, and 2010 remains on track to be the warmest year on instrument record. Along with the long term condition of Arctic and Antarctic sea ice, these kinds of troposheric records I watch closely.”
Are these record temperatures because increased cloud cover below 14,000 feet is reflecting more heat upwards or at least preventing it from going downwards? In other words is the widespread cold/cloudy/snowy N. Hemisphere winter producing this heat upsurge at higher levels?
This would fit with the theory of more clouds when the sun is quiet. It would also fit the observations that heat discharge from the sun does not change a great deal (why AGW supporters reject it as a major cause of warming I think).
Similar heat volume coming in from the sun but less heat reaching the ground = higher temperatures higher up in the atmosphere. The heat has to go somewhere. It is simply that more of it is blocked off from reaching the ground.
So ironically could it really be that ‘hottest year/month on record’ = coldest year month on record’ but in a different place, i.e. at a different altitude?
Two separate issues:
Climate is real
Climate Change is a misnomer
—————————————————————-
Climate Science, the study of weather and climate.
Climate Change Science, the product of hearsay and propaganda.
—————————————————————-
Two separate scientists:
Climate Scientist, studies weather and climate.
Climate Change Scientists, issues hearsay and propaganda for a collective cause.
—————————————————————–
It is very easy to tell the difference between a Climate Scientist and a Climate Change Scientist. All Climate Change Scientists suffer from a condition known as Illusory Superiority complex, think Mike hockey stick Mann, Mad hatter James Hansen, Phil my shadow scares me Jones etc.
Climate Science is real. Climate Change Science is an illusion for the collective scientific misfits that would be found out about in an instant in any other branch of science.
Clearly the 30 year Antarctic trend is increasing. Another hit to GW.
By the way, :), are there readers here who could give Donna Laframboise a hand?
http://nofrakkingconsensus.blogspot.com/2010/03/help-audit-un-climate-report.html
Hope you WUWT does not mind my recruiting here. If so, just delete this post.
I think it would be interesting to check some references. This way the IPCC will never again think nobody is ever going to take the time to check them out.
I think Wayne nailed the problem (strange Antarctic ice loss measured using satellite). I happen to live in an area where the land is rising after the last ice age. In southern Finland this is ca. 3 mm/yr. It has been estimated that the ice layer here was 1 … 2 km thick during the ice age. A 0.7 mm/yr subsiding is actually a very small value compared to the presently measurable opposite process here. Further north where the ice melted later and where ice layers may have been thicker the land rises 10 mm/yr.
Perhaps this could provide a starting point for an alternative way of looking at the ice cover of Greenland. By measuring the sea level over a long time at a few points along Greenland’s coast one should be able to directly see if the ice load on top of Greenland increases or decreases.
D. Patterson (01:37:51) : (responding to R. Gates (21:19:02)) As water goes through a phase change from a gaseous vapor…
Enlightening, D. Patterson! Thank you.
Another trend that is not statistically significant.
Anthony,
I am about to show you why understanding the mechanics of what is happening in the antartic and planet is important.
We have been studying this planet as a circle and not a rotating body. The factors of a rotating body are much more different.
The axis of the planet runs through this area. Now because the planet rotates, the equator has a much larger measurement of distance in circumference. As you go to the poles the planet is smaller and smaller in distance in circumference.
The prevailing winds would always be moving one way. Notice the ice build up is consistant to forming on the side where least wind and waves would break them up.
The agonizing death rattle of AGW.
Mr. AGW, he dead.
…-
“EU climate chief delivers treaty blow
The world will almost certainly fail to draw up a new treaty on climate change this year, the minister in charge of last year’s Copenhagen summit has admitted, delivering a heavy blow to the barely flickering hopes for a swift global settlement.
Connie Hedegaard, the Danish minister who masterminded the summit of world leaders on global warming last year and is now the European commissioner for climate change, told the Financial Times negotiations were not progressing fast enough for a treaty to be signed soon.
She also gave warning that pushing too hard for a treaty this year could be counterproductive.
“To get every detail set in the next nine months looks very difficult,” she said. “Europe would love that to happen, and I would love that to happen … but my feeling is that it is going to be very difficult to get a treaty.”
Her pessimism echoed that of the outgoing United Nations climate change chief, Yvo de Boer. He told the FT as he resigned last month after four years of seeking an agreement that he could not see a treaty being signed this year.”
http://www.freerepublic.com/focus/f-news/2466962/posts
http://www.bluelikeyou.com/2010/03/08/how-will-climategate-affect-earth-hour/#comment-76592
NASA says
“The answer boils down to the fact that ice can flow without melting.”
————–
Reply:
That’s a rather weird sentence; melted ice isn’t ice at all; it is water.
Everybody knows glaciers don’t stop moving in their wintertime. Solid rock flows all the time–at sufficient P & T it becomes plastic and deformation ensues. Most of the earth below the crust (called the Mantle) is plastic. Note: glacial ice is actually a “rock”; it meets the definition of a monomineralic rock; individual ice crystals in continental or glacial ice qualify as individual mineral entities.
Should Antarctic ice loss be factual, I see several possibilities:
1. There is actually a “tipping point” in ice flow; a warming of ~1 degree increases the rate of plastic deformation.
2. The Antarctic ice sheet is being warmed from beneath by an increase in subsurface continental heat flow. (Recent studies indicate some of the valleys in the Antarctic continent are actually filled with liquid water.)
3. The earth is suddenly spinning faster, causing centripetal forces to push ice to the periphery of the continent.
However, as Ryan Stephenson pointed out above, Antarctica is way below freezing in the summer months and much colder in the winter months. Besides, what warmth is imparted to the surface of the Antarctic during the summer isn’t going to penetrate that vast ice mass very deeply.
There may be some validity to my point #2 above, but the others are unsubstantiated. And I don’t see how ice loss in the Antarctic can be tied to the moderate warming the earth has experienced since the last Little Ice Age.
Question?
Why would the Ice cap melt when the air temp is normally below freezing?
Reading Jon Stephenson’s book ‘Crevasse Roulette’ about the first Trans – Antartic Expedition, I was impressed by the depth of this ice and the temperatures experienced by these men and their machines.
Steven (and other experts):
Interesting, but I have a question regarding the role of the ozone layer. The NSIDC claims that the Antarctic sea ice increased because of cooling due to the ozone hole and refers to a report by Turner. I have been reading parts of that (very lengthy) report and it states that in recent years there was no further decrease (perhaps even some recovery) of the ozone. So how can the ozone hole be held responsible for the continuing 3% yearly increase of sea ice there?? As far as I can see the ice increase has certainly not flattened since let’s say 1995.
Naturalverities,
People like Al Gore and James Hansen have done everything they could get people alarmed about massive sea level rise from melting ice caps. When Hansen’s organisation – NASA – publishes an article about Antarctic melt, saying “if all of this ice melted, it would raise global sea level by about 60 meter (197 feet).“ they are fanning the fire.
Perhaps the NASA article should be rewritten? Sea level is rising at 30 cm/century, considerably less than the average for the last 16,000 years.
It’s obviously not temperature doing it,
so it must have something to do with moisture in the air.
Isn’t AGW supposed to put more moisture in the air?
The Ozone hole doesn’t even appear each year until after Antarctica reaches its peak sea ice extent. How could it be the cause of it?
There is an interesting push-pull going on between the Arctic’s and Antarctica’s magnetic fields. There are 3 distinct periods each lasting about 120 or so years (AMO period ~ 60 years).
http://www.vukcevic.talktalk.net/LFC14.htm
1600 to 1720+intensities of the vertical Z GMF are moving in opposite directions with the North changing at twice the rate.
1720+ to 1840-50 both North and South Zs are falling at roughly same rate.
1850 onward the North Z has hardly changed, while the South Z has lost about 20% of its value.
Considering that the strong ocean currents in both areas (Circumpolar in Antarctica and number of currents in the Arctic sea) are controlling transfer of hearth along oceans’ conveyor, it is possible that above referred variations, would have (electro-magnetic) effect on the saline currents velocities, and so have noticable impact on the regional temperatures anomaly.
More GMF graphs: http://www.vukcevic.talktalk.net/GandF.htm
A follow-up article on this Anarctic trend (which agreed, is not statistically significant in the long run) would be to find atmospheric/oceanic conditions that trend in correlated ways. That coupling may indeed be significant. I would be fishing around for data tied to that rather large body of water circling said ice trend and would also be asking questions about atmospheric oscillations one might find at that pole. The fact that Europe was cold this winter and Washington DC got loads of snow may not offer much understanding of Antarctic ice oscillations. One thing is for sure, the IPCC report has little to offer us in this area.
Applying my climate theory this is what should be happening:
i) Normally the Arctic will warm and the Antarctic will cool during a period when the climate system is gaining energy. Vice versa when the climate system is losing energy as now. Pointing to a relatively warm troposphere is not relevant here because a warm troposphere is generally an indication of net overall system cooling as energy leaves the oceans faster on it’s way to space.
ii) The reason for the two poles behaving differently is that one is an ocean surrounded by land and the other is land surrounded by ocean as I have explained elsewhere.
iii) I consider that the climate system entered a cooling mode around 2000 as evidenced by the start of a shift in the air circulation systems equatorward. That would be consistent with the Antarctic interior starting to become lesss cold.
iv) During a cooling period the air circulation systems wander more latitudinally than during a warming period because the expansion of the tropics does not constrain their latitudinal movements so much. Consequently one sees more flows of air into and out of the polar regions than occurs during a warming period.
v) So now what is happening is a slightly less cold Antarctic interior probably resulting in greater sublimation (but not melting) of ice in the interior but at the same time the outflowing cold air over the surrounding oceans is creating more sea ice.
Remember that the Antarctic is not a single climate zone. The interior is a climate zone of it’s own but the sea ice areas around it are an entirely separate zone.
Furthermore during a global warming period one would expect the sea ice to reduce as the interior becomes colder because the faster and tighter wind flow around the Antarctic will eat away at the margins of the sea ice constantly and the sea ice will not be renewed by so many cold outflows from the interior.
Thus both reports could be correct (though I doubt the suggested scale of the ice loss in the interior) and in accordance with my climate description. It is merely the interpretations that are wrong.
The map shows a blue to red difference of just 0.2 degrees, how on earth can such a tiny fraction of a degree be actually measured and what is the margin of error.
It seems supremely idiotic and not a little desperate to resort to measuring in tiny fractions and using the red/blue colours to enhance the effect, I wonder what the colour map would look like with single degree increments?
I should mention that the situation is rendered more complex when the speed of the outward flow of energy to space is contrained as possibly is now happening with the less active sun but that’s for another day and is explored more fully elsewhere.
I can envisage queries on my post (05:41:44) unless that factor is taken into account.
I am afraid someone is going to make a lot of money off the comedy called “climate change, yes it does”.