The Warning in the Stars
By David Archibald
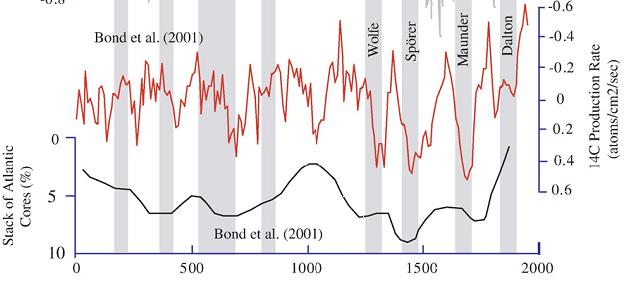
If climate is not a random walk, then we can predict climate if we understand what drives it. The energy that stops the Earth from looking like Pluto comes from the Sun, and the level and type of that energy does change. So the Sun is a good place to start if we want to be able to predict climate. To put that into context, let’s look at what the Sun has done recently. This is a figure from “Century to millenial-scale temperature variations for the last two thousand years indicated from glacial geologic records of Southern Alaska” G.C.Wiles, D.J.Barclay, P.E.Calkin and T.V.Lowell 2007:

The red line is the C14 production rate, inverted. C14 production is inversely related to solar activity, so we see more C14 production during solar minima. The black line is the percentage of ice-rafted debris in seabed cores of the North Atlantic, also plotted inversely. The higher the black line, the warmer the North Atlantic was. The grey vertical stripes are solar minima.
As the authors say, “Previous analyses of the glacial record showed a 200- year rhythm to glacial activity in Alaska and its possible link to the de Vries 208-year solar (Wiles et al., 2004). Similarly, high-resolution analyses of lake sediments in southwestern Alaska suggests that century-scale shifts in Holocene climate were modulated by solar activity (Hu et al., 2003). It seems that the only period in the last two thousand years that missed a de Vries cycle cooling was the Medieval Warm Period.”
The same periodicity over the last 1,000 years is also evident in this graphic of the advance/retreat of the Great Aletsch Glacier in Switzerland:

The solar control over climate is also shown in this graphic of Be10 in the Dye 3 ice core from central Greenland:

The modern retreat of the world’s glaciers, which started in 1860, correlates with a decrease in Be10, indicating a more active Sun that is pushing galactic cosmic rays out from the inner planets of the solar system.
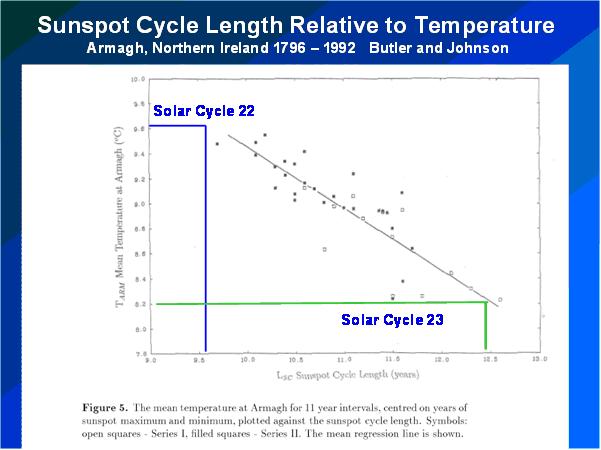
The above graphs show a correlation between solar activity and climate in the broad, but we can achieve much finer detail, as shown in this graphic from a 1996 paper by Butler and Johnson (below enlarged here)::

Butler and Johnson applied Friis-Christensen and Lassen theory to one temperature record – the three hundred years of data from Armagh in Northern Ireland. There isn’t much scatter around their line of best fit, so it can be used as a fairly accurate predictive tool. The Solar Cycle 22/23 transition happened in the year of that paper’s publication, so I have added the lengths of Solar Cycles 22 and 23 to the figure to update it. The result is a prediction that the average annual temperature at Armagh over Solar Cycle 24 will be 1.4C cooler than over Solar Cycle 23. This is twice the assumed temperature rise of the 20th Century of 0.7 C, but in the opposite direction.
To sum up, let’s paraphrase Dante: The darkest recesses of Hell are reserved for those who deny the solar control of climate.
This essay is also available in PDF form: TheWarningintheStars
Discover more from Watts Up With That?
Subscribe to get the latest posts sent to your email.
Stephen Wilde: “I have tried to square the circle by proposing that oceanic variations in the rate of energy release are the most direct climate driver with solar changes providing the longer term background trend with both oceanic and solar influences varying independently and capable of moving in and out of phase over millennia.”
You are on to something, Stephen. Keep up the good work.
Chris
Norfolk, VA, USA
The Sun of late has been doing quite well producing a lot more white light faculae than sunspot by area.
One has only to keep an eye on the SOHO MDI Continuum to see this.
And over time, that relationship of sunspot area to white light facular area has not stood still.
http://www.robertb.darkhorizons.org/SC24/GrDebSfoSnUPF.PNG
And that makes for a complication.
Nobody was paying attention to how much sunspot area vs facular area prior to Greenwich Photoheliogram program.
So we don’t really know for certain what was going on during the Maunder or the Dalton, by absence of aknowledgement, other than the lack of sunspots, as to visible activity.
I don’t know of any proxy that can relate to lack of faculae.
If facular factor is what is making the correlation hazy or erratic, we’ll have to wait until the next time the sun does that for an extended time period.
Pamela Gray (20:07:25) :
“len, it’s simple. There is a technical writing standard for hypothesis literature review, research proposal, methodology, results, and discussion. Archibald failed to follow it. I wonder why.”
Again….the appeal to authority fallacy. It’s a smokescreen, no, Pamela?
When are you going to let go of your ego long enough to admit that there is a some gray area in our understanding of the causes of climate variability?
Chris
Norfolk, VA, USA
””””’George Turner (21:33:54) : . . . . I can’t imagine what the more active researchers are having to deal with at home. Probably shivering hippopotamuses and frostbitten giraffes.”””””
George,
Thanks for lightening things up here.
That was subtle . . . I had to do a mental reboot to get it. That was good.
John
rbateman (22:07:34) : ” So we don’t really know for certain what was going on during the Maunder or the Dalton, by absence of aknowledgement, other than the lack of sunspots, as to visible activity. I don’t know of any proxy that can relate to lack of faculae.”
Fascinating. Is there any study on this recently…or one that is being commenced?
Chris
Norfolk, VA, USA
When one is dealing with dynamical chaos, and climate has been one of the first examples of dynamical chaos, the variations of amplitude against the variables of the problem, though not random, are unpredictable by ordinary methods. Mathematical methods are being developed for chaotic systems, but they are not of the type:” this correlates, maybe it causes” .
Unless a direct physical model calculation exists, all correlations, and particularly ones that need phases dragged in, may be called interesting but not explanatory.
The Armagh plot is interesting, but I would not say there is a theory behind it. I will wait and see what has happened in ten years time.
Some folks might link the solar conjuction Earth has this weekend with the
Sun, Jupiter and a full moon with large quakes in Chile and off Japan.
Wouldn’t they be silly ?
John Whitman,
Thanks! I’m trying to keep this thread from breaking out in a religious war over whose is the true sun god. 🙂
As for solar math, I would like to point out that our records are not quite adequate. We have sunspot numbers going back a few centuries, but obviously sunspots would be a symptom of solar variations, not a direct climate driver.
I would liken our earlier solar data to a mix of tree rings (Be10) and records of when certain rivers froze over. If there is a solar measurement that would better correlate to climate cycles, we haven’t been measuring it long enough to produce an overwhelmingly compelling curve. What we have are side effects seen on the sun and other side effects seen on Earth. If there is a more directly demonstrable link then hopefully it will pop out at us in the coming decade, or if not then at least having the solar activity go rapidly down while CO2 goes up should let us better parameterize solar influence versus man-made effects.
Instead of trying to convert people to a theory before its time, I would suggest that we describe what this new cycle might tell us, approximately when it will tell us, and describe the uncertainties in reading the sun’s message.
Historically, this cycle is a bit like the first opportunity to time the transit of Venus. We know it will give us significant information and we know when it will tell us, but there’s no way to make it tell us sooner than the physics dictates. Until then we’re just placing bets.
We are at the end of an unusually long and deep solar minimum. Yet every year in the last three was one of the ten warmest on record.
The theory that the sun is causing the current warming has been killed by the facts.
Does it bother anybody that the recent solar minimum coincided with some of the warmest temps on record?
savethesharks (22:23:54) :
If Leif doesn’t know of one, and SFO Observatory isn’t doing one, you got me.
I asked Debrecen if they were ever planning on measuring visible WLF, but they said no. So, it’s all K-line network + White Light Faculae in one big lump or nothing.
I imagine if, someday, we do find out there is a mechanism, it’ll end up being a Muphy’s Law thing, just when they decided it wasn’t something to pay attention to….
So, I don’t mind it at all when people like David Archibald give us something to think about, even if they don’t have a working mechanism. Look at it this way: We cannot yet predict an earthquake, but that doesn’t stop folks from searching. We want to know how it works.
Lief – variation in solar radiation is not the issue.
Items worth debating include:
1. variation in cloud cover & cycles in the same.
2. variations in magnetic activity in the sun and between sun & earth plus
trends & cycles in the same.
3. variations in cosmic rays hitting the lower atmosphere.
4. multi correlations between the above.
5. Theoretical relationships between these factors.
6. Progress in the CERN “Cloud” experiment.
7. Trends and cycles in the global temperature.
8. Errors in measurement (Manipulation?) in both the ground based
and satelite based global temperature.
When Mt St. Helens was actiing up, I noticed that many of the eruptions seemed to occur just after local peak high tide…
Leif Svalgaard (17:42:44) :
ya the first graph is a hoot.
Did not Prof Jones of the CRU say Global Warming had to be CO2 as they could not think of anything else ?. This article should be enough for any Jury to convict.
Pamela Gray (18:13:31) :
yes this is a pathetic piece. I really get annoyed at people’s lack of consistency. If this were an AGW paper people would ask for the data and the code and the full statistical report. they would point out that ON SIGHT the first chart is a falsification of the claims. they would argue that correlation is not causation.. , situational skepticism.
Hint: just because some climate scientists do some things wrong is no license to do bad science yourself.
Physics Major – regarding the ads at the top of each post – my understanding is that they only pay when someone clicks, and when someone clicks Anthony receives a contribution. So they are only wasting their money when someone who is completely uninterested in their products or services clicks and then immediately uses the back button on their browser. Not that I am suggesting everyone should, as a matter of habit, give a quick click on an ad when they come on the site.
Yet every year in the last three was one of the ten warmest on record.
On falsified record, Darius.
magicjava (19:42:47) :
I’m a bit confused.
**************
this too shall pass. read leif
magicjava (20:36:30) : good work, cool tunes
The main article here is very good as it seems to provide a rational explanation for the fine structure of climate variation. Other than the Milankovitch cycles, I know of no other accepted explanations for externally forced climate change.
While solar influence by cosmic ray intensity modulation may seem far-fetched, this seems to be the only theory left on the field that explains the observed phenomena since all direct effects appear to be ruled out.
Dr. Archibald
There is no doubt that the cosmic rays impact onto the Earth’s atmosphere is affected by the GeoMagnetic Field (GMF). The GMF is made of two components; one due to interplanetary magnetic field, with solar effect incorporated (IMF) and the much, much stronger component of the Earth’s magnetic field itself.
Therefore, it is possible to conclude that if there is a link between climate and the cosmic rays impact, the critical effect is related to the strength of the main component of GMF.
http://www.vukcevic.talktalk.net/LFC8.htm
This is an unpredictable factor.
However, on the less relevant scale IMF should not be ignored. I thing that IMF intensity is not only factor of solar activity, but there is additional modulation from the two major magnetospheres of the solar system. This is a factor which may be crudely estimated, with some periodicity related to J/S orbital parameters:
http://www.vukcevic.talktalk.net/GrandMinima.gif
The additional factor appears to be some apparent, but not explained reverse long term linkage between intensities of the solar activity and the Earth’s magnetic field.
http://www.vukcevic.talktalk.net/LFC9.htm
More graphs at: http://www.vukcevic.talktalk.net/GandF.htm
Physics Major (16:57:30) :
“OT, but has anyone else noticed the irony of the Google ads that appear here?
They all seem to be for hyper-green organizations.
I am all for conservation, but not for those who make wild, unscientific exaggerations to advance an anti-capitalist agenda. I know that I have never been tempted to click on one of these ads so thy are wasting their money.”
Physics Major
Ever heard of the “pay per click” policy from Google? Google will make them pay the moment you click. So if you want to help them waste their money…click!
12 years of cooling & counting!
http://icecap.us/images/uploads/HS1.jpg
Leif Svalgaard in a previous comment pointed out the poor correlation between solar minima and c14/Ice Raft debris which I see as well – but then he spoiled it by showing his blinkered perspective by dismissing all other comments because they come from “David’s loyal flock”.
As one of David’s loyal flock I come for scientific discussion here rather than the mud slinging and almost pure dogma that seem to emanate from elsewhere.
u.k.(us) says:
February 27, 2010 at 5:38
…”Predictions?, the data is chaotic at best.
There are 3-4 variables that could overwhelm the entire system depending on their intensity.
Predictions scare me, they got us into the AGW fiasco….”
Do you know why these type of predictions scare you? Because they are correlations, not causation (just like AGW). As you point out there are a lot of other variables out there, as well as their interactions. Even AGW talks about the potential interaction of CO2 and water making warming that much worse. As I’ve said in previous posts, where is the multivariate statistcal analysis? Univariate analysis simply cannot predict anything as complex as the climate. Not only does it consider only one factor at a time, it ignores the complex interactions of other factors (factors like cloud cover, volcanism, solar flux, dust, etc.).
This paper clearly shows other highly correlative factors to temperature that should clearly highlight the folly of building a predictive model of global temperature based solely on CO2 (the hockey stick). Include these other factors in a multivariate analysis and you’ll find CO2 is inconsequential.