The Warning in the Stars
By David Archibald
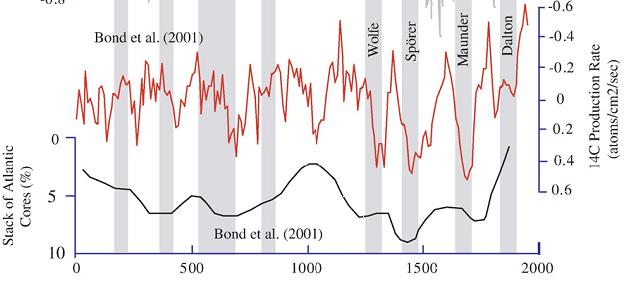
If climate is not a random walk, then we can predict climate if we understand what drives it. The energy that stops the Earth from looking like Pluto comes from the Sun, and the level and type of that energy does change. So the Sun is a good place to start if we want to be able to predict climate. To put that into context, let’s look at what the Sun has done recently. This is a figure from “Century to millenial-scale temperature variations for the last two thousand years indicated from glacial geologic records of Southern Alaska” G.C.Wiles, D.J.Barclay, P.E.Calkin and T.V.Lowell 2007:

The red line is the C14 production rate, inverted. C14 production is inversely related to solar activity, so we see more C14 production during solar minima. The black line is the percentage of ice-rafted debris in seabed cores of the North Atlantic, also plotted inversely. The higher the black line, the warmer the North Atlantic was. The grey vertical stripes are solar minima.
As the authors say, “Previous analyses of the glacial record showed a 200- year rhythm to glacial activity in Alaska and its possible link to the de Vries 208-year solar (Wiles et al., 2004). Similarly, high-resolution analyses of lake sediments in southwestern Alaska suggests that century-scale shifts in Holocene climate were modulated by solar activity (Hu et al., 2003). It seems that the only period in the last two thousand years that missed a de Vries cycle cooling was the Medieval Warm Period.”
The same periodicity over the last 1,000 years is also evident in this graphic of the advance/retreat of the Great Aletsch Glacier in Switzerland:

The solar control over climate is also shown in this graphic of Be10 in the Dye 3 ice core from central Greenland:

The modern retreat of the world’s glaciers, which started in 1860, correlates with a decrease in Be10, indicating a more active Sun that is pushing galactic cosmic rays out from the inner planets of the solar system.
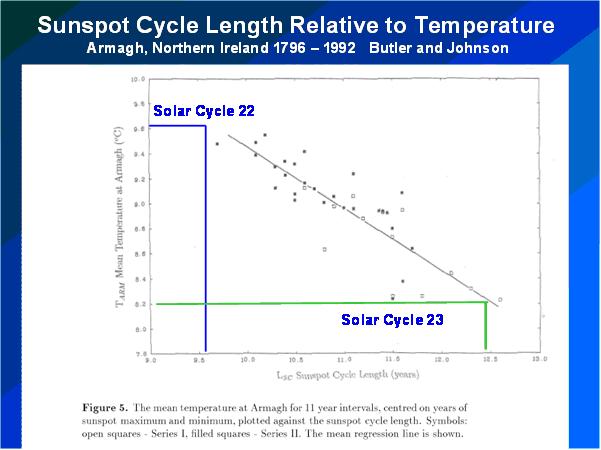
The above graphs show a correlation between solar activity and climate in the broad, but we can achieve much finer detail, as shown in this graphic from a 1996 paper by Butler and Johnson (below enlarged here)::

Butler and Johnson applied Friis-Christensen and Lassen theory to one temperature record – the three hundred years of data from Armagh in Northern Ireland. There isn’t much scatter around their line of best fit, so it can be used as a fairly accurate predictive tool. The Solar Cycle 22/23 transition happened in the year of that paper’s publication, so I have added the lengths of Solar Cycles 22 and 23 to the figure to update it. The result is a prediction that the average annual temperature at Armagh over Solar Cycle 24 will be 1.4C cooler than over Solar Cycle 23. This is twice the assumed temperature rise of the 20th Century of 0.7 C, but in the opposite direction.
To sum up, let’s paraphrase Dante: The darkest recesses of Hell are reserved for those who deny the solar control of climate.
This essay is also available in PDF form: TheWarningintheStars
Discover more from Watts Up With That?
Subscribe to get the latest posts sent to your email.
Leif,
The “Flock” as you say would like for you to produce a graph of your heating bill, or the BTU’s needed to heat your home, or some “real” world representation of your home needs to heat in the winter. Better yet over the last 25 years.
If you can’t produce this then maybe you can produce a graph of the worlds “grain” production over the last 40 years.
Maybe you can show us in some way how all this climate is a random walk?
Maybe you can tell us why the “Russians” and the “Chineese” are taking stronger global positions in energy production?
How about giving the “Flock” some guidance on the elevated level of earthquake activity in the last 2 years.
Hey Leif!, it took a “flock” to get to the moon.
Who would best fit the “Flock” mentality? “Chaimberlain” or “Churchill”?
When the gas runs low or the grain runs low it won’t be theory that saves your ass it’ll be the “Flock” that’s got sense enough to save the masses. Will the “Flock” be standing flat footed when the world is faced with trouble?
It won’t be the Chaimberlains, it’ll be the Churchills.
I bet that in the event someone has to dig you out of a snowbound disaster, it’ll be a “Flocker” 10-1 odds.
I’m a bit confused.
I’m wondering why c14 was used. Since the amount of c14 is based on the amount of cosmic rays, why not just use cosmic rays?
But then cosmic rays are thrown in for a different comparison. And then sunspots.
Like I said, I’m confused. I’m not seeing something that could be used to build a climate model. I’m seeing a collection of various correlations.
Leif Svalgaard (17:42:44)
“Check for instance the dip of the red curve and the absence of a gray band and the high temperature around the year 1000.”
I’ll draw on someone many don’t seem to like here, including David and yourself. Landscheidt said this was due to a phase change in the alignment of the planets where the barycentric tides cancel. He also predicted we would get another one in ~500 years (3*172) in one of his papers. Personally, I like the corrected (172y) Jose Cycle better … 2x the Gleissberg cycle. After that I’d bet we go into another glaciation during a Sporer Type Minimum … wager?
I like the Gleissberg cycle and Jose cycle better than the deVries cycle. Matches events better and is linked to another effect that is apparently barred from discussion here. I know where to classify Lief’s criticism and sentiments but I am having trouble finding a high profile proponent of Pam’s sentiments.
Leif Svalgaard (17:42:44)
“Check for instance the dip of the red curve and the absence of a gray band and the high temperature around the year 1000.”
OK, since I think I know what booted my original comment. A certain person thought the phenomena noted above was due to a phase change in the proposed driver of the cycles previously mentioned. The phase change will happen again in 3*Jose cycle.
Did I miss something or not read WUWT when certain topics were flagged?
Sorry for the string of comments, must be the old browser, updates etc. … and working nights makes me paranoid. 😀
len, it’s simple. There is a technical writing standard for hypothesis literature review, research proposal, methodology, results, and discussion. Archibald failed to follow it. I wonder why.
[quote]I hope more research will be done about the sun, because the climate is clearly correlated with possibly a lot of complexity. The sun shines at different frequencies and different feedbacks could be discovered.
Here is an hypothesis which is probably wrong but might be worth testing:
1. A hot sun generates a lot of water vapor.
2. Dust particles and aerosols accelerates the rate of water vapor condensing to clouds.
3. When the sun is more powerful, the dust particles and aerosols get much warmer and cloud formation is lowered because the condensation on theses particles is lowered.
4. When the sun is hot, you have:
a. More water vapor in the air.(positive feedback)
b. Reduced cloud cover during the day.(positive feedback)
c. Cloud formation during the night because the dust particles and aerosols are colder and can condensate the high amount of humidity.(positive feedback)
If anybody knows the results of a study of this hypothesis, feel free to share.[/quote]
Not to be mean, but it’s probably wrong, for several reasons.
1) There’s been no trend in water vapor for 20 years. http://www.climate4you.com/images/TotalColumnWaterVapourDifferentAltitudesObservationsSince1983.gif
2) This one is correct.
3) Its the temperature of the water vapor that matters for cloud formation, not the temperature of the particles. The temperature of water vapor is lowered by having the water vapor rise into the air. The air pressure is lower up there, the water vapor expands, which causes it to cool.
4) If by “sun” you mean total solar irradiance (TSI), there’s not much of a correlation between TSI and clouds.
Jason (19:03:02) :
Go read for a couple of hours on Bob Tisdale’s pages:
Perhaps start here and follow the links and/or ask Bob for an ordered list:
http://bobtisdale.blogspot.com/2009/01/can-el-nino-events-explain-all-of.html
P.S. In a nutshell, you’re not going to get very far with the idea of “hotter/colder sun = hotter/colder earth”.
My personal preference is to start with the clouds. Follow that trend and compare it to temperatures.
If you’re happy with that correlation (I am), from there you can ask what causes the amount of clouds to change. Cosmic rays, extreme ultraviolet energy, and bacteria are all candidates. There may be others.
Some of you, I think, mistake watchful waiting for mean-spiritedness. Mother said if the shoes don’t fit it’s best to do without. Good advice then. Good advice now.
Hello David
I am trying to understand all of the potential drivers of Earth’s climate system;
http://www.physicalgeography.net/fundamentals/7y.html
http://oceanservice.noaa.gov/education/pd/climate/factsheets/whatfactors.pdf
and determine which ones are primarily responsible for recent and forthcoming changes in Earth’s climate system.
There seems to be reasonable evidence of a significant ocean component based on the cycles of the Pacific Decadal Oscillation and Atlantic Multidecadal Oscillation;
http://icecap.us/docs/change/ocean_cycle_forecasts.pdf
http://www.appinsys.com/GlobalWarming/PDO_AMO.htm
http://www.atmos.washington.edu/~mantua/REPORTS/PDO/PDO_egec.htm
http://www.atmos.washington.edu/~mantua/REPORTS/PDO/PDO_cs.htm
And there also seems to be reasonable evidence for a significant volcanic component based historical observation:
http://www.geology.sdsu.edu/how_volcanoes_work/climate_effects.html
http://www.longrangeweather.com/global_temperatures.htm
http://adsabs.harvard.edu/abs/1991vci..nasa…..R
How significant a factor do you consider solar variability as a driver of recent and forthcoming changes in Earth’s climate system as compared to the impact of ocean cycles, volcanic activity, natural variability and other factors?
This looks mighty weak to me. Better explanation than CO2 driving climate perhaps; but better than totally baloney isn’t the same thing as good.
I compare the clarity and logical progression of the above article by David Archibald to that of the Roy W. Spencer post on WUWT today “Spurious warming demonstrated in CRU surface data”.
Given that there is a significantly increasing interest in all things solar as CO2 interest fades, I wish David Archibald’s piece was laid out in clear terms and with a logically progressing layout towards a summary. By the lack of a more clear scientific communication, I think Archibald misses a great opportunity here to shed some light of clarity for those riding the increasing wave of solar interest.
ANECDOTAL NOTE: My training for technical sales presentations to customers was: Tell them what you are going to say, then say it, then tell them what you said, then verify by dinner discussion that they understood. I learned through experience (38 yrs) also, that you need to make sure that (well in advance of the presentation) they know clearly what you are going to say, to the extent that they don’t really need you to come and tell them. Then they could decide if they were really interested in hearing you say it. No sense in wasting your time telling them if they do not want to here it.
My point, Mr. Archibald, is a lot of people here really do want to hear what you are saying about things solar, but please make it clear even if it makes you look very uncertain . . . .it all adds to knowledge and we will appreciate it.
John
Mike Clark (19:24:50) :
I bet that in the event someone has to dig you out of a snowbound disaster, it’ll be a “Flocker” 10-1 odds.
Archibald is an alarmist [we are all gonna freeze, we are all gonna starve, etc] but for the wrong reason.
len (19:49:01) :
Landscheidt said this was due to a phase change in the alignment of the planets where the barycentric tides cancel.
With phase changes at suitable places you can explain anything and everything.
He also predicted we would get another one in ~500 years […] wager?
OK, I’ll collect in 500 years. You can put the money in escrow right now.
P.P.S.
Here’s a link to a video on clouds that I put together. It may be useful.
[youtube=http://www.youtube.com/watch?v=DBs9RucRg_Q&hl=en_US&fs=1&]
Leif Svalgaard (17:42:44) :
David has his loyal flock, so stay tuned to hear the hymn from them.
…………………………………………………………………………………………….
One can always be certain of kindness from you, can’t they Leif.
And, are you certain that it is David Archibald that has a loyal flock? That is not what I have observed.
Prof. Emeritus Wil Alexander shows a 95% correlation between rainfall and a 21 year solar cycle in So. Africa See: A critical assessment of current climate change science
See especially page 22
and page 25
Presumably there will be a corresponding correlation with clouds.
Alexander has successfully predicted major droughts based on this 21 year periodicity.
Correction – that should be 95% significance. See
Pamela Gray (20:07:25) :
len, it’s simple. There is a technical writing standard for hypothesis literature review, research proposal, methodology, results, and discussion. Archibald failed to follow it. I wonder why.
………………………………………………………………………………………………………………..
To be fair, Roy Spencer also has a post here on the front page. His methods and opinions did not go through this process before he was posted here either.
”””’Pamela Gray (20:07:25) : len, it’s simple. There is a technical writing standard for hypothesis literature review, research proposal, methodology, results, and discussion. Archibald failed to follow it. I wonder why.”””’
Pamela Gray,
I did my “John Whitman (20:30:13)” comment before seeing yours.
Your point is similar to what I was trying to say. Why isn’t Archibald more clear?
John
John Whitman,
I’m just a climate hobbyist and I’m innundated with animal refugees from the current cold spell. I can’t imagine what the more active researchers are having to deal with at home. Probably shivering hippopotamuses and frostbitten giraffes.
I’ll bet they want to punch out whoever wrote “I Want a Hippopotamus for Christmas“.
David L. Hagen (20:47:35) :
Alexander has successfully predicted major droughts based on this 21 year periodicity.
How many did he predict? If he discovered the correlation, say, 30 years ago, he could have predicted at most 2. If less than 21 years ago, at most 1. Not an impressive track record.
Just The Facts (20:27:38) :
Just The Facts (18:47:57) :
“Retracted, posted on wrong thread, D’oh!”
And retract my retraction on this thread, and I apologize for my sloppiness. I’ve got about 20 windows open, am working on two different laptops, doing about 10 different things and apparently doing this one quite poorly.
Pamela Gray (18:13:31) :
Spare me the appeal to authority fallacy.
Chris
Norfolk, VA, USA