Steven Goddard writes below that he agrees with the prediction I made in late 2009 that we’d see another 500,000 km2 of Arctic sea ice recovery in 2010. The Arctic Oscillation seems to be negative again, and according to NSIDC, this figures greatly in making thicker ice thus lowering summer losses. – Anthony

Source: Climate Prediction Center
NSIDC regularly puts out a news article describing the deteriorating state of the Arctic, called the Sea Ice News. In their May 5, 2008 article, they stated:
…the Arctic Oscillation was in its positive phase through the winter season, associated with a wind pattern helping to flush thick ice out of the Arctic, leaving thinner ice. This is one of the factors helping to set the stage for pronounced ice losses this summer.
Additionally, Dr. Walt Meier from NSIDC told WUWT:
The NAO/AO (Arctic Oscillation) is a particularly prominent one and a substantial amount of the decline in the sea ice during the late 1980s and early 1990s could be attributed to a strong positive mode during winters because the positive mode favors the loss of thicker ice (through drift) that is less likely to melt during summer.
In their January 5, 2010 article NSIDC states that we are in an “Extreme negative phase of the Arctic Oscillation” which can be seen in this NOAA graph below. Oddly (but not surprisingly) the article failed to mention how this affects drift.

If a positive Arctic Oscillation flushes out the Arctic into the Atlantic, the implication is that a negative phase would tend to retain ice. This indeed appears to be the case. Arctic buoys show very light polar drift this winter.

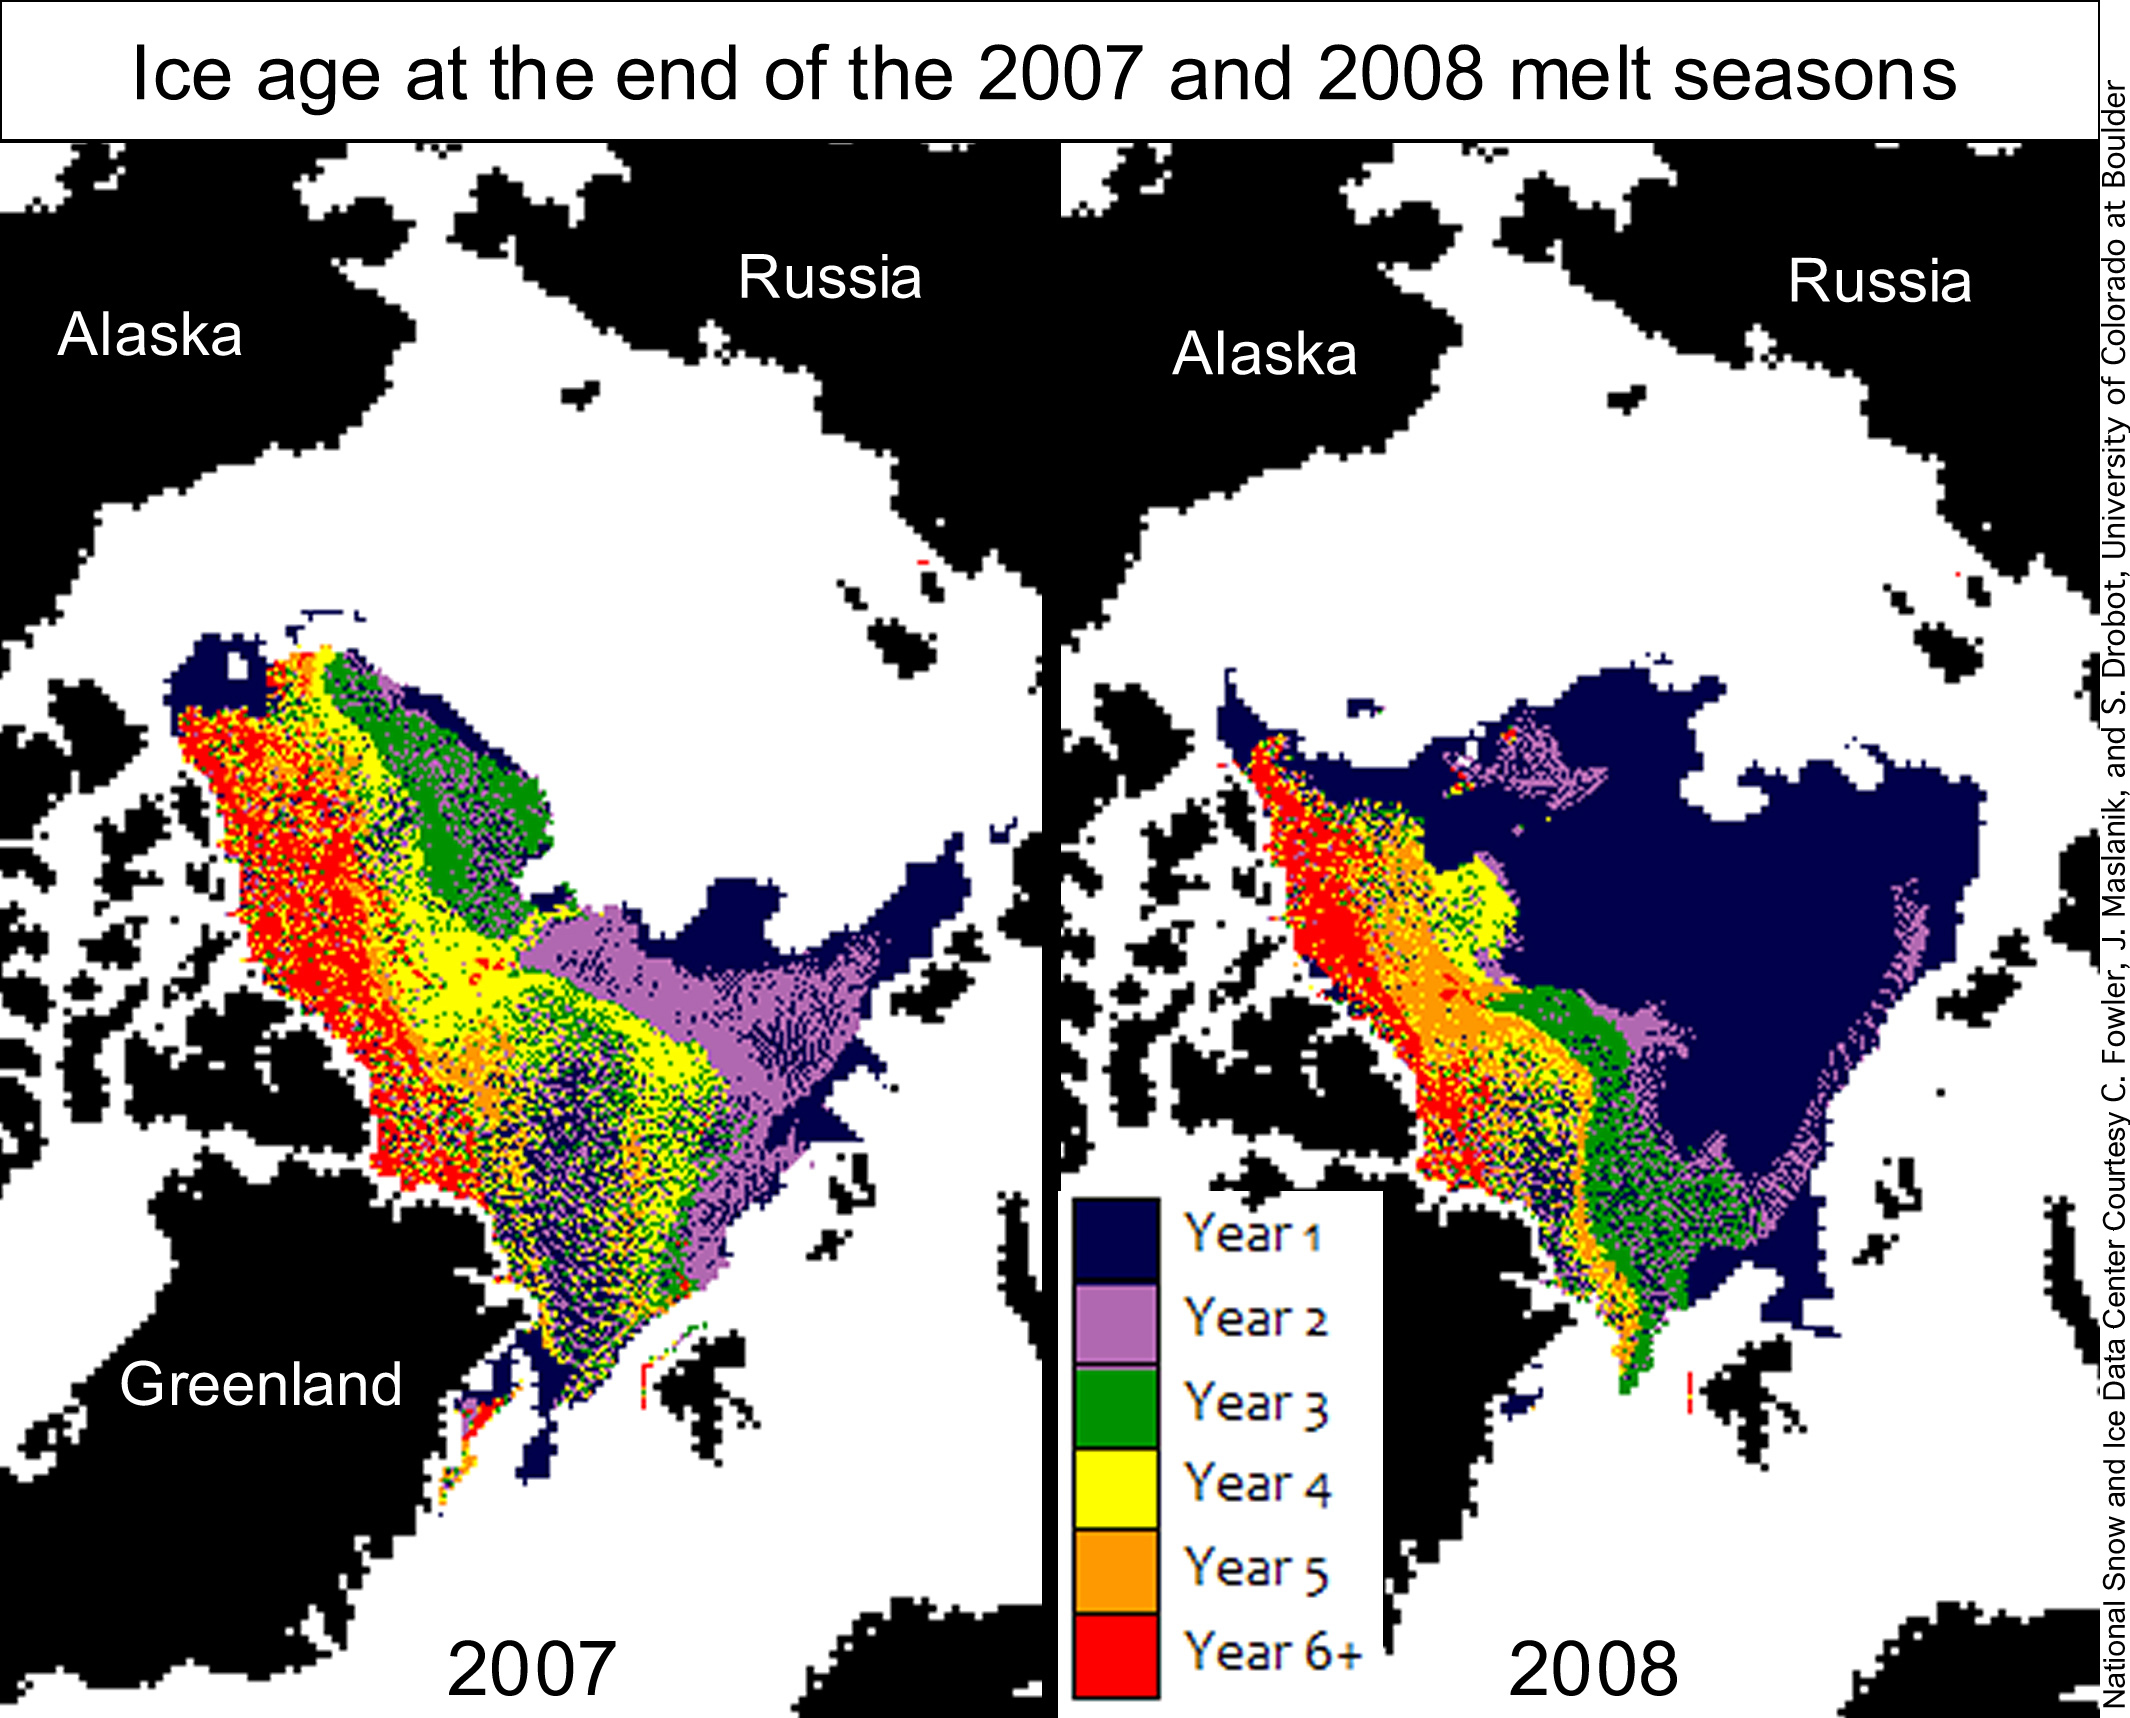
NSIDC made a big deal about loss of multi-year ice in the Arctic during 2007-2008, but this was due more to drift in the winter than melting in the summer, as can be seen in the NSIDC map pair below. Note that most of the 2007 multiyear ice was replaced by first year ice after the 2007 melt season ended and (necessarily) before the 2008 melt season started. The only way this could have happened was due to drift during the 2007-2008 winter, i.e. it could not be the result of summer melt -because ice only forms in the winter.

If the ice is not drifting (i.e. not under tensile stress) the concentration should be high. This indeed appears to be the case. According to UIUC maps, sea ice concentration is high (above 90%) across the Arctic Basin.
http://arctic.atmos.uiuc.edu/cryosphere/NEWIMAGES/arctic.seaice.color.000.png
The Arctic ice minimum extent increased by about 25% between 2007 and 2009, and many indications (negative AO, light drift, high concentration) point to the idea that it will continue to increase in 2010.

http://www.ijis.iarc.uaf.edu/seaice/extent/AMSRE_Sea_Ice_Extent.png
We can also expect that the average age of the ice has increased this winter, continuing a trend started in 2009.

Here’s your chance to weigh in:
Prediction: Arctic Ice Will Continue to Recover this Summer
NSIDC regularly puts out a news article describing the deteriorating state of the Arctic, called the Sea Ice News. In their May 5, 2008 article, they stated:
the Arctic Oscillation was in its positive phase through the winter season, associated with a wind pattern helping to flush thick ice out of the Arctic, leaving thinner ice. This is one of the factors helping to set the stage for pronounced ice losses this summer.
Additionally, Dr. Walt Meier from NSIDC told WUWT:
The NAO/AO (Arctic Oscillation) is a particularly prominent one and a substantial amount of the decline in the sea ice during the late 1980s and early 1990s could be attributed to a strong positive mode during winters because the positive mode favors the loss of thicker ice (through drift) that is less likely to melt during summer.
In their January 5, 2010 article NSIDC states that we are in an “Extreme negative phase of the Arctic Oscillation” which can be seen in this NOAA graph below. Oddly (but not surprisingly) the article failed to mention how this affects drift.

If a positive Arctic Oscillation flushes out the Arctic into the Atlantic, the implication is that a negative phase would tend to retain ice. This indeed appears to be the case. Arctic buoys show very light polar drift this winter.

NSIDC made a big deal about loss of multi-year ice in the Arctic during 2007-2008, but this was due more to drift in the winter than melting in the summer, as can be seen in the NSIDC map pair below. Note that most of the 2007 multiyear ice was replaced by first year ice after the 2007 melt season ended and (necessarily) before the 2008 melt season started. The only way this could have happened was due to drift during the 2007-2008 winter, i.e. it could not be the result of summer melt -because ice only forms in the winter.
If the ice is not drifting (i.e. not under tensile stress) the concentration should be high. This indeed appears to be the case. According to UIUC maps, sea ice concentration is high (above 90%) across the Arctic Basin.

http://arctic.atmos.uiuc.edu/cryosphere/NEWIMAGES/arctic.seaice.color.000.png
The Arctic ice minimum extent increased by about 25% between 2007 and 2009, and many indications (negative AO, light drift, high concentration) point to the idea that it will continue to increase in 2010.

http://www.ijis.iarc.uaf.edu/seaice/extent/AMSRE_Sea_Ice_Extent.png
We can also expect that the average age of the ice has increased this winter, continuing a trend started in 2009.
Poll:
What will the 2010 Summer Arctic Sea Ice Extent Be?
It will be greater than 2009
It will be greater than 2008 but not 2009
It will be less than 2007
It will be near normal
The North pole will be “ice Free” in 2010
Steve Goddard (10:27:09) :
Phil,
Is minus 30C cold enough to freeze seawater?
It depends how deep and warm the sea water is and how thick the ice is,
ice thickness depends on heat conduction through the ice, 5ºC smaller T differential across the ice would be about 20% less heat conduction.
The 2007-2009 minimums have been dominated by loss of ice in the western Arctic, not the east. Drift in the western Arctic has been close to zero this winter, and Bering Strait ice is above normal.
The drift data I’m looking at doesn’t support your assertion.
Does this mean we don’t have to worry about polar bears drowning?? Thank GOD, I haven’t been able to sleep for months!!
Steve Goddard (10:36:56) :
Phil,
I also called Serreze on his ice free North Pole prediction in 2008.
http://www.theregister.co.uk/2008/07/03/goddard_polar_ice/
Actually you didn’t, read it again!
Just to remind, that temperatures in 2005 reached 1940s level and now are heading down again.
http://climexp.knmi.nl/data/icrutem3_hadsst2_0-360E_70-90N_na.png
All this happening in Arctic, where dry cold air should allow CO2 to manifest its warming potential. How anyone dared to attribute 1980-2005 warming to CO2, not explaining ups and downs before? There is NEVER such graph shown in any newspaper article, except “unprecedented warming” hysteria. Btw, Arctic ice extent follows the temperatures inversely, NW passage being passable in 1942-44 just as in 2007-2009. I bet some fools on ships will stuck in ice there this summer.
Phil,
This is what I am looking at:
http://iabp.apl.washington.edu/DAILYMAPS/dailymap.60day.jpg
What is your source?
Phil. those charts showing drift you posted are interesting. The one thing I noticed was the flow in 2007 was strong into the Atlantic, where this year the flow is stronger within the Arctic basin, and not flowing out as in 2007.
Phil,
Did you miss this sentence?
“Secondly, the likelihood of the North Pole being ice free this summer is actually quite slim. There are only a few weeks left where the sun is high enough to melt ice at the North Pole. “
Somebody said that as the jet stream went southwards north pole will be relatively warmer while the US will be cooler. Is it true?
Isnt the planet itself displaying an enourmous experiment, showing us the difference of air effect versus sea effect on ice?
Isnt the result there, for all of us too see?
Antarctica versus the Arctic?
It depends on where the temperature’s artic will be located and it does not necessarily corresponds with the geographical pole.
Interesting and informative post. Certainly the negative AO of this winter has kept the ice in place and will preserve more multi-year ice, making it harder to melt during the summer, however, the negative AO has also kept the water warmer near Greenland. On balance, this will still slightly favor the multi-year ice.
Prediction: Summer sea ice minimum of Sept. 2010 will be lower than 2009 or 2008, but not as low as 2007. However, 2011 summer arctic sea ice minimum will be at a record low of somewhere around 2.5 million sq. km. As we head toward the solar max event of 2013, the increasing interplanetary A index, decreasing GCR, warmer oceans, decreasing cloud cover globally, increasing CO2 and methane levels could combine to see consecutive record low summer sea ice minimums in 2011, 2012, and 2013…but not 2010. Though 2010 will be the warmest year on record in the troposphere, baring any Mt. Pinatubo type eruptions…
Let me refer people to
http://wattsupwiththat.com/2009/09/07/how-have-the-scientists-done-on-arctic-sea-ice-forecasts-this-year-maybe-not-so-good/#more-10648
Here we had forecasts for the minimum extent of sea ice for Septemebr 2009. We now a one forecast for September 2009. Is it possible to make a collection of forecasts for 2010 as was done for 2009?
Steve Goddard (10:13:13) :
Steve, thanks for the link to the helpful grpahic showing why january 2010 showed record warmth even in the northern hemisphere http://www.remss.com/data/msu/graphics/tlt/medium/global/ch_tlt_2010_01_anom_v03_2.png.
Correct me if I am wrong but it appears to me that much of the northern hemisphere land mass temperature was well above normal (e.g Canada, Greenland, Africa, Middle East). The cooler parts, (USA and Europe), are where most of the readers to this blog are located, so gave the impression to many on this blog at least that Dr Spencer’s satellite data did not match reality on the ground.
My choice of between 2008 and 2007 is not available. Most melting occurs on the Russian side so the ice age on the Canadian side has less bearing than it would have if melting was uniform. As the Russian side has more sea then it gets a positive weighting on total melt and as Phil has said, there is no evidence that the Barents and seas eastwards are a tougher nut to crack than last year.
The SST’s are still high in the North Atlantic too and show no sign of changing.
Recovery in summer 2010 will be same wishful thinking as the rapid refreeze and Winter maximum increase claims we have seen recently dashed.
Andy
Brian,
Phil posted vectors for one (carefully chosen?) week. The 60 day drift maps show the sum total movement of buoys since early December.
http://iabp.apl.washington.edu/DAILYMAPS/dailymap.60day.jpg
Scarcely any movement outside of the Fram Strait.
Phil. (10:20:03) :
http://ocean.dmi.dk/arctic/meant80n.uk.php
They’ve only been about 5ºC warmer than average for the last 6 months
Here’s a graph from 1974. Pick any other one. They all show temps above and below the “average line”. Temp appears to normally be erratic, indicating drift, or other factors, may be more important.
http://ocean.dmi.dk/arctic/meant80n.uk.php
Remember, the “record” low ice in 2007 was due to a wind pattern that blew more ice out of the Arctic than normal, not unusually warm temperatures.
Below is a video link for the entire record of NSIDC sea ice. North and South pole together. The video was current at the time of Copenhagen. I’ve never tried to embed a video in a comment and don’t know the WUWT policy but here it is:
[youtube=http://www.youtube.com/watch?v=GMcxri_f1rw&color1=0xb1b1b1&color2=0xcfcfcf&hl=en_US&feature=player_embedded&fs=1]
Yeah, Steve, I know. But just using what he posted, the movement is more confined within the basin, and not so much out as in 2007. That’s what I was trying to get at.
Juraj
‘Just to remind, that temperatures in 2005 reached 1940s level and now are heading down again.
http://climexp.knmi.nl/data/icrutem3_hadsst2_0-360E_70-90N_na.png‘
That chart has one mega warm blip just before 1880.
Any indications as to what arctic sea ice was like that year?
MJK,
The large TLT January NH land anomaly is due mainly to Canada and Greenland. I’m hypothesizing that temperatures on the ground were not as anomalously high, and UAH Channel 4 seems to confirm this – as does weather underground stations I have looked at.
Anthony/Steve–
I hope you guys are right, and I’m wrong –tho I was pretty darn close last year and months in advance…
I’ll read your analysis, ponder it, and see if it changes my mind. I’m certainly not liking what we’re seeing so far this winter re the extent graphs at nsidc and ijis. For the moment I picked “More than 2008, but less than 2009”. More multi-year certainly helps limit your losses in the summer, but right now I’m sticking with the theory that even now the multi-year will not be recovered back to 2005 or 2006 levels, so we’d need significantly more maximum extent @mid-March to make up for that to get back to minimum extent for 2005 or 2006, which would be implied (by me anyway) in your prediction for “greater than 2009”.
Since I’m not seeing that happening at the moment (I’d love to see some acceleration in the next month, obviously, to make it possible), so currently I’m leaning towards a bit (not massively, but a bit) lower than 2009 but comfortably ahead of 2008.
Steve Goddard (11:02:15) :
Phil,
This is what I am looking at:
http://iabp.apl.washington.edu/DAILYMAPS/dailymap.60day.jpg
What is your source?
http://cersat.ifremer.fr/news/scientific_results/global_mapping_of_arctic_sea_ice_drift_a_unique_database
Brian D (11:09:40) :
Phil. those charts showing drift you posted are interesting. The one thing I noticed was the flow in 2007 was strong into the Atlantic, where this year the flow is stronger within the Arctic basin, and not flowing out as in 2007.
It varies from week to week, particularly when a weather system moves through, the flow out of the Fram, the major exit route for multi-year ice, has been consistent.
Steve Goddard (11:43:05) :
Brian,
Phil posted vectors for one (carefully chosen?) week.
Chosen at random, it doesn’t make much difference.
The 60 day drift maps show the sum total movement of buoys since early December.
http://iabp.apl.washington.edu/DAILYMAPS/dailymap.60day.jpg
Scarcely any movement outside of the Fram Strait.
And there they show very strong outflow, mostly multi-year ice.
Steve Goddard (11:10:37) :
Phil,
Did you miss this sentence?
“Secondly, the likelihood of the North Pole being ice free this summer is actually quite slim. There are only a few weeks left where the sun is high enough to melt ice at the North Pole. “
No I didn’t, why do you think it’s relevant!
Some explanation of the Arctic and Antarctic Oscillations and how the AO affects ice formation, albeit with the usual AGW padding, courtesy of NCAR:
http://jisao.washington.edu/wallace/ncar_notes/