The sun has seen a resurgence of activity in December, with a number of cycle 24 sunspots being seen. The latest is group 1039 seen below:

2009 is ending with a flurry of sunspots. Indeed, if sunspot 1039 holds together just one more day (prediction: it will), the month of December will accumulate a total of 22 spotted days and the final tally for the year will look like this: From Spaceweather.com
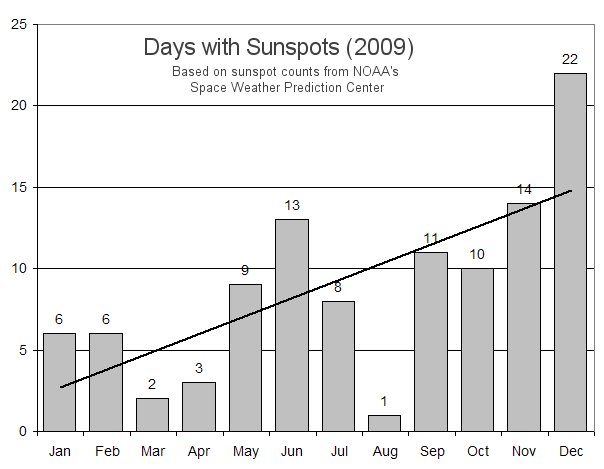
The dark line is a linear least-squares fit to the data. If the trend continues exactly as shown (prediction: it won’t), sunspots will become a non-stop daily occurance no later than February 2011. Blank suns would cease and solar minimum would be over.
If the past two years have taught us anything, however, it is that the sun can be tricky and unpredictable.
OK… you win it’s the sun… we realize we were wrong about that…. but the real problem is that our oceans are turning acid… we have the data to prove it, and it is much worch than we thought… we even did a little demonstration before congress… now, you realize, of course, that the acidification data is not subject to FOIA, requests and neither is any of the other data we have… so stop asking… you people are very annoying and you are keeping us from saving the planet.
Thanks,
True Science
Jerry I think you are right the lag effects are in 10-100 years me thinks or from what i understand. If I recall/think L Svaalgard does not believe in a sun/climate link though
Sunspots don’t produce heat. An uptick in the solar wind will lead to an increase in the earth’s magnetic field, a drop in cosmic rays, and therefore a lower planetary aldebo. But it will take years for the magnetic field to catch up to the solar wind. An uptick in solar activity now translates into warming in two or three years. For now, expect the cooling to continue. Expect the hudson to freeze.
Jerry M (07:35:05) :
I’m probably way off base here, but, isn’t there a lag time between solar sunspots and world-wide temperature?
Yes.
What I’m saying is that we could be in for more cooling until 2012-2014 before a warmin uptrend begins to assert itself.
Sounds about right.
My prediction is that the uptrend in sunspots will be slow, reaching a maximum around late 2015.
http://tallbloke.wordpress.com/files/2009/12/ap-prediction.gif
We have almost complete daily coverage back to solar cycle 8 and can thus plot the number of spotless days during the minima between these cycles. To the extent that that count is a measure of the next cycle [and that is hypothetical, but not unreasonable as a large cycle during its rise would quickly squash the number of spotless days], one could use the rise of the accumulated count of spotless days during a minimum as a rough indicator of the size of the next cycle [as surmised e.g. by Jan Janssens http://users.telenet.be/j.janssens/Engwelcome.html ]
An issue is when to start the start. Choosing the first spotless day leads to large scatter as there is a large degree of randomness in the system. One can decrease the scatter by letting the system ‘average’ out some of the noise by choosing e.g. the 10th day [or the 8th or 12th, or so -doesn’t make much difference]. Here is a plot of the accumulated number of days with a sunspot number of zero as a function of time [in months] since the 10th spotless day: http://www.leif.org/research/accum-zero-ssn.png . The current minimum is the green curve. Curves for minima where the final count is greater than the median value are blue. Curves for minima where the final count is less than the median are red.
The green curve has slowed its growth and begun to flatten, perhaps at the 800 level. If so, there are only three cycles since cycle 8 with a lower count. Cycles following the ‘blue’ minima were less than average size, so one might surmise that cycle 24 also will be small [as predicted by other methods].
Simon Filiatrault (07:00:09) :
angular momentum (with respect to the invariant plane), so it should actually subtract in a vector sum of the system, but here it is added in the scalar sum
computing the scalar sum is meaningless.
The state of NASA solar science and analysis is on display.
Danimals:
“Would someone be kind and explain to me what the implication of this is on earth’s climate?”
see: http://www.timesonline.co.uk/tol/news/uk/article1363818.ece
As I understand it, it could relate to Henrik Svensmark’s work. The idea is that particles in cosmic rays penetrating the atmosphere provide the “seed nuclei” for clouds to form.
When the sun is in a period of relative inactivity, its magnetic field is weak, and when that’s the case, it is less effective in shielding the earth from charged cosmic particles. Hence, more clouds form, and so less heat from the sun gets through to warm the earth – resulting in global cooling.
However, when the sun is more active, its magnetic field deflects more cosmic particles and so less clouds form, and therefore more heat gets through. Sunspots are a sign of solar magnetic activity, hence the correlation between them and global warming.
Svensmark had a devil of a job raising funding to test his theory in the laboratory because it was hardly on-message in AGW terms, but eventually, he did, and demonstrated the effect experimentally. Now Cern is involved, are looking to test the theory on a much larger scale, and have much better funding to do that.
If I have any of this wrong, which is quite possible as I’m not an expert, doubtless someone will correct me, and I’d welcome that.
For a good explanation of how the sun (and the stars) influence Earth’s weather, go to YouTube and enter “The Cloud Mystery” and go through the six 10-minute videos (although I prefer the 7-video collage). That presentation discusses the way the sun’s sunspot maxima and minima control cosmic rays, which impacts Earth’s weather in an amazing way. It’s a bit technical but you can view it as many times as you want, getting more info with each view.
Think of it this way: Are clouds caused by climate, or is climate caused by clouds? The answer may surprise you (although the stubborness of the current AGWers to consider anything else other than CO2 probably won’t surprise you).
Jerry M (07:35:05) :
I’m probably way off base here, but, isn’t there a lag time between solar sunspots and world-wide temperature? Sort of like when the shortest day is Dec. 21, but it continues to get colder until Feb. 18 when the pace of the earth cooling matches the solar warming effects. What I’m saying is that we could be in for more cooling until 2012-2014 before a warmin uptrend begins to assert itself.
Just asking.
_____________
Jerry, I’m trying to find a paper put out recently by an insurance actuarialist who, having some time on his hands, applied his mathematical expertise to sunspot cycles and weather/temperature patterns and he found several things:
1) He was amazed with the correlation he saw (having worked just with health/life demographics for insurance estimates, typically his results are rather imprecise), and
2) He did indeed see a definite lag of about 2-3 years. So I’m expecting really cold weather to set in 2-3 years after the deep solar minimum which we may be in now, or it may not have happened quite yet.
Now I just have to find that reference.
Ap (A – Index) : another day with zero.
Christopher Moncton and Al Gore debate at last!
http://pathstoknowledge.net/2009/12/30/christopher-moncton-and-al-gore-debate-at-last
Leif Svalgaard (07:59:22) :
The green curve has slowed its growth and begun to flatten, perhaps at the 800 level. If so, there are only three cycles since cycle 8 with a lower count.
correction: higher count. And lower cycle size.
To:
Leif Svalgaard (07:59:22)
and
Galen Haugh (08:06:01),
Hey guys, thanks a lot for taking the time for my question – it was splendid help and very appreciated!!
Dan
New Jersey, USA.
We now have the opportunity to determine whether or not the Watts-effect conforms to P-symmetry. If violated, the sunspot numbers will continue to rise. If the effect conforms, the numbers will, um, decline.
We urgently need a tax on sun spots now, to keep the numbers down.
Sun spot trading anyone?
Thanks, for keeping us informed about Earth’s real heat source – the Sun!
With kind regards,
Oliver K. Manuel
Steve, Tallblokes, Galen,
Thanks, all. This is what I love about this site – always learning something new every day.
Ref – Leif Svalgaard (07:59:22) :
“We have almost complete daily coverage back to solar cycle 8 and can thus plot the number of spotless days during the minima between these cycles. To the extent that that count is a measure of the next cycle [and that is hypothetical, but not unreasonable as a large cycle during its rise would quickly squash the number of spotless days], one could use the rise of the accumulated count of spotless days during a minimum as a rough indicator of the size of the next cycle [as surmised e.g. by Jan Janssens http://users.telenet.be/j.janssens/Engwelcome.html ]”
____________
Dr Svalgaard
After referring to your link (above), I went to your link at http://www.leif.org/EOS/Holocene-TSI.pdf and took another look at the Figure 2. illustration/graph of TSI during the Holocene. Are you seeing anything yet in solar activity that leads you to suspect that the trend in TSI will go below zero over the course of the next several solar cycles? Another minimum?
Some posters above have been queuing for some insight to the possible relation between sunspot counts and climate change. I have done a little low key research along these lines. This is using pre-1990 type of science, you know, old-school.
Over long periods of time, say decades, if an extremely low sunspot count average tends to result in a cooling earth and if an extremely high sunspot count average tends to result in a warmer earth, like 1940s to 2002, then there must be a point somewhere between these extremes where there is basically no change in the earth’s temperature at all. But what average sunspot count would that be? My research led to a count of somewhere between 44-47.
I came to this number by doing an eleven year boxed average over the sunspot counts from 1700 to 2009 to remove the sine component. This is the same as an eleven year moving average advanced 5.5 years into the future to allow peaks and valleys to coincide at the same year as an un-averaged graph points.
You can try it yourselves. Go to http://www.sidc.be/DATA/yearssn.dat to get years and yearly average sunspot numbers. Separate into column one and two on a spreadsheet. In new column, for each year, average that year plus the five year before and the five years following. Now plot years and the averages in column three. You can now view this chart not as a temperature anomaly but as a factor which forces the global temperature anomaly.
Make a fourth column. For each year take the average sunspot number in column three and subtract, let’s say 46 from it and multiply this difference by a tiny number, say 0.00025 and add it to the previous value of the year before. That is: =D(n-1) + (C(n) – 46)*0.00025 for each year in row n. Now plot years in column one by this anomaly in column four. Look familiar? That’s pretty close to your average chart you see when looking at the global temperature anomaly found all over the internet, roughly.
This seems to imply the sun’s influence on the global temperatures but correlation is not cause. However, the sun is our very major source of all energy input so in the old-school science, I would first want to prove this wrong beyond a shadow of a doubt. The exact mechanism how the sun seems to exert 8-10 times the influence than is shown by irradiance variance is currently unknown. Some question the electric aspect via ions in solar wind. Some question the magnetic ties to the sun’s magnetic field. Neutrino flow would be a slimmer chance of influence and VERY hard to prove it, if any. These would, however, tend to explain why the other planets also have shown heating in the previous few decades. The clouds and water vapor are, of course, major players in heat retention and redistribution.
There’s a little insight into a far fetched relationship I stumbled upon.
By the way, the 0.00025, it’s units are (+/-) degrees / year / sunspot count in Celsius. Can account for ~0.00003 by irradiance. Real science will have to help here! This is just my best guess to the correct amount.
Yes, I know, there’s a hockey stick graph right in front of you now, strictly from the sun’s variability. Maybe AGW scientists had the anomaly correct but the cause wrong, the sun’s furnace, not 366 PPM of CO2.
A sample spreadsheet row 11: A is 1710.5, B is 3, C is =AVERAGE(B6:B16), D is =D10+(C11-46)*0.00025 .
By the way, 2009.5’s average sunspot count seems to end up 9.
Also, when you view that graph, keep in mind that major factors as El Nino, La Nina, PDO, AO, NAO etc can delay or advance this line for many years. The two major ways for the Earth to “hide” heat. On is to shove it deep in the oceans. The other is to absorb it in melting ice. To show “self heating” is the opposite. Seems these factors are why this graph doesn’t exactly follow the anomaly reconstructions.
The theory is that an active sun will block cosmic rays from entering earths atmosphere. An inactive sun will allow these cosmic rays to enter our atmosphere. Actually, this appears to be more than a theory, because there is correlation with causation. Cosmic rays can be accurately measured, and here is the chart since 1964.
http://cosmicrays.oulu.fi/webform/query.cgi?startdate=1964/10/20&starttime=00:00&enddate=2009/12/30&endtime=07:16&resolution=Automatic%20choice&picture=on
You can see that we have the highest amt of cosmic rays since measurements began. The increased cosmic rays are theorized to increase formation of lower clouds which block out the sun from warming our planet, thereby leading to possible global cooling.
The length of the sun cycle is theorized by many to be more important than the amt of sun spots.
http://www.davidarchibald.info/papers/Archibald2009E&E.pdf
go to root directory for more papers.
Mean Montly Sunspots – scroll to bottom.
ftp://ftp.ngdc.noaa.gov/STP/SOLAR_DATA/SUNSPOT_NUMBERS/MONTHLY
This slide show might spin your head around to how complex this situation is, with many, many variables and complex systems.
http://www.lavoisier.com.au/articles/greenhouse-science/solar-cycles/IanwilsonForum2008.pdf
Pascvaks (09:07:07) :
Are you seeing anything yet in solar activity that leads you to suspect that the trend in TSI will go below zero over the course of the next several solar cycles? Another minimum?
Solar activity is now back to where it was ~100 years ago, so I expect TSI [as the HMF] also to be back to the values that long ago. As solar activity can’t drop lower than zero, there is not much further decrease in TSI to expect. Low cycles often come in bunches, so a few low cycles in the coming years would be expected [but not certain, of course]. Whether one would name this a special ‘minimum’ is an arbitrary matter of taste. The Eddy Minimum has been suggested and sounds good to me. Another Maunder Minimum-style minimum is uncertain. One might surmise that if Livingston is right, that sunspots will become harder to see [but still be there] and that that might be an explanation of a Maunder Minimum-style low sunspot count. We know that cosmic ray modulation was still taking place during the MM so solar activity did not go away.
You have to ask why they don`t run the old equipment alongside the modern, might it be they are trying to hide the decline.