By Joseph D’Aleo, AMS Fellow, CCM
In this recent post, we discussed the problems with recent data that showed the argument presented by the EDF’s millionaire lawyer playing clueless environmentalist on Lou Dobbs Tonight that this will be the warmest decade is nonsense. This claim was well refuted and Al Gore’s credibility disassembled by Phelim McAleer, of the new documentary Not Evil, Just Wrong that challenges the lies and exaggerations (totalling 35) in Al Gore scifi horror comedy film, An Inconvenient Truth. 9 were serious enough for a UK judge to require a disclaimer itemizing them be read whenever, the movie was shown in the schools.
The world’s climate data has become increasingly sparse with a big dropoff around 1990. There was also a tenfold increase in missing months around the same time. Stations (90% in the United States which has the Cadillac data system) are poor to very poorly sited and not properly adjusted for urbanization. Numerous peer review papers suggest an exaggeration of the warming by 30%, 50% or even more. The station dropout can be clearly seen in the two maps below with the number of station going from over 6000 to just 1079 from April 1978 to April 2008.


See the big gaps in the recent data in Canada, Greenland, Africa, South America, parts of western Asia, parts of Australia.
SEE FOR YOURSELF
Take this test yourself to see how bad a shape the global data base is. Look for yourself following these directions using the window into the NOAA GHCN data provided by NASA GISS here.
Point to any location on the world map. You will see a list of stations and approximate populations. Locations with less than 10,000 are assumed to be rural (even though Oke has shown that even a town of 1,000 can have an urban warming of 2.2C).
You will see that the stations have a highly variable range of years with data.
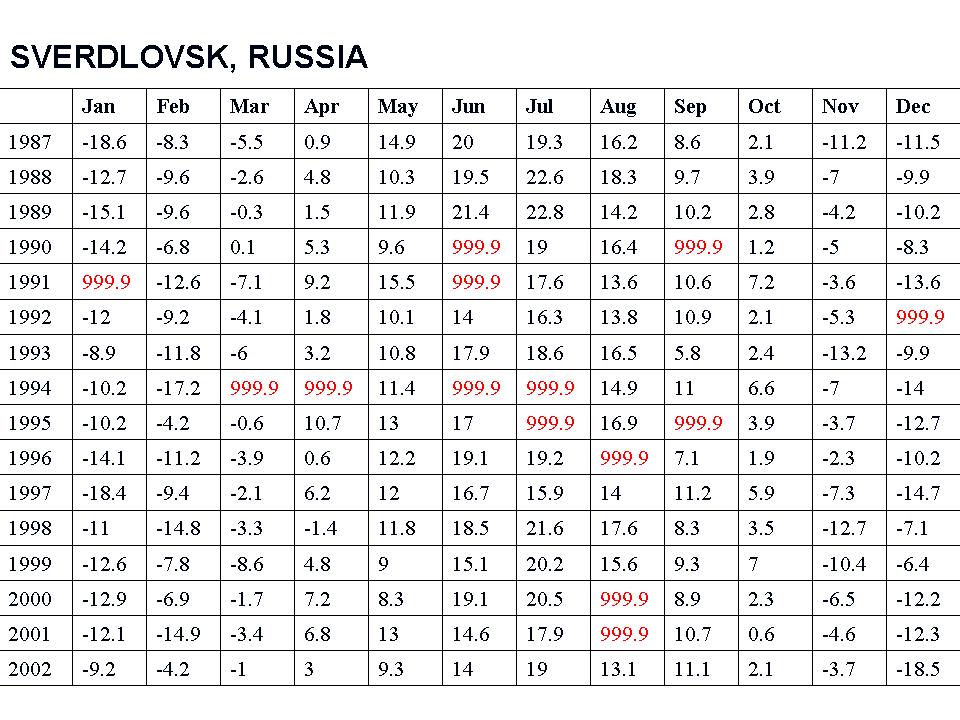
Try and find a few stations with data that extends to 2009. To see how complete the data set is for that station, click in the bottom left of the graph Download monthly data as text.
For many, many stations, you will see the data set in a monthly tabular form has many missing data months mostly after 1990 (designated by 999.9).

See larger image here
This required the data centers to estimate data for the grid box for that location with other stations nearby (homogenization). In the 2008 plot above only 1079 stations were used. NASA went to locations within 250 km (155 miles) to find data for the grid boxes. For grid boxes without stations within 250 km, they are left blank, thus the large gaps.
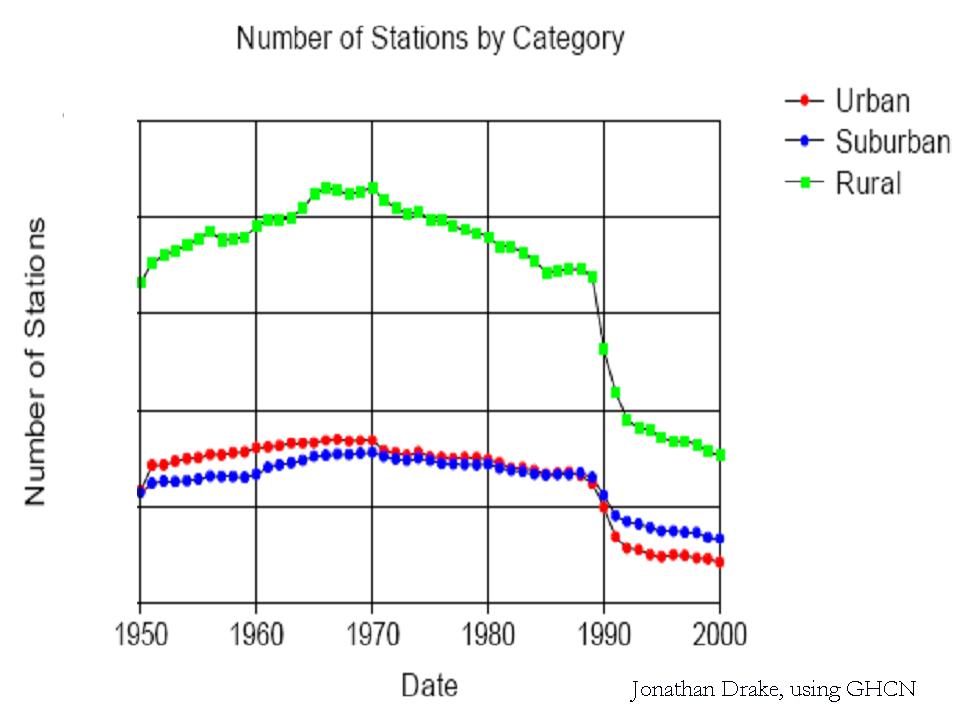
Most of the stations that dropped out were rural. More of the missing data points are having their missing months filled in with more urban data in the grid boxes.

See larger image here
WUWT Volunteer John Goetz created this video that shows the worldwide dropout of weather stations:
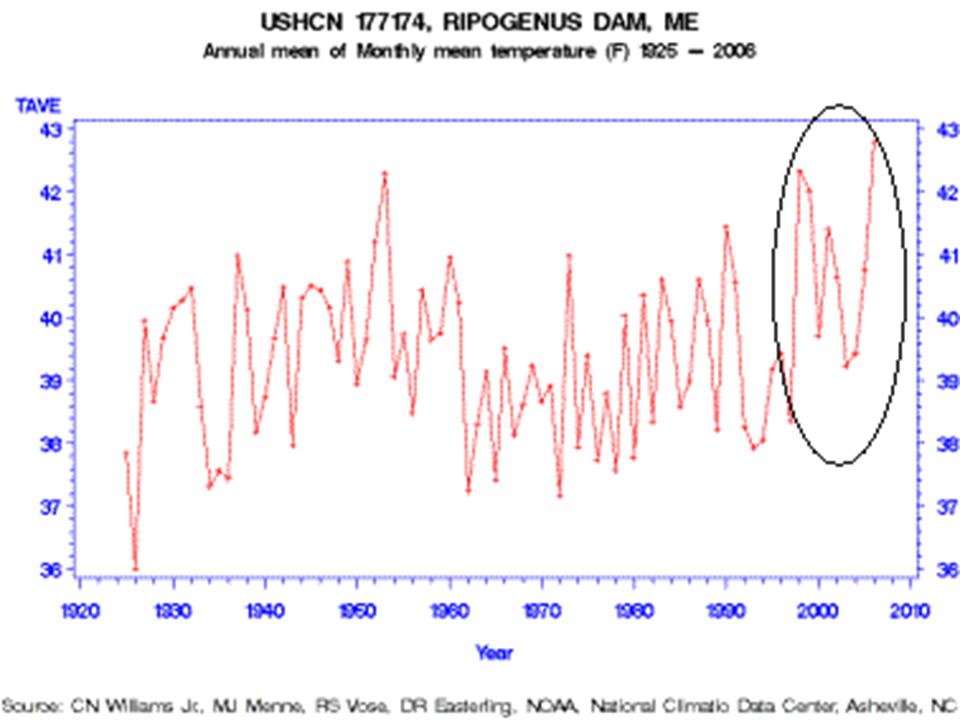
One example of how good or bad this works is from Maine. Volunteers completed surveys of the United States Historic Climate Network (USHCN) temperature stations in Maine for Anthony Watts surface station evaluation project. The survey determined that every one of the stations in Maine was subject to microclimate or urbanization biases. One station especially surprised the surveyors, Ripogenus Dam, a station that was officially closed in 1995.

See larger image here
Despite being closed in 1995, USHCN data for this station is publicly available until 2006! (GISS stopped in 1995)
Part of the USHCN data is created by a computer program called “filnet” which estimates missing values. According to the NOAA, filnet works by using a weighted average of values from neighboring stations. In this example, data was created for a no longer existing station from surrounding stations, which in this case as the same evaluation noted were all subject to microclimate and urban bias, no longer adjusted for. Note the rise in temperatures after this before the best sited truly rural station in Maine was closed. GISS does display this station that did incorporate the “filnet” data input for missing months although as noted they stopped its plot in 1995 which NOAA extended artificially to at least 2006.
How can we trust NOAA/NASA/Hadley assessment of global changes given these and the other data integrity issues? Given that Hadley has destroyed old original data because they were running out of room in their data cabinet, can we ever hope to reconstruct the real truth?
As one of our scientist readers noted: “Well, the 999.9s you showed me today sure opened my eyes…the ramifications are stunning. I knew about the drop-off of stations before but never that existing station reports are so full of gaps or that they’re getting temperature readings from “ghost” stations. This is, as you have said, GARBAGE. See PDF here.
Has anybody figured out what global temperature is? It seems to me like it’s a myth, perpetrated by the hoaxers. Probably based on the same math as the computer models.
How could you possibly take the global temperature and have it mean anything.
The drop out of rural data points is critical here.
For me, the most accurate way of measuring global temperature, free of UHI effects, is to SOLELY use rural stations.
This article shows either a cunning plan since 1990 to artificially drive the ‘global warming’ agenda, or a rather fortuitous series of events which happened to make such an agenda more likely to apparently fit the hypothesis.
I suspect the former, but I have no proof of it.
Does anybody else??
George E. Smith (09:44:23) :
Do any of these “Climatology or Climate Science” courses at any of the Major Universities ever mention the Nyquist Sampling Theorem;
You can’t generate meaningful statistics if you have data containing no information.
Funny you should mention Nyquist, after looking at thier output, they have incredibly poor spatial resolution. If they were photo journalists, the editor would have them canned.
Oh, but they do generate statistics, all the time, it just doesn’t have any value unless one is out to create art by grinding dirt into a Rembrandt.
@ur momisugly astateofdenmark (09:33:01)
Re Bournemouth Airport UK (Hurn) known as EGHH
Have a look at this web page:- http://weather.gladstonefamily.net/site/EGHH
It shows the weather station compound adjacent to taxiways and aircraft parking
cheers
Patrick Silchester Hants>
The idea that there is something wrong with our climate is preposterous,
the global plot to regulate and curb CO2 emissions plainly criminal.
This is a crime against humanity as is Chapter 21.
Both are related.
http://canadafreepress.com/index.php/article/15713
So they use observations to model the future and they use models to create the observations. Reality is becoming a computer simulation. Is this the Matrix?
Svalbard airport at 78N, a reference climate station, part of the network of stations particularly suited for climate change studies, has a record going back to 1911. That makes it very interesting for climate change studies, since the arctic is of special interest in climate studies and there are few stations there. However, the actual observations only go back to 1975. Everything before that has been reconstructed. About half of the missing data has been homogenised from a station a few km away but in quite different topology, the rest from stations 10’s or even 100’s of km away or from interpolations. While such reconstructions are interesting, they don’t really have a place in a data set which we expect to consist of real observations. Do the climate researchers know when they’re using real weather observations and when they’re using computed weather? Do they care?
astateofdenmark (09:33:01) :
First time I’ve done this so if I get something wrong/miss something obvious feel free to flame.
___________________________________
We don’t flame at WUWT.
Rhys Jaggar (11:33:20) :
Even if it were possible to take a global temperature, it is meaningless as just a temperature reading.
As I have stated before, if a given volume of humid air warms 1ºC & the same volume of dry, (arid), air cooled 1ºC, the average temperature hasn’t changed but the energy level has.
DaveE.
Rhys Jaggar (11:33:20) :
If you believe a certain thing to be true and if in 1990 there was not much difference in temperature reported from, lets say, 8000 observations and 1000 observations and since 1000 is easier to manage, then why not drop the other 7000. That might be their reasoning. And … since the remaining observations support what they believe to be happening, then they have no reason to doubt the result.
People tend to weight information that validates their beliefs higher than data that invalidates their beliefs.
If the data comes out that shows what they expected, it (the result) is left as is without further checking. If the data results in an outcome counter to what is expected, then it is checked and rechecked and checked again.
This is why errors have been found most often when they produced a cold anomaly than when they produced a warm anomaly.
If you expect temperatures to warm, a hot spot generates an alarm for some kind of action to mitigate it. A cold spot generates and alarm to inspect the data.
Steve McIntyre is the only one I am aware of that inspects the data when unusual warming is seen.
A message for astateindemark and others. I live in the west of England and have been studying the Ross on Wye weather information going back to the 1850’s.
I am not an expert so have had some difficulty understanding the raw data but there does not seem to be much difference in the temperatures in the last 150 years. When I mention this in dinner parties etc I am usually shouted down. I have been very supicious of the term global warming as who was taking the global temperatures in the nineteeth century except the U.S.A and modern Europe?
Please contact me as I feel that I am the only person in the U.K that is questioning the whole issue of global warming data.
This, plus the big holes in World cover and obviously a lack of reliable temporal History for the precision needed, is what makes me say that we don’t know what is going on. We might even be getting warmer. But the corrupt AGW “science” destroys everything.
As an extension of what I said previously.
Say the tropics, (humid) were to cool & remain at the same humidity & the mid latitudes to the poles were to warm. You could end up with an increase in global temps with no change in energy.
Mix any temp/humidity changes to get the same results.
DaveE.
Really fantastic work. Very impressive.
One of the disadvantages to data collection is the inconvenience of having to go into the real world and do it. With just a handful of congenially sited interferometers around the globe the temperature can be taken reliably.
Measure the increase in CO2 from this morning, pro-rate the value 1 based on a doubling, multiply by 6 for WV feedback, state temperature. No more UHI, no more Vostok, no more bristlecone pines.
My New Video’s Made it on Prison Planet
http://www.prisonplanet.com/lou-dobbs-al-gore-not-evil-just-wrong-global-warming-debate.html
These “mean” monthly temperatures are the average of the daily means of the maximum and minimum temperatures aren’t they ? How well does the average of two daily points represent changes in daily temperature ?
It’s really sad. Just look at that big dark red blotch in the south of Norway where I live: It’s probably mostly due to “rural” Gardermoen: http://data.giss.nasa.gov/cgi-bin/gistemp/gistemp_station.py?id=634013840003&data_set=1&num_neighbors=1
(which I fear is used to correct a lot of stations in Sweden too…)
Only problem: Gardermoen isn’t rural anymore, since 1998 it’s home to Norway’s main Airport. I don’t know how close to the runways they measure temperature, but the whole area is obviously not the same as it used to be.
It would appear the only accurate temperature measuring that might even come close to true representation is satellite based. I wonder of we could find a willing person who could explain how that is done. I would like to know how they do it …
It’s clear ground based data is virtually useless for serious science — unless you did an exceptional study of each data site before you allowed the site’s data into the final model. And then, I wonder what you would really have.
Climate Myths and National Security
By Viscount Monckton of Brenchley
http://www.americanthinker.com/printpage/?url=http://www.americanthinker.com/2009/10/climate_myths_and_national_sec.html
The President of the United States recently told the United Nations that “global warming” poses a threat to national security and may engender conflicts as populations are displaced by rising sea levels, droughts, floods, storms etc. etc. etc. However, it is now clear that there is no basis for the notion that the barely-detectable human influence on the climate is likely to prove a threat to climate, still less to national security.
The first principle to which any national security advisor must adhere is that of objective truth. Though he must have an understanding of politics, he is not a politician: he is a truth-bearer. Therefore, he begins by narrowing down the issue to a single, central question whose answer determines whether the suggested threat is real. He then tries to find the truthful answer to that question, and draws his conclusion from that.
Quid enim est veritas? What, then, is the truth? The single question whose answer gives us the truth about the climate question is this: By how much will any given proportionate increase in CO2 concentration warm the world? We now know the answer. The oceans, which must store 80-90% of all heat-energy accumulated in the atmosphere as a result of the radiative imbalance caused by greater greenhouse-gas concentration, have shown no net accumulation of heat for almost 70 years, implying a very small influence of CO2 on temperature (Douglass & Knox, 2009). The devastating analysis of cloud-albedo effects shortly to be published by Dr. Roy Spencer of the University of Alabama at Huntsville will show that the UN has wrongly decided that cloud changes reinforce greenhouse warming, when in fact they substantially offset it. Repeated studies of the tropical upper troposphere (e.g. Douglass et al., 2008) show that it is failing to warm at thrice the surface rate as required by all of the UN’s models, again implying very low climate sensitivity. The clincher is Professor Richard Lindzen’s meticulous recent paper demonstrating – by direct measurement – that the amount of radiation escaping from the Earth’s atmosphere to space is many times greater than the UN’s models are all told to believe. From this, the world’s most formidable atmospheric physicist has calculated that a doubling of CO2 concentration, expected over the next 150 years, would cause 0.75 C (1.5 F) of warming, at most: not the 3.4 C (6 F) that the UN takes as its central estimate.
Most analysts would stop there. Yet some might ask, “Suppose that the single satellite on which Lindzen’s results depend is defective. What then?” They might consider the economic cost of attempting to mitigate the “global warming” which, as our Monthly Reports demonstrate, is not actually happening. The figures turn out to be startlingly simple. To mitigate just 1 C (2 F) of warming, one must forego the emission of 2 trillion tons of CO2. The world emits just 30 billion tons a year. So the analyst, as a thought-experiment, would shut down the entire world economy, emitting no CO2 at all. Even then, and even on the incorrect assumption that the UN’s exaggerated projections of the effect of CO2 on temperature are correct, it would take 67 years to mitigate 1 C warming. Preventing the 3.4 C (6 F) warming that the UN’s climate panel thinks would occur in 100 years would take 225 years without any transportation, and with practically no electrical energy. The national security advisor would at that point advise his head of government that there has never been any security threat less grave, or more expensive to prevent, than the non-problem that is “global warming”. It is the fearmongers that are the real national security threat.
“”” DaveE (11:53:06) :
Rhys Jaggar (11:33:20) :
The drop out of rural data points is critical here.
For me, the most accurate way of measuring global temperature, free of UHI effects, is to SOLELY use rural stations.
This article shows either a cunning plan since 1990 to artificially drive the ‘global warming’ agenda, or a rather fortuitous series of events which happened to make such an agenda more likely to apparently fit the hypothesis.
I suspect the former, but I have no proof of it.
Does anybody else??
Even if it were possible to take a global temperature, it is meaningless as just a temperature reading.
As I have stated before, if a given “””
Actually there is nothing wrong with having UHIs included in the temperature data gathering; after all, Gaia uses those UHI temperatures; every one of them, plus all the ones that don’t even have thermometers.
But if you think the UHI temperature recorded outside the Department of Environmental Science Building at the Universoty of Arizona should be used to represent the temperature 1200 km away, or even up at Flagstaff; you’d be in for a rude awakening.
But the most glaring error in all of the data gathering is this max/min twice a day strategy for getting the daily mean at any one site location. A max/min recording strategy is only usable if the daily temperature (diurnal) cycle is a purely sinusoidal waveform. That is the only situation in which the sampling method is valid for a 24 hour cyclic variation. I doubt that actual daily temperature graphs at a fixed lkocation are ever sinusoidal; so the daily average is wrong before you even start to worry about the spatial sampling frequencies, whcih are undersampled by orders of magnitude.
And as others have stated; even if you could calculate the correct average temperature; which you can’t (Gaia can and does), that tells you exactly nothing about energy flows; either local or global. It has no scientific significance whatsoever to know the global mean temperature.
I’ve been looking into the discrepancy between the stations that have been retained and the stations that have been dropped over the past few years.
I’ve looked at a selection of stations in Alaska and California. In both areas the dropped stations showed the 1930’s to be as war, or warmer than the late 1990’s to early 2000’s and the retained stations have been mostly in urban areas and show the 1930’s to be much cooler than the late 1990’s to early 2000’s. This has had the effect of cooling off the 1930’s. It’s a neat trick to “cool off” the 1930’s from a vantage point in the early 2000’s.
This is a graph of Alaska stations that were dropped after 1990 compared to the stations retained in 2009…
Alaska
The dropped stations show the 1930’s to be about 0.5C warmer than the retained stations.
Here’s a comparison of California stations dropped in 2007 to stations retained in 2009…
California
The California “2009” curve is dominated by Los Angeles and it shows about four times as much 20th century warming as the “Rural” curve does (1.85 C vs 0.45 C).
I’m sure it’s just a coincidence, but the station dumping started about the same time that James Hansen was promoted from NASA-GISS climate science manager to NASA-GISS Director in 1981… And that the station dumping accelerated after he published his 1988 model.
NASA-GISS Stations
How bad is the global temperature data? Truly, we have no idea.
And this is the 21st Century, folks.
=======================================
I like many others who post here, am very concerned regarding the accuracy, reliability and consistency of the data which underpins the concept of runaway global warming. But although these concerns are dealt with from time to time by WUWT in posts such as this, what impact is any of this having on MSM and the majority perception of global warming? The mantra of peer review is constantly invoked even though recent revelations suggest this process is a lot less stringent than it used to be. What I’m really trying to say is that the questioning of global warming is not reaching all that many people. I truly despair at the bastardisation of science that is occurring with climate change and which is shown so clearly in this article and I fear the sceptics have lost the war. Sorry for the negativity but I feel so frustrated that fair debate in the MSM is not permitted.
Dr A Burns (13:15:05) :
This is something I intend to check as soon as I have enough funds to build my continuous temp monitor.
I also mean to check the validity of TOBs.
DaveE.
“”” Dr A Burns (13:15:05) :
These “mean” monthly temperatures are the average of the daily means of the maximum and minimum temperatures aren’t they ? How well does the average of two daily points represent changes in daily temperature ? “””
Dr Burns, I just got through that above.
If the temperature variation thorughout the day is a pure sinusoidal waveform with a period of 24 hours; then the Nyquist Sampling Theorem says you must sample it at least at 12 hour intervals, in order for those two samples to allow you to reconstruct the continuous function and hence properly compute the average.
Actually at just twice the signal frequency sampling rate; you have a degenerate case, and you can’t reconstruct the waveform (what if your two samples came at the 0 and 180 degree zero crossing points). But fortunately you can still get the correct average as the average of your two readings.
But daily temperature graphs are not sinusoids, as the heating and cooling parts of the daily temperature are not symmetrical. So that means that at the very least your temperature function must have at least a second harmonic signal with a 12 hour period; and that means you need to get samples at 6 hour intervals. Now throw variable cloud cover into the daily picture, and now you have temperature change signals at much higher frequencies, with periods of just a few minutes.
So the answer is NO, twice a dat temperature sampling will not give you the correct daily average temperature; it will be corrupted by aliassing noise; since the reconstructed signal spectrum is filded back all the way to zero frequency and beyond; so even the average is not recoverable.
But consider the long wave infra-red radiation emitted from the surface. That varies about as the 4th power of the temperature. And if you take the 4th power of a sinusoidal function, oand integrate it over a full cycle, you will get an always positive offset, that depends on the amplitude of the cyclic variation, relative to the average or DC temperature. For typical daily temperature ranges from max-min, that offset is significant; and when you consider the cyclic temperature range for the annual cycle through four seasons, the underestimate of total emitted LWIR is quite significant; and failure to properly calculate it (by using average temperatures), always underestimate the global emittance, which leads to an over estimate of the mean global temperature required to balance the total solar insolation.
The central limit theorem does absolutely nothing for you in buying a reprieve from a Nyquist violation; the aliassing noise becomes a permanent inherently unremoveable part of the reconstructed temperature funtion; because that out of band signal is convolved into an in band noise, whcih can’t be removed without removing real signal as well.
But Statistical mathematics is so much easier to teach than Sampled data system theory, and signal recovery.