Note this a mirrored posting of Steve McIntyre’s Climate Audit post. The Climate Audit Server is getting heavy traffic and is slow to load – here is the article exactly as he wrote it yesterday. -Anthony
Yamal: A “Divergence” Problem
The second image below is, in my opinion, one of the most disquieting images ever presented at Climate Audit.
Two posts ago, I observed that the number of cores used in the most recent portion of the Yamal archive at CRU was implausibly low. There were only 10 cores in 1990 versus 65 cores in 1990 in the Polar Urals archive and 110 cores in the Avam-Taymir archive. These cores were picked from a larger population – measurements from the larger population remain unavailable.
One post ago, I observed that Briffa had supplemented the Taymir data set (which had a pronounced 20th century divergence problem) not just with the Sidorova et al 2007 data from Avam referenced in Briffa et al 2008, but with a Schweingruber data set from Balschaya Kamenka (russ124w), also located over 400 km from Taymir.
Given this precedent, I examined the ITRDB data set for potential measurement data from Yamal that could be used to supplement the obviously deficient recent portion of the CRU archive (along the lines of Brifffa’s supplementing the Taymir data set.) Hantemirov and Shiyatov 2002 describe the Yamal location as follows:
The systematic collection of subfossil wood samples was begun, in 1982, in the basins of the Khadytayakha, Yadayakhodyyakha and Tanlovayakha rivers in southern Yamal in the region located between 67°00 and 67°50 N and 68°30 and 71°00 E (Figure 1). These rivers flow from the north to the south; hence, no driftwood can be brought from the adjacent southern territories At the present time, the upper reaches of these rivers are devoid of trees; larch and spruce-birch-larch thin forests are located mainly in valley bottoms in the middle and lower reaches.
Sure enough, there was a Schweingruber series that fell squarely within the Yamal area – indeed on the first named Khadyta River – russ035w located at 67 12N 69 50Eurl . This data set had 34 cores, nearly 3 times more than the 12 cores selected into the CRU archive. Regardless of the principles for the selection of the 12 CRU cores, one would certainly hope to obtain a similar-looking RCS chronology using the Schweingruber population for living trees in lieu of the selection by CRU (or whoever).
As a sensitivity test, I constructed a variation on the CRU data set, removing the 12 selected cores and replacing them with the 34 cores from the Schweingruber Yamal sample. As shown below, this resulted in a substantial expansion of the data set in the 19th and 20th centuries and a modest decline in the 18th century. (Hantemirov and Shiyatov 2002 had reported a selection of long cores of 200-400 years; while the CRU archive does not appear to be the precisely the same as the unavailable Hantemirov and Shiyatov 2002 archive, it does appear to be related. This pattern of change indicates that the age of the CRU cores is systematically higher than the age of the Schweingruber cores.)

Figure 1. Comparison of core count. Black – variation with Schweingruber instead of CRU; red- archived version with 12 picked cores.
The next graphic compares the RCS chronologies from the two slightly different data sets: red – the RCS chronology calculated from the CRU archive (with the 12 picked cores); black – the RCS chronology calculated using the Schweingruber Yamal sample of living trees instead of the 12 picked trees used in the CRU archive. The difference is breathtaking.

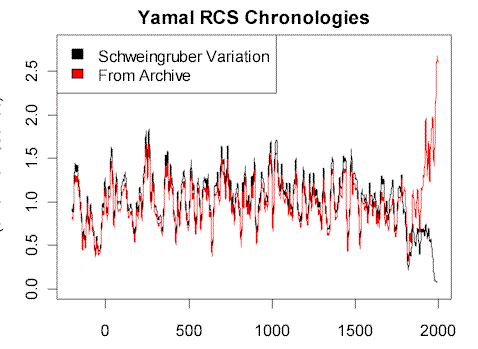
Figure 2. A comparison of Yamal RCS chronologies. red – as archived with 12 picked cores; black – including Schweingruber’s Khadyta River, Yamal (russ035w) archive and excluding 12 picked cores. Both smoothed with 21-year gaussian smooth. y-axis is in dimensionless chronology units centered on 1 (as are subsequent graphs (but represent age-adjusted ring width).
Finally, here is another graphic showing the same two RCS chronologies, but adding in an RCS chronology on the merged data set obtained by appending the Schweingruber population to the CRU archive – this time retaining the 12 cores. Unsurprisingly this is in between the other two versions, but most importantly it has no HS.

Figure 3. Also showing merged version up to 1990. (After 1990, there is only the few CRU cores and it tracks the CRU version.)
I hardly know where to begin in terms of commentary on this difference.
The Yamal chronology has always been an exception to the large-scale “Divergence Problem” that characterizes northern forests. However, using the Schweingruber population instead of the 12 picked cores, this chronology also has a “divergence problem” – not just between ring widths and temperature, but between the two versions.
Perhaps there’s some reason why Schweingruber’s Khadyta River, Yamal larch sample should not be included with the Yamal subfossil data. But given the use of a similar Schweingruber data set in combination with the Taymir data (in a case where it’s much further away), it’s very hard to think up a valid reason for excluding Khadyta River, while including the Taymir supplement.
Perhaps the difference between the two versions is related to different aging patterns in the Schweingruber population as compared to the CRU population. The CRU population consists, on average, of older trees than the Schweingruber population. It is highly possible and even probable that the CRU selection is derived from a prior selection of old trees described in Hantemirov and Shiyatov 2002 as follows:
In one approach to constructing a mean chronology, 224 individual series of subfossil larches were selected. These were the longest and most sensitive series, where sensitivity is measured by the magnitude of interannual variability. These data were supplemented by the addition of 17 ring-width series, from 200–400 year old living larches.
The subfossil collection does not have the same bias towards older trees. Perhaps the biased selection of older trees an unintentional bias, when combined with the RCS method. This bias would not have similarly affected the “corridor method” used by Hantemirov and Shiyatov themselves, since this method which did not preserve centennial-scale variability and Hantemirov and Shiyatov would not have been concerned about potential bias introduced by how their cores were selected on a RCS chronology method that they themselves were not using.
Briffa’s own caveats on RCS methodology warn against inhomogeneities, but, notwithstanding these warnings, his initial use of this subset in Briffa 2000 may well have been done without fully thinking through the very limited size and potential unrepresentativeness of the 12 cores. Briffa 2000 presented this chronology in passing and it was never properly published in any journal article. However, as CA readers know, the resulting Yamal chronology with its enormous HS blade was like crack cocaine for paleoclimatologists and got used in virtually every subsequent study, including, most recently, Kaufman et al 2009.
As CA readers also know, until recently, CRU staunchly refused to provide the measurement data used in Briffa’s Yamal reconstruction. Science(mag) acquiesced in this refusal in connection with Osborn and Briffa 2006. While the Yamal chronology was used in a Science article, it originated with Briffa 2000 and Science(mag) took the position that the previous journal (which had a different data policy) had jurisdiction. Briffa used the chronology Briffa et al (Phil Trans B, 2008) and the Phil Trans editors finally seized the nettle, requiring Briffa to archive the data. As noted before, Briffa asked for an extension and, when I checked earlier this year, the Yamal measurement data remained unarchived. A few days ago, I noticed that the Yamal data was finally placed online. With the information finally available, this analysis has only taken a few days.
If the non-robustness observed here prove out (and I’ve provided a generating script), this will have an important impact on many multiproxy studies that have relied on this study.
Tom P (19:52:22) :
Tom P. Steve McIntyre did no reconstruction. He plotted data that was recently released. That’s not a reconstruction. Its a plot of standardized ring widths.
Tom P what are your thoughts on the two big “however” adversatives in the intro and the closing.
Sounds like the authors are trying to adhere to the Scientific Method….which is most admirable.
That is certainly more congruous with the inquisitive, awe-inspired, inductive approach that one should expect in scientific research…
…as opposed to the “Cliff Notes” version you first linked to which the non-member is left with these two words: “antrhopogenic forcing”.
Hmm…this paper, with the major “howevers” in the intro and the conclusion…can hardly be reduced and juxtaposed to the two words “anthropogenic forcing.”
Thank you for disclosing the link to the entire article.
No wonder they want to make it difficult for the public to review.
There is damning vagueness within.
You gotta love that word “However”.
RES IPSA LOQUITER
Chris
Norfolk, VA, USA
“Sounds like the authors are trying to adhere to the Scientific Method….which is most admirable.”
Having published a few research papers myself over the years, you lean to target the people who are funding you. You tell them what they want to hear, but as a scientist, you try to stay honest.
That is why I always look for the “qualifying” words in the published research paper and try to understand what the authors were actually trying to say.
Unless you can read the full published report, you will never get to see those “qualifying” words that kept the scientists honest.
So my bad for not running a wide browser window. – Anthony
A real man admits his mistakes, or even, in this case, if there is no mistake, admitting temporal limitations.
One of the many reasons to why I am drawn to this site…is because of the owner’s intransigent fairness.
Mad props.
Chris
Norfolk, VA, USA
Unless you can read the full published report, you will never get to see those “qualifying” words that kept the scientists honest.
Understood…but, after reading the full report, the two sentences that stand out most strongly, in the intro and the conclusion, where the strong adversative “however” throws up a roadblock…those two statements are VERY telling as to the scientist’s efforts to defer to the Truth…and to CYA a little bit.
And with good reason…
The gravity of what they are saying at that point can not be overlooked.
They are saying: “We just don’t know.”
Nothing wrong with honesty.
Chris
Norfolk, VA, USA
Anthony: [ personal message ]
Thanks Steve, I want one. This is the closest I get to programming something like that:
http://www.stormpredator.com
It ain’t AWACS but it also isn’t virtual reality either.
Thanks for what you do. – Anthony
Lets see if I can help people understand Tom P.s effort to obscure the issue at hand.
For a chronology this is the best place to start
http://www.climateaudit.org/?p=7168#comment-357334
in 2008 Briffa published the paper that Tom P cites. And thanks to the journal he published it in, he had to archive his data.
In the 2008 paper Briffa included a handful (12) cores from a set of trees
and did not include another sample (Schweingruber) of 34 cores.
Steve’s chart shows this and only this.
1. The core data that Briffa used in his paper. the red line CRU archive.
2. The core data if you use the 34 cores INSTEAD of the 12 ( black line)
3. The core data if you use both. The Green Line.
This is NOT a temperature reconstruction. NOT. as the label clearly shows it is a graph of RCS. This represent Age adjusted ( age of the tree) ring WIDTHS. These are simply graphs of the data available to briffa when he wrote the 2008 paper. Data that comes from the international tree ring database.
There is only one relevant question on the table.
1. why did briffa select the 12 cores as opposed to the 34?
The standard defense ( esper) in such a selection is that the 12 cores are well correlated with temperature, while the 34 are not. This is known as cherry picking. If Briffa has no other criteria for selecting these cores or deselecting the 34 cores then BRIFFA’S reconstruction has no statitical validity. To RECONSTRUCT past temperature from a modern day temperature correlation requires a statistical methodology. That methodology demands that the sample be selected randomly. The construction of confidence intervals depends on this random selection. Simply, briffa can cherry pick the series he wants BUT THEN he loses the ability, loses the mathematical ability, to do a reconstruction.
The series steve plots ( remember he is just plotting data that has been archived by climate scientists) show what is called the divergence problem.
Some samples go up wildly, others go down. In the past, I believe briffa has just truncated the offending portion of the data! in this paper he ignored it all together.
PS. I’m a believer in AGW Tom, but bad statistics is bad statistics.
“Do you believe my selection criteria that proxies should reflect instrumental temperatures for the last 150 years is biasing those proxies from indicating a warmer medieval period a thousand years ago?”
Yes, your selection criteria are wrong. I have explained it to you twice now; once on Climate Audit and once here. And you keep asking the same question again and again without acknowledging the answer that I have already given you. What is your problem.
A good picture of the divergence phenomena.
http://www.climateaudit.org/?p=7168#comment-357684
The red line is the Briffa dozen. The black line is the Schweingruber 34.
one goes up, the other goes down.
Spin as he might Tom P can’t make this go away. It’s a problem that dendro’s are still trying to figure out. Did these trees cease to be treemometers? where they ever? what caused this? They are “looking into” this problem. But in this case Briffa picked a jury of 12 with no apriori selection criteria. Peeking at the correlation with temperature Biases the selection and destroys the reconstruction of past temperatures. That’s just a fact you can’t weasel word your way around
At the moment, I will continue to defend Tom P. for providing the research paper.
The actual content of that paper will require much more detailed analysis, but on the surface, there were enough “weasil words” to keep the authors honest.
Of course, with about 100 gazillian trees under the age of 100 years, why is getting a very accurate sample size such a problem?
You tell the people who are funding your research exactly what they want to hear, but try your best to keep honest as a scientist. Not an easy ballance to achieve!
Stick a fork in their arses Steve, turn them over, there’re done!
I know, but out of respect, I am giving Tom P. the benifit of the doubt, since he obviously thought that this research paper proved that Steve McIntryre was an idiot.
Rather than jump on Tom P., I will await his full analysis of both of their raw data sources and see how well he does. This may end up being rather interesting.
REPLY: wear your snark helmet. – A
Tilo,
Tom P does NOT get the statistics behind a reconstruction.
Tom to see your lunacy you only need to extrapolate your reasoning about selecting cores based on correlation with temperature. Briffa selected 12 cores. Cores that correlated well with temperatures. You think this is the right approach. Now consider, of these 12 cores, ONE core will have the BEST correlation. Why use any others? That one core should give the BEST estimate of the temps in the MWP according to your reasoning. Seems a bit odd, doesnt it? You want more cores. (Why, because the BEST core may actually be a fluke– it may even have a super warm MWP). And what will you do with those cores? Why you compute statistics. And when you have to calculate a CI you use a method that gives you a valid answer IFF the samples are selected at random. like DUH! So, you can select cores that correlate “well” ( define that) but by doing so you LOSE the ability to construct an estimate of past temperatures with non infinite confidence intervals.
Every single one of my comments from yesterday at the guardian were deleted. No place-holder left, even. I was deliberately polite and non-confrontational, too.
Every post replying to my posts has been deleted.
History has been rewritten!
I recommend the use of side-wiki for sites like that 😉
It’s not called the guardian for nothing.
Steve Huntwork (00:07:52) :
Steve McIntyre is not an idiot, and I have never suggested he was. He made an error in his calculations. That something was wrong became apparent when I looked at the temperature record.
steven mosher (00:11:25) :
You need multiple overlapping core records, and the more the better, to extract a temperature proxy index from tree rings – that’s what RCS chronology outputs. There’s no basis for selecting a single tree, just a series from a particular locality.
It is possible to look at each independently derived series and see if they follow temperature across the known record, amongst other quality controls, to determine inclusion in the final reconstruction.
Of course discounting some series will impact the statistics, but the alternative is to add at best noise, and possibly inject a systematic error if an obviously faulty series, such as McIntyre’s originally miscalculated Schweingruber variation, is included.
The central limit theorem is not relevant to this discussion – the errors are not independent but correlated over time. The aim of the selection is therefore to remove data series that are not correlating with the known signal over its record.
John A (17:29:49) :
@ur momisugly Philip_B (16:16:57)
The other possibility is that tree rings are not temperature proxies at all. The chimera is the belief that temperature rings capture mean temperatures.
Then we are left with, why pre-1970 tree rings seem a reasonable temperature proxy within a resolution of few decades?
Although given the apparent rampant cherry picking in tree ring proxy studies, the pre-1970 results could just be that, cherry picked the trees that looked like the best temperature reconstruction.
Here i made an illustration of the divergence problem:
http://www.klimadebat.dk/forum/vedhaeftninger/divergence.gif
Se how close the REAL yamal curve lies to the normal proxi average. (On this graf most major proxies are included, even Briffas. Here the proxies included in the illustration above:
http://wattsupwiththat.files.wordpress.com/2009/04/lanser_holocene_figure1.png?w=509&h=275
an updated fig2 from this article:
http://wattsupwiththat.com/2009/04/11/making-holocene-spaghetti-sauce-by-proxy/
And the temperatures that this paper highlights are believable too.
http://rstb.royalsocietypublishing.org/content/363/1501/2269/F1.large.jpg
a. is summer data
b. is winter data
There is a slight but erratic cooling in the Victorian era. A discernable warming in the 1930s 40s, as we know. And a slight warming in the 1980s and 90s. But nothing dramatic – again, just as one might assume.
One can look at this paper and think ‘that sounds about right’.
.
>>>Every single one of my comments from yesterday at
>>>the Guardian were deleted.
And mine were not even put up on the board in the first place!
.
I notice in the conclusion to the Royal society paper that the only factors or variables dealt with are tree ring width and inferred temperature, with no account taken of precipitation, volcanic eruption or extreme conditions, that latter two which can shut down tree growth for a time. then there are pest infestations, the competition for nutrients in any given warm or cool period, wind, sunlight etc.
Merely measuring the width gives no indication of temperature, mainly because many other factors indicate tree growth or lack of growth
steven mosher (00:11:25) :
Yes, I agree with you
– selecting the cores that give you the result you want invalidated the whole point of the analysis.
I have another question, in he Briffa article, 5. RELATIONSHIPS BETWEEN TREE GROWTH AND CLIMATE
– Briffa only considers precipitation & temperature as being possible influences on tree ring growth
– surely he should consider CO2 levels
– the ‘hockey’ stick has always looked like a better proxy CO2 levels than a proxy for temperature!
(since it erases the MWP etc!)
It’s worth mentioning that Siberian and Russian high latitude temperature stations are sparse and subject to large anthropogenic local influences, such as building heating.
It is also noticeable that the recent summer warming trend shown in the paper starts a couple of years after the Soviet Union fell when many social and economic changes were starting.
I am frankly sceptical that the instrument record processed through CRU’s model (which amongst other things averages temperatures over large distances) gives an accurate representation of temperatures on the taiga where the trees were growing.
At any rate, here is the tree line elevation of northern polar Urals a for the last millenia
http://rstb.royalsocietypublishing.org/content/363/1501/2283/F12.large.jpg
Following that time the treeline descended to approximately 270 m during the LIA and then ascended to its present elevation of approximately 310 m during the recent warming of the late nineteenth and twentieth centuries. As yet, it hasn’t reached its MWP elevation
“You have a very short memory. McIntyres’ original reconstruction contradicted the temperature record and I said therefore that it should rejected. In fact this reconstruction had indeed been miscalculated.
The correctly calculated reconstruction is in much better agreement with the temperature record and in fact has excellent correlation with Briffa’s results throughout the entire pre-instrument period.
Briffa’s results are confirmed, not contradicted, by McIntyre’s corrected analysis.”
Tom, recent events (the information in this thread) says you are full of crap. Just because it correlates with temperature does not mean you are measuring temperature. You are just as likely measruing nutrient level, rainfall, hours of daylight, or CO2 aerial fertilization. I can put of a graph of how the reduction in sea piracy since the 1800s correlates very well with increasing global temperature, and it would mean just about as much as a tree telling me what the temperature.
Again, when there are dozens of chronologoes in the same area that DO NOT correlate with temperature, they are EVERY BIT as valid as those that do, and you just simply DO NOT get to throw them out because you don’t like they way they look….