
We’ve been lectured time and again about the importance of having climate science work come from peer reviewed papers, saying that the work of dedicated amateurs has no place in climate science unless the work rises to publication/peer review level.
Yet that doesn’t seem to apply for United Nations science publications. Of course just one look at the front cover at left tells you its more about selling than science.
The cover image pulls at heartstrings, making the world appear as if it is running out of time before turning entirely into an inhospitable desert. That is an extreme view in my opinion.
Steve McIntyre’s blog discovery of UNEP’s folly bears repeating, because it shows the sort of sloppy science that is going into “official” publications.
This is much like the NCDC CCSP report just over a year ago where they used a photoshopped image of a “flooded” house.

In this case, the United Nations simply grabbed an image from Wikipedia that supported the view they wanted to sell. The problem with the graph in the upper right of page 5 of the UNEP report is that it itself has not been peer reviewed nor has it originated from a peer reviewed publication, having its inception at Wikipedia.
And then there’s the problem of “Hanno” who is an anonymous contributor. This is simply his/her artwork and interpretation. We don’t have any idea who “Hanno” is, nor apparently does UNEP.
Yet UNEP cites the graph as if it was a published and peer reviewed work as “Hanno 2009”. Yet UNEP doesn’t even get the year right as the graph was created in 2005:

But as Steve McIntyre shows us, this graph from “Hanno” is just another variation of Mann’s discredited Hockey Stick based on questionable mathematics, outright errors such as data inversions, and dubious or excluded proxies that may not reflect temperature change at all.
From Climate Audit:
The UNEP CLIMATE CHANGE SCIENCE COMPENDIUM 2009 on page 5 uses the following graph from Wikipedia (not the IPCC Fourth Assessment Report):

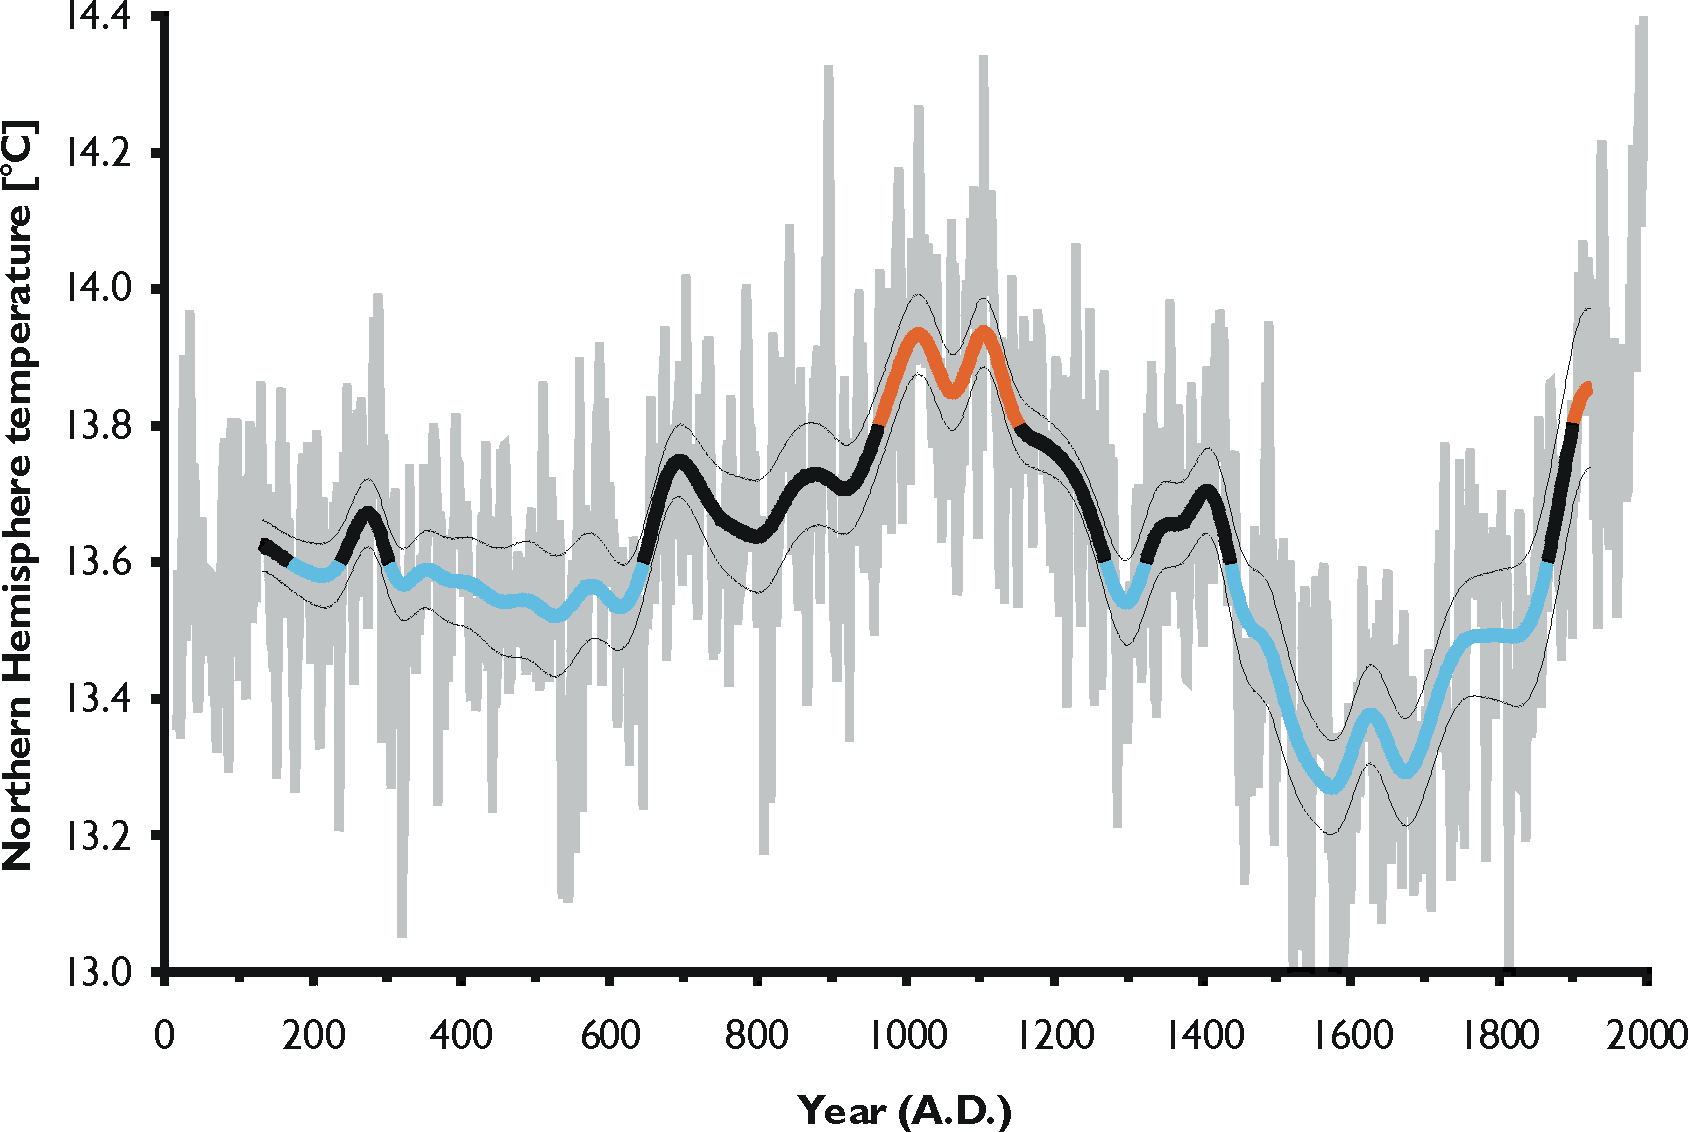
CO2 concentration and mean global temperature during the past millennium. CO2 levels (blue line, lefthand axis) are given in parts per million, temperatures (red line, right-hand axis) in degrees Celsius. Source: Hanno 2009 Page 5
Hanno is the pseudonym for a Wikipedia contributor. The graphic itself compares CO2 levels from Mauna Loa and Law Dome ice core to a splice of the HAdCRU temperature index and the Jones and Mann 2004 reconstruction (dominated by Graybill bristlecone chronology).
The latter splice is, of course, the splice that Mann has informed us is never done by responsible climate scientists, further informing us that the allegation that such splices are done is disinformation by fossil fuel companies.
No researchers in this field have ever, to our knowledge, “grafted the thermometer record onto” any reconstrution. It is somewhat disappointing to find this specious claim (which we usually find originating from industry-funded climate disinformation websites) appearing in this forum.
========
I’ve done some additional review and here is what I’ve found about “Hanno”
First here is the Wikipedia source for the image:
http://commons.wikimedia.org/wiki/File:CO2-Temp.png
The following 4 pages on Wikimedia Commons link to this file. UNEP likely got it from the first page during a Google search.
UPDATE: From a Climate Audit commenter “Feedback”: Hanno is also the author of a non-hockey stick graph that can be found in the Norwegian Wikipedia article about the Migration Period (Norwegian: Folkevandringstiden) that shows a more Lamb-like relationship between the MWP and the current warm period:
Source is said to be:
Source: graph drawn by Hanno using data published by A. Moberg, D.M. Sonechkin, K. Holmgren, N.M. Datsenko, W. Karlén, and S.-E. Lauritzen (2005, Highly variable Northern Hemisphere temperatures reconstructed from low- and high-resolution proxy data. Nature (London), 433, 613–617). Temperatures for the last three decades of the 20th Century were taken from P.D. Jones, D.E. Parker, T.J. Osborn & K.R. Briffa (2005, Global and hemispheric temperature anomalies – land and marine instrumental records. In Trends: A Compendium of Data on Global Change. Carbon Dioxide Information Analysis Center, Oak Ridge National Laboratory, U.S.
http://no.wikipedia.org/wiki/Fil:NH_temperature_2ka.png
So apparently “Hanno” contradicts himself with his own set of artwork.
UPDATE2: The Wiki “Hanno” user page is interesting. Thanks to commenter “Dr. Spock”.
Discover more from Watts Up With That?
Subscribe to get the latest posts sent to your email.
Icarus
I see you failed to produce your proof work showing Miskolczi is wrong.
I still wait.
Icarus (16:22:54) : The planet is actually warming at about 0.2°C per decade and has been doing so for several decades
The earth is cooling troll.
Icarus (16:22:54) : What do you attribute this to, if not primarily the anthropogenic increase in greenhouse gases?
Natural variation causes the earth to warm and cool. But trolls can’t say the words ‘natural variations are the reason for climate change’. Because as soon as they say them they stop being a troll.
As soon as you want to become human Icarus say those words. It’s magic.
RACookPE1978 (08:07:22) : 900 years ago, the earth was as warm (or warmer) than it is now. And it cooled off, dropping well below today’s temperatures. Clearly there was NO positive water vapor feedback mechanism.
How does this follow? Since water vapour is a feedback, it will respond to forcings from other factors, e.g. solar irradiance. A positive feedback effect doesn’t make it impossible for temperatures to fall. Why would it?
Now let us examine the relationship between changing atmospheric CO2 levels and global temperatures over the past 120 years:
From 1890-1940 CO2 was constant, and temperatures rose.
From 1940-1973 CO2 was increasing, and temperatures fell.
From 1973-1998 CO2 was increasing, and temperatures rose.
From 1998-2009 CO2 was increasing, and temperatures fell.
Your first statement is simply false –
https://sites.google.com/site/europa62/climatechange/fig2-3
The mid-century cooling is accounted for by aerosols from dirty industry which has now been significantly cleaned up.
Since then global temperature is been consistently rising at 0.2°C per decade and is still doing so, as CO2 is rising at an accelerating rate.
Seems like the relationship between CO2 and global temperature holds pretty well.
Icarus (16:44:26)
You say: “Turning up the CO2 isn’t much different from turning up the sun, and we all agree that turning up the sun would make the planet warm up.”
The question is how much will it warm up. Your claim above was 3.7 W/m2 for a doubling of CO2. Not catastrophic. You then implied catastrophe would come from water vapor feedback. But an increase in water vapor will lower the 3.7 W/m2, cut it in half in a likely scenario. This is not difficult to understand, the spectral lines are filled with the extra water vapor.
So “scientists” on your side invented a new theory, CO2 GH effect in the upper atmosphere where there is less water vapor. You might want to read about it so you can add it to your spiel.
I used the word ‘claptrap’ some time back and it was picked up by Icarus and Jeff Alberts. Thinking about the alarmist ravings I believe that a quotation of Charles Darwin in 1871 is enormously relevant – even enjoyable! – in this context:
Ignorance more frequently begats confidence than does knowledge – Charles Darwin 1871
Icarus
I see you were back here again and still failed to produce your proof work showing Miskolczi is wrong.
If your findings show that his assumption is wrong than lay out the case here, with all its detail. Let us see if you work is correct.
Do you have proof work for your claim?
Icarus (17:42:54) : Seems like the relationship between CO2 and global temperature holds pretty well.
For a certain ilk it does.
You remind me a lot of a person I debated on YouTube for months. He made claims that he would never back with data. He would repeat claims made by people like Al Gore and just merely for the fact that people like Al Gore made the claims was evidence enough for him that the claims were true—or at least true enough to be repeated, repeated ad nauseum. His ID at YouTube was grastog1313 (among other ID’s he used). Are you grastog1313 ?
Jeff Alberts (17:26:47) :
You said it better than me!!
Slightly OT but I see that Google Earth is to do a version which will ‘show the effects of global warming on the earth’ Amazing!
Gene Nemetz, I asked the *inestimable (J.) Iscariot if he would be of mind to apply the “The Precautionary Principle” SHOULD global cooling be indicated to be underway by instrumental record , in say, another 10 years … still no reponse.
I queried him/her what would be a possible choice of action, and further proferred three options as detailed again below:
a) Campaign for an INCrease in the use of CO2 based fuels (thereby REVERSING the cooling)
b) Continue a push for a DECrease in the use of CO2 based fuels (thereby HASTENING the cooling trend, leading to potential crop failure et al)
c) Do nothing.
and to this point, no response. I surmise he/she has not even considered the possibility of cooling, such has been his/her steeped indoctrination into/with AGW.
.
.
* inestimable: that [which] cannot be estimated or measured
.
.
A person whom I don’t know (or, to use this site’s terminology, “an anonymous author”) has drawn my attention to this URL. Reading this item and its commentary has been a Kafkaesque experience. At least as bizarre as the guesswork about my person, however, is the density of miscomprehensions about the logics of attribution, the aims of wikipedia, and the methods of science. The following remarks address some of them.
About attribution:
1) I have no connection with UNEP and have not been involved in the preparation of their Climate Change Science Compendium, nor was I even aware of its existence before this site was brought to my attention.
2) Having said this, UNEP was free to use the material because it was released under an open licence.
3) A quotation of a source does not indicate that the originator agrees in the conclusions drawn from it in the secondary publication.
About wikipedia and wikimedia:
4) Use of wikipedia as a source of illustrations (or other information) is not objectionable per se, it is so if and only if the validity of the information has not been verified using other reliable sources.
5) By creating or uploading images to wikimedia, the creator or uploader does not express agreement with the information displayed by the image, but may wish to (a) present influential (and potentially mutually exclusive) views for a balanced presentation of a controversial topic, (b) show earlier views to describe the history of a debate, (c) illustrate falsified ideas in order to explain common misunderstandings.
6) How well-accepted the information displayed in a figure is, cannot, therefore, be inferred from the mere fact that it is available at wikiMedia, it should be inferred from the text in the encyclopedia entries in wikiPedia that use this figure.
About science:
7) The figures that I have uploaded to wikimedia are not, and do not claim to be, anything but correct representations of the data they explicitly cite as their source.
8) The sources I have used are publicly available data from peer-reviewed scientific articles.
9) I do not and cannot guarantee the correctness of scientific articles that I have not authored or co-authored myself.
10) If anyone thinks to have found errors or weaknesses in any of my own publications, he or she is welcome to point out these mistakes by submitting an article to the journal were my original research has been published.
About global warming:
11) The conclusions arrived at by the IPCC or the UNEP do not critically depend on the curve colloquially referred to as the “hockey stick” nor an any other specific reconstruction of the climate of the past, but on the cumulative body of peer-reviewed knowledge.
12) The effects of global warming cannot be mitigated by censoring science, nor by threatening messengers to silence.
The level and tone of this debate (and of the enigmatic and intimidating e-mails that I have received lately) has not exactly increased my interest in participating beyond the above rectifications. I will therefore refrain from further comments.
Kind regards,
Hanno Sandvik
Hanno (01:57:08)
Thanks for commenting. I am sorry that you received intimidating emails. I do not believe they are representative of the vast majority of readers or commentators of this site.
Icarus,
“I haven’t read that the global average temperature varies by 4°C in the course of a year – can you find a reference for that?”
http://adsabs.harvard.edu/abs/2006AGUFM.A13D0970S
This NASA site says that “The annual cycle in temperature is massive relative to most climate variations, generally exceeding even the amplitude of glacial-interglacial temperature changes.”
You then said: “Regardless of the value though, it seems to me that any such temperature range would necessarily already include the water vapour feedback, since it responds on a very short timescale (a few days).”
Then doesn’t it seem very strange to hypothesise a run away warming when global average temperatures exceed 2C (or whatever they regard as a tipping point) when the global average ocillates twice this amount annually?
@Hanno (01:57:08) :
Thank you for your post. I appreciate having the opportunity to read your views on the kerfluffle.
Sorry to hear about the enigmatic and intimidating e-mails. Speaking only for myself, I don’t condone or participate in such activity.
Icaraus:
“I think your average CO2 of 2000ppmv is an exaggeration – I’ve seen quoted a *peak* of 1,130 ppmv). ”
It is not an exaggeration, I assure you. See below:
http://web.me.com/uriarte/Earths_Climate/Abundant_CO2.html
Your quotation of 1,130 ppmv seems to have been lifted from a paper called “Atmospheric carbon dioxide linked with Mesozoic and early Cenozoic climate change”. It appears they have used a new technique called carbon isotope fractionation.
Icarus:
“If the sun was weaker, the CO2 concentration was subtantially larger, and the global temperature was substantially higher, doesn’t that support the concern that anthropogenic increases in CO2 will cause climate change well outside the normal range of the last 10,000 years or so.”
During the late ordovician, CO2 levels climbed to 5,000 ppm yet the world entered a glaciation. Doesn’t that cast doubt of the claim that CO2 drives climate?
_Jim (22:06:45) :
I quit expecting much from AGW believers. They don’t know the logic of the arguments. They just have an environmentalist and political bias. Whatever helps their bias is what they will repeat.
Vincent (04:41:51) :
http://adsabs.harvard.edu/abs/2006AGUFM.A13D0970S
This NASA site says that “The annual cycle in temperature is massive relative to most climate variations, generally exceeding even the amplitude of glacial-interglacial temperature changes.”
Thanks for the link – very interesting. However, the paper appears to talk about the annual cycle in particular regions, not the planet as a whole. Of course we all know that in extratropical regions there is a large difference between the mean temperature of winter and summer months, but that doesn’t mean the planet is warming and cooling as a whole, in the course of a year. I’d be interested to find out whether it does.
You then said: “Regardless of the value though, it seems to me that any such temperature range would necessarily already include the water vapour feedback, since it responds on a very short timescale (a few days).”
Then doesn’t it seem very strange to hypothesise a run away warming when global average temperatures exceed 2C (or whatever they regard as a tipping point) when the global average ocillates twice this amount annually?
I think ‘oscillates’ is the key word here. If, for example, you had summer weather in the Arctic all year long then there would be no ice left in a very few years, but of course that is not the case – it gets cold again in the winter, and the ice reforms. When you’re talking about global warming you’re talking about a sustained rise in temperatures over decades and centuries, not something that oscillates around a mean. You’re talking about warming that isn’t counteracted by equivalent cooling (that’s the whole point) – Isn’t that why the glaciers are shrinking, the permafrost is thawing etc?
Icarus,
I think this discussion is beginning to veer into speculation. You refer to “sustained rise in temperatures over decades and centuries.” Do I need to remind you that this is the output from computer models, and that those predictions are controversial?
Hanno:
I join those who have expressed regret at the offensive emails you have received. Over the years I have obtained many such offensive emails from AGW-believers and I am shocked that you have received similar distressing messages from persons who disagree with your views. All such unsolicited messages should be condemned, and I condemn them.
Icarus:
You correctly say:
“Thanks for the link – very interesting. However, the paper appears to talk about the annual cycle in particular regions, not the planet as a whole.”
For actual source data go to
http://www.ncdc.noaa.gov/oa/climate/research/anomalies/index.php
It says there (I hope this will line up in this copy).
Global Mean Monthly Surface Temperature Estimates for the Base Period 1901 to 2000
Land Surface
Mean Temp. J F M A M J J A S O N D Annual
1901 to 2000 (°C) 2.8 3.2 5.0 8.1 11.1 13.3 14.3 13.8 12.0 9.3 5.9 3.7 8.5
1901 to 2000 (°F) 37.0 37.8 40.8 46.5 52.0 55.9 57.8 56.9 53.6 48.7 42.6 38.7 47.3
Sea Surface
Mean Temp. J F M A M J J A S O N D Annual
1901 to 2000 (°C) 15.8 15.9 15.9 16.0 16.3 16.4 16.4 16.4 16.2 15.9 15.8 15.7 16.1
1901 to 2000 (°F) 60.5 60.6 60.7 60.9 61.3 61.5 61.5 61.4 61.1 60.6 60.4 60.4 60.9
Combined Mean
Surface Temp. J F M A M J J A S O N D Annual
1901 to 2000 (°C) 12.0 12.1 12.7 13.7 14.8 15.5 15.8 15.6 15.0 14.0 12.9 12.2 13.9
1901 to 2000 (°F) 53.6 53.9 54.9 56.7 58.6 59.9 60.4 60.1 59.0 57.1 55.2 54.0 57.0
As you can see, global temperature rises by 3.8 deg.C from January to July and falls by 3.8 deg.C from July to January.
Please note that the highest global temperature is when the Earth is furthest from the Sun during each year and, therefore, it is an empirical fact that mechanisms within the climate system have much more effect on global temperature than change to incoming vs outgoing radiation.
And I wonder why some people think a rise of global temperature of 2 degC would pass a catastrophic “tipping point” when global temperature rises by nearly double that during each year and recovers within the same year, and it does this every year.
Also, you seem to think that transitions between glacial and interglacial conditions support your arguments. They do not.
The Earth is constrained within close limits of global temperature in each of two stable states; viz. glacial and interglacial. And its temperature has been the same within narrow bounds in each of those stable states throughout the ~2.5 billion years since the Earth gained an oxygen-rich atmosphere. Importantly, the Earth’s surface has had liquid water throughout that time, but heating from the Sun has increased by about 30% over that time. If that additional radiative forcing from the Sun had a direct effect on temperature then the oceans would have boiled to steam long ago.
Clearly, the climate system contains very strong constraints that keep global temperature within close boundaries in each of the two stable states.
So, I wonder why an increase to radiative forcing of at most 0.4 per cent from a doubling of atmospheric carbon dioxide concentration is supposed to threaten a “tipping point” when ~30 per cent increase to radiative forcing from the Sun has had no discernible effect on global temperature.
But the global temperature does constantly vary within the boundaries of its stable state. Its present state is the interglacial state and has been for ten millennia. At issue is why the global temperature varies within the boundaries.
There are many known and unknown reasons for the variations. But, clearly, atmospheric CO2 concentration is not a significant reason for the variations.
Richard
“I don’t know what ‘cap and trade’ means. I don’t think the average American does,” Kerry said. [source]
Vincent (05:08:48) :
During the late ordovician, CO2 levels climbed to 5,000 ppm yet the world entered a glaciation.
Cite, please?
Doesn’t that cast doubt on the claim that CO2 drives climate?
My understanding is that atmospheric CO2 is closely correlated with global temperature for many millions of years into the past, as demonstrated by several different data sets, e.g:
http://www.ipcc.ch/graphics/ar4-wg1/jpg/fig-6-3.jpg
It’s difficult to dispute this kind of evidence, unless you’re going to claim that the evidence is entirely fake – a complete invention. So, can we agree that generally when the world has been warm, CO2 has been high, and when the world has been cool, CO2 has been low?
Obviously in the distant past you had a cooler sun (which would mean higher levels of greenhouse gases to achieve a particular temperature than is the case today), you had very different arrangements of the continents (e.g. a large proportion of the Earth’s land mass centred on the South Pole), and so on – factors which make a direct comparison with today’s climate impossible. Saying that (for example) there was a particular time many millions of years ago when CO2 was higher and global temperature was lower doesn’t disprove this correlation between CO2 and temperature. It remains a fact that higher temperatures are correlated with higher CO2, and lower temperatures are correlated with lower CO2.
Agreed?
Vincent (11:14:15) : Icarus,
I think this discussion is beginning to veer into speculation. You refer to “sustained rise in temperatures over decades and centuries.” Do I need to remind you that this is the output from computer models, and that those predictions are controversial?
It was you who brought up the issue of a sustained rise in global average temperature (of 2°C or more), not me.
Icarus:
No. Because at times when CO2 has been many times its current concentration and rising, the Earth has descended into a severe Ice Age. So, can we agree that CO2 does not cause runaway global warming?
This graph shows CO2 levels over approximately the same time frame as your UN/IPCC graph: click. [click in the image to expand]
That chart shows that elevated CO2 levels have been many thousands of ppmv, for over a hundred million years at a time. During that time the planet both warmed and cooled.
And to find evidence of a ‘cooler sun’ you will have to go back billions of years, not millions.
Your understanding is wrong. The only correlation between temperature and CO2 is when rising CO2 follows rising temperature. There is no cause and effect between rising CO2 and subsequent rising temperature.
Finally, the R² correlation between recent increases in CO2 and the temperature is so low that it is indistinguishable from noise: click.
It wouldn’t be a bad idea for you to spend some time going through the WUWT archives, in order to get up to speed on the subject.