By Joseph D’Aleo, AMS Fellow, CCM
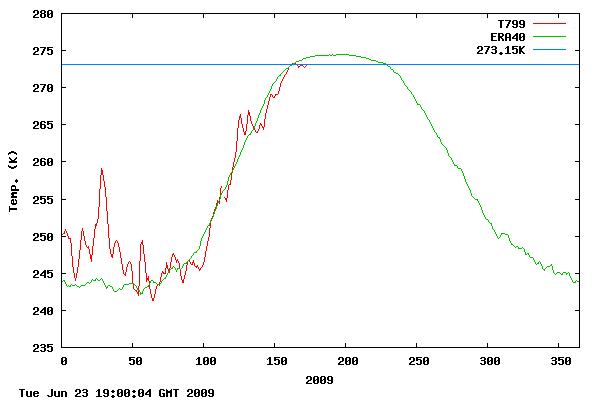
The average arctic temperature is still not above (take your pick) 32°F 0°C 273.15°K–this the latest date in fifty years of record keeping that this has happened. Usually it is beginning to level off now and if it does so, it will stay near freezing on average in the arctic leading to still less melting than last summer which saw a 9% increase in arctic ice than in 2007. H/T to FredM and MarcM

Data from DMI (Danish Meteorological Institute)
See larger image here. Compare with DMI charts in other years here.
[NOTE: as a second source to Joe’s article I’ve added this weather station data from the “North Pole Cam” operated by NOAA. Link is here: http://www.arctic.noaa.gov/gallery_np.html
There is a webcam at the “North Pole” (at least it starts out very near there) that reports via satellite data uplink at regular intervals. They also have a weather station with a once weekly data plot. Note it is still below zero centigrade there.

Latest data (updated approximately weekly) Readers should note that the station really isn’t at the north pole anymore due to significant ice drift. – Anthony ]
The AMSR-E shows the ice situation on June 23rd:

See where we stand relative to recent years in terms of total extent here. We are using JAXA-IJIS AMSR-E data to track ice as NSIDC is using older satellites and the new director Mark Serreze has proven untrustworthy. The next two months will be interesting. Temperatures usually begin flatlining in late June which would suggest less ice loss, although the water temperature beneath plays a key role and all of the warm water that entered the Arctic when the Atlantic was very warm in the middle 2000s (now is nearer normal) may not have circulated out yet.
The other question is what effect the early spring Mt. Redoubt eruptions may be having. Are the sulfate aerosols trapped in the arctic stratosphere reflecting back some of what sunlight reaches the high latitudes?

Along the edge of the arctic, Ross Hays who worked for CNN and then NASA who last year posted from Antartica sent this note to me “They have me working in arctic Sweden until mid July. One of the Esrange staff members told me that so far Kiruna had had the coldest June in 150 years!”
See PDF here.
A truly hilarious chart with linear trend lines would be to start at different points but end at the same point. It demonstrates cherry picking in such a comical fashion that most people will stop the practice at once. Chaotic systems should NEVER be cherry picked and then visualized with linear trend lines. The trend line means nothing. It is an artifact of chaotic data and provides no information whatsoever and worse, can mislead the researcher to wrong conclusions. If you haven’t studied statistics and its application to chaotic organic systems, you place yourself at risk of basing your assumptions on inappropriate analysis. And this is true for both sides of the AGW/natural climate trend argument.
This is especially true for the IPCC models. They were built based on the statistical linear trend basis (a wrong assumption because of the misleading artificial nature of a statistical linear trend in a chaotic set of data). It is this premise that is causing the models to fail. They do not model a chaotic system, regardless of whether or not human consumption is causing warming. The risk of a false negative is as high as a false positive. Here is the risk they fail to see: the models can fail to prove their premise, even if they are right.
Lee Kington (07:27:48) :
” I expect that part of the reason for it will be declared, by some, to be due to the decrease in CO2 emissions during the global economic recession. It will be spun. Count on it.
”
Yup! That’s how they’ll spin it.
Dennis Sharp (07:52:33) :
Leif, are you sure there is no correlation between the sun and earth climate?
No, there is certainly one, namely a 0.07 degree solar cycle variation caused by the 0.1% variation of TSI. Even so, this small variation is hard to show because the natural [and other] variability [‘noise’] is so high.
Longer term variations would harder to explain. Take away solar activity altogether and the temperature would drop about half of the 0.07 degrees and would be even harder to detect. Now, people that claim strong solar/climate connections postulate all kinds of amplifiers and feedbacks and lags and such, but have still to make a convincing case. I, for one, would not make such claims.
Heads up to all on WUWT!!!!!
The Climate denial crock of the week is announcing a new video that “promises to disprove/discredit the negative cloud feedback theory” they say it will be a few weeks before it gets posted.
Will there be a rebuttal to this?
Flanagan,
What you are saying does not make sense.
I posted a link to reputable ice results that shows we are well above last year’s ice.
What is it with AGW true believers that they cannot accept being wrong?
OT, but Gavin Schmidt is a ‘skeptic’????
This is from Fox News:
Global Warming May Be Slowing America’s Winds
Wednesday, June 10, 2009
Print ShareThisWASHINGTON — The wind, a favorite power source of the green energy movement, seems to be dying down across the United States.
And the cause, ironically, may be global warming — the very problem wind power seeks to address.
The idea that winds may be slowing is still a speculative one, and scientists disagree whether that is happening.
But a first-of-its-kind study suggests that average and peak wind speeds have been noticeably slowing since 1973, especially in the Midwest and the East.
“It’s a very large effect,” said study co-author Eugene Takle, a professor of atmospheric science at Iowa State University.
• Click here to visit FOXNews.com’s Natural Science Center.
In some places in the Midwest, the trend shows a 10 percent drop or more over a decade. That adds up when the average wind speed in the region is about 10 to 12 miles per hour.
There’s been a jump in the number of low or no wind days in the Midwest, said the study’s lead author, Sara Pryor, an atmospheric scientist at Indiana University.
Wind measurements plotted out on U.S. maps by Pryor show wind speeds falling mostly along and east of the Mississippi River.
Some areas that are banking on wind power, such as west Texas and parts of the Northern Plains, do not show winds slowing nearly as much.
Yet, states such as Ohio, Indiana, Michigan, Illinois, Kansas, Virginia, Louisiana, Georgia, northern Maine and western Montana show some of the biggest drop in wind speeds.
“The stations bordering the Great Lakes do seem to have experienced the greatest changes,” Pryor said Tuesday.
That’s probably because there’s less ice on the lakes and wind speeds faster across ice than it does over water, she said.
Still, the study, which will be published in August in the peer-reviewed Journal of Geophysical Research, is preliminary.
Related StoriesMeasuring Cow Burps in Fight Against Climate Change
U.N.: Nature Best at Handling Climate Change
Don’t Play Guilt Card, Environmentalists Told
There are enough questions that even the authors say it’s too early to know if this is a real trend or not. But it raises a new side effect of global warming that hasn’t been looked into before.
The ambiguity of the results is due to changes in wind-measuring instruments over the years, according to Pryor. And while actual measurements found diminished winds, some climate computer models — which are not direct observations — did not, she said.
Yet, a couple of earlier studies also found wind reductions in Australia and Europe, offering more comfort that the U.S. findings are real, Pryor and Takle said.
It also makes sense based on how weather and climate work, Takle said.
In global warming, the poles warm more and faster than the rest of the globe, and temperature records, especially in the Arctic, show this.
That means the temperature difference between the poles and the equator shrinks and with it the difference in air pressure in the two regions.
Differences in barometric pressure are a main driver in strong winds. Lower pressure difference means less wind.
Even so, that information doesn’t provide the definitive proof that science requires to connect reduced wind speeds to global warming, the authors said.
In climate change science, there is a rigorous and specific method — which looks at all possible causes and charts their specific effects — to attribute an effect to global warming. That should be done eventually with wind, scientists say.
Jeff Freedman, an atmospheric scientist with AWS Truewind, an Albany, N.Y., renewable energy consulting firm, has studied the same topic, but hasn’t published in a scientific journal yet. He said his research has found no definitive trend of reduced surface wind speed.
One of the problems Pryor acknowledges with her study is that over many years, changing conditions near wind-measuring devices can skew data. If trees grow or buildings are erected near wind gauges, that could reduce speed measurements.
Several outside experts mostly agree that there are signs that wind speed is decreasing and that global warming is the likely culprit.
The new study “demonstrates, rather conclusively in my mind, that average and peak wind speeds have decreased over the U.S. in recent decades,” said Michael Mann, director of the Earth System Science Center at Penn State University.
” A naysayer is Gavin Schmidt, a NASA climate scientist in New York who said the results conflict with climate models that show no effect from global warming”.
He also doubts that any decline in the winds that might be occurring has much of an effect on wind power.
But another expert, Jonathan Miles, of James Madison University, said a 10 percent reduction in wind speeds over a decade “would have an enormous effect on power production.”
Pryor said a 10 percent change in peak winds would translate into a 30 percent change in how much energy is reaped.
But because the research is in such early stages, she said, “at this point it would be premature to modify wind energy development plans.”
Robert Gramlich, policy director at the American Wind Energy Association, said the idea of reduced winds was new to him. He wants to see verification from other studies before he worries too much about it.
I do not understand why some scientists are doing studies of the effects of global Warming, when they should be doing some real sience to find and understand all of processess that cause variabliity in Earths climate.
Your URL does not want to post on Facebook. It seems that the URL
http://wattsupwiththat.com/2009/06/25/arctic-temperature-is-still-not-above-0%C2%B0c-the-latest-date-in-fifty-years-of-record-keeping%E2%80%A6%E2%80%9D/
is not nicely formatted for the Facebook script.
In the future, could you avoid weird character such as the degree symbol, and ellipsis and quote marks?
It must be those funky characters that screws up the script.
REPLY: I have no control over this, WordPress.com does this. But you can use TinyURL to convert the long string into a short one, then post the new smaller URL it makes. Try it, http://tinyurl.com/ – Anthony
Flanagan,
What you are saying does not make sense.
I posted a link to reputable ice results that shows we are well above last year’s ice.
What is it with AGW true believers that they cannot accept being wrong?
They claim their forecasts are more accurate than actual measured data. It must be a perception problem on the deniers end. Hey the thermometers are also wrong suddenly.
Flanagan said, “Melting is mainly due to contact with “hot” water, not melting from the top. When ice melts, energy is pumped in the environment (i.e. the process is endothermic) which tends to cool the surrounding atmosphere. ”
It sounds like he is claiming there is some sort of thermal pump that transfers energy from the atmosphere into the ice. This “cool(s) the surrounding atmosphere” but melts the ice from below. Because … the “hot” water is somehow the energy behind the pump.
Hunh ???
I don’t see how anyone of those who agree “in principle” with him can possibly design a natural physical system that does that. It violates the second law of thermodynamics in several different ways.
C’mon guys, try a little harder.
The AMSR-E data which is used by JAXA does not support this conclusion.
Therefore, Flanagan is just Making It Up, which is why he won’t show any actual source that makes this claim.
Actually JAXA does at present:
06,23,2008,10198438 (leap year)
06,24,2009,10171719
All the evidence you need is when the liberals changed Global Warming to Climate Change. Why would you do that? Global Warming is more scary and fear mongering then CC.
Keep bring up the facts because these Political Scientists can’t dispute facts even though they ignore them.
” wws (07:58:37) :
“For those who wonder where I got the idea that the sea ice extent is lower than last year, it simply comes from the JAXA results: simply follow the widgets on the right of this page.”
The AMSR-E data which is used by JAXA does not support this conclusion.
http://www.iup.uni-bremen.de:8084/amsr/amsre.html
http://www.ijis.iarc.uaf.edu/cgi-bin/seaice-monitor.cgi
Therefore, Flanagan is just Making It Up, which is why he won’t show any actual source that makes this claim.”
WWS: scroll up this page until you see the orange Sun on the right: two widgets above it is the link to sea ice that Flanagan is referring to.
I went to the link that CPT. Charles provided regarding the missing spring in the eastern Arctic. Birds are not able to reproduce because of the COLD.
Deep in the article I found this quote. It sent CHILLS up my spine:
“According to NOAA scientists, although the Arctic is warming, more frequent annual oscillations in temperature are likely to occur, often resulting in late springs.
“Such major oscillations are part of a bumpy ride toward global warming,” said Thomas Karl of the National Climate Center. “For awhile at least this will be the shape of things to come.”
Huh?!
OMG.
climate change covers every possibility…..global warming was far too constraining for the church of the environment and its high priests….its the biggest con in human history and our brain dead politicians cant get enough of it.
Can someone explain what happened in the beginning of the year?
http://ocean.dmi.dk/arctic/meant80n.uk.php What does that jagged red line above the green one mean 🙂
Jack Green (09:20:27) :
“All the evidence you need is when the liberals changed Global Warming to Climate Change. Why would you do that? Global Warming is more scary and fear mongering then CC.
Keep bring up the facts because these Political Scientists can’t dispute facts even though they ignore them.”
When did they change Global warming to Climate Change?
tulbobroke (09:44:47) :
Can someone explain what happened in the beginning of the year?
http://ocean.dmi.dk/arctic/meant80n.uk.php What does that jagged red line above the green one mean 🙂
While we’re at it does anyone know what their model is based on?
evanmjones (08:27:38) :
“I’ve said it before and I’ll say it again. You need to “include” both the 1998 El Nino and 1999-2000 La Nina IN or include both OUT. A starting point anywhere in between is cherrypicking (Especially from 1999).”
Ok Evanmjones: I selected (cherry picked) a range which includes both El Nino en La Nina you asked for and what do you see? A warming trend. So let’s stop this silly cherry picking and forget plotting trends over such short time intervals
http://www.woodfortrees.org/plot/rss/from:1996/plot/rss/from:1996/trend
I would expect that, even with the present surface air cooling, sea ice extent will continue to be below “normal” for the next few years, due to the massive thermal inertia of the oceans. Depending on how one interprets the data, the peak “plateau” of global temperatures occured from 1998-2007, a span of 9 years. The sea ice extent didn’t start to really noticably decline until 2005, continuing to stay below normal up to the present. So if in my overly-simplistic way, we deduce there is a 7 year delay between global air temperatures and arctic sea ice extent, we won’t be back “in the black” with regards to sea ice until 2014.
Forgive me if someone else has already posted this link in the comments. The North Pole cam also reports temperature data which is available here. It actually has been above 0C at times. It was for most of the 23rd.
REPLY: thanks, hadn’t seen that data link, all I knew about was the weekly updated graph. Also so everyone is clear, that buoy is not at the NP but has drifted on the ice about 160 miles SSW last time I checked. – Anthony
From the Dannish website: http://ocean.dmi.dk/satellite/index.uk.php
why is Norton sound in Alaska 14 deg C, much warmer than anywhere else?
“They have me working in arctic Sweden until mid July. One of the Esrange staff members told me that so far Kiruna had had the coldest June in 150 years!”
Thats probably correct since the average for sweden is the clodest june in 50 years.
I live in southern sweden and we finnaly got our first real summerdays in june this week.
wws: here’s the link to the data I’m referring to
http://www.ijis.iarc.uaf.edu/seaice/extent/plot.csv
I think things cannot be clearer than that.
About the post title: I think it is misleading. Many people here clearly think it means 273 K hasn’t been reached yet this year. The expression “is still not above 0”, in my sense, means that it hasn’t done it, not that it did but isn’t anymore. Moreover, in 2006 it hit 0 even later. 1992 was even worse.
I find more disturbing the two sentences that follows what you quoted:
Again, the two mantras are repeated over and over.
If temps go up its AGW, if temps go down, it is also AGW.
And if not, it is weather, you silly, don’t confuse climate with weather.